Mapping reservoir characteristics using earth's nonlinearity as a seismic attribute

a technology of nonlinearity and reservoir characteristics, applied in seismic data acquisition, seismology for waterlogging, instruments, etc., can solve the problems of not being unique, ambiguous, and failing to identify the higher porosity

Inactive Publication Date: 2002-09-26
NONLINEAR SEISMIC IMAGING
View PDF4 Cites 34 Cited by
  • Summary
  • Abstract
  • Description
  • Claims
  • Application Information

AI Technical Summary

Benefits of technology

[0030] Integration and interpretation of the results, based on the three sets of data, provide new and valuable information related to the reservoir and potential hydrocarbon accumulations. Data recorded by the downhole receivers, compared to the surface arrays, offer higher resolution. The higher resolution results due to the fact that the summed frequencies that are generated in the nonlinear reservoir rocks are less attenuated due to shorter return propagation distance.
[0053] The main contribution of this invention is to provide two additional set of seismic reflection maps, in addition to the conventional seismic maps that are available today in 2-D and 3-D, that display the reflections in time or in depth, a well known practice universally being applied today. The two additional sets of seismic reflection maps will be provided that will display the elastically nonlinear behavior of the subsurface formations. The nonlinear seismic reflection maps will be generated by seismic reflection processing the data that has been created after cross-correlation of the recorded data with the summed and differenced sweeps. The nonlinear seismic reflection maps will have newly generated frequencies, caused by the interaction of the two predetermined seismic signals as they propagate through elastically nonlinear formations. These nonlinear reflection maps will high light the formations that display nonlinearity due to their porosity, microfracturing and fluid content. The nonlinearity mapping is done in addition to the conventional seismic mapping that results from the cross-correlation of the data with the normal sweep 27.

Problems solved by technology

In spite of all the recent progress in seismic data acquisition and seismic data processing, results are quite often non-unique and ambiguous and fail to identify the higher porosity and fractured zones that contain a major portion of the hydrocarbon reserves.

Method used


Image

  • Mapping reservoir characteristics using earth's nonlinearity as a seismic attribute
  • Mapping reservoir characteristics using earth's nonlinearity as a seismic attribute
  • Mapping reservoir characteristics using earth's nonlinearity as a seismic attribute

Examples


Embodiment Construction

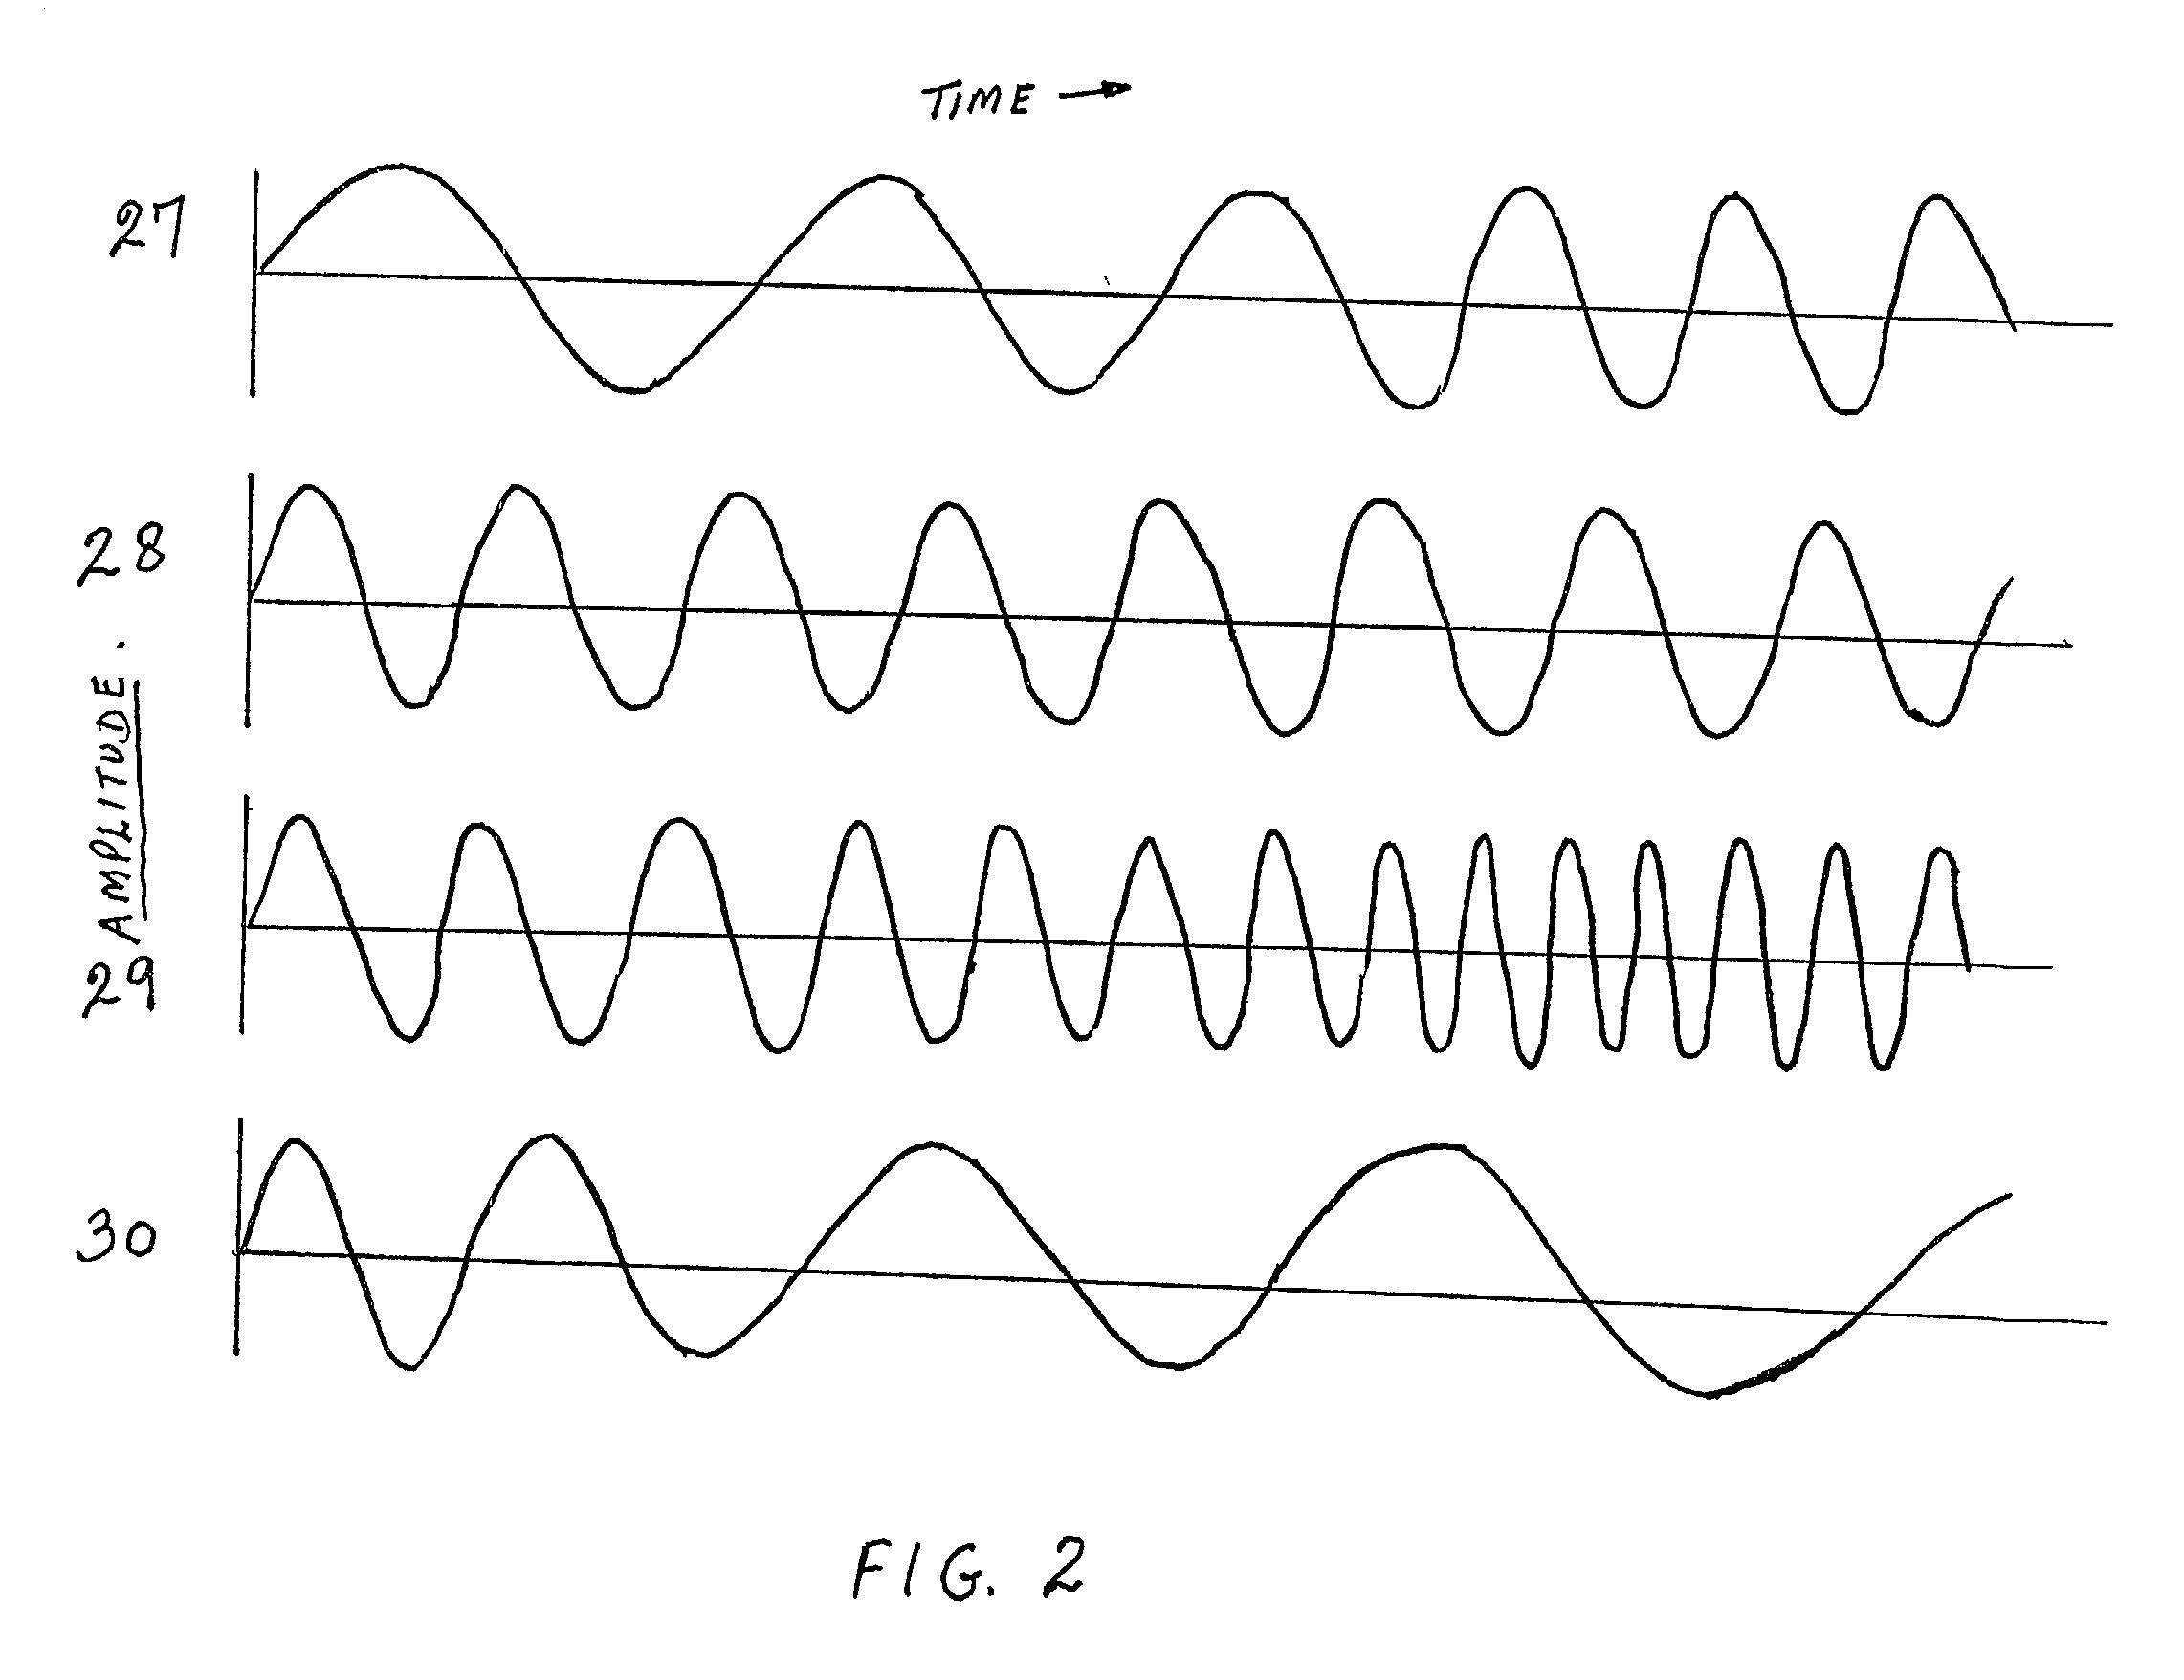
[0056] The vibratory sources currently used in the industry are designed to provide a linear and low distortion output signal. Based on this criterion, the swept frequency signal 27 and the mono-frequency signal 28 can be generated simultaneously by the same vibratory unit. To generate the combined-signal, the amplitude summation of the two signals 27 and 28 is required, which is known in the art. This combined signal is used as a pilot signal, and transmitted into the earth by using a single vibratory unit, thus increasing the operational efficiency of the field operation. During processing, using cross-correlation with 27 and the two sweeps 29 and 30, three sets of data are created as explained earlier in the description. These three sets of data are used for reflection imaging for normal 2-D and 3-D seismic and nonlinear seismic as explained earlier.

[0057] This invention provides us with a new method of recording seismic data from which two separate sets of data are created, one ...


PUM


Abstract

This invention relates to mapping the hydrocarbon reservoir characteristics by mapping the reservoir formations that display dynamic elastic nonlinearity responses to the seismic signals. The main reason of this nonlinear behavior in the reservoir rocks is their bulk rock property: the porosity, fractures, differential pressure and pore saturation. To map these bulk rock properties, the interaction of the two seismic waves as they propagate through elastically nonlinear rocks is recorded. Two compressional seismic signals are transmitted from the surface. Seismic reflection data using surface or borehole detectors are recorded. One of the transmitted signals is a conventional swept frequency and the other is a mono-frequency signal. During the propagation of these two signals through the elastically nonlinear reservoir rocks, there is an interaction between the two signals. The sum and difference frequencies of the two primary seismic signals that were transmitted from the surface are created. These new frequencies constitute an "interaction' wave that travels along with the two primary waves. In this invention, the "interaction' signal created by the two seismic waves as they propagate through the reservoir rocks is separated from the primary signals and used to map the reservoir rocks that exhibit elastic nonlinearity due their bulk rock properties. The cross-correlation of the recorded data with the swept frequency signal provides a conventional seismic data set that is used for normal 2-D or 3-D seismic processing. The cross-correlation of the recorded data with the summed and differenced signals provides two sets of data that represent the seismic reflected image from the subsurface nonlinear formations.

Description

REFERENCES CITED[0001] Johnson, P. A., Rasolofosaon, P. N. J.; Manifestation of Nonlinear Elasticity in Rock: Convincing Evidence Over Large Frequency and Strain Intervals from Laboratory Studies;[0002] Journal: Nonlinear Processes in Geophysics.[0003] Johnson, P. A., Shankland, T. J.; Nonlinear Generation of Elastic Waves in Crystalline Rock;[0004] Journal: Journal of Geophysical Research.[0005] Meegan, G. D., Johnson, P. A.; Observation of Nonlinear Elastic Wave Behaviour in Sandstone;[0006] Journal: Journal Acoustic Society of America.[0007] Johnson, P. A., McCall, K. R.; Observations and Implications of Nonlinear Elastic Wave Response in Rock;[0008] Journal: Geophysical Research letters.[0009] U.S. Patent Documents[0010] 845987 January 2001 Khan 367 / 32.[0011] 1. Field of Invention[0012] The invention is related to mapping the hydrocarbon reservoir formations that display dynamic elastic nonlinearity to the seismic signals, which propagate through them. The main reason for this n...

Claims


Application Information

Patent Timeline
Patent Type & Authority Applications(United States)
IPC IPC(8): G01V1/00G01V1/02
CPCG01V1/005G01V1/006
Inventor KHAN, TAWASSUL A.
Owner NONLINEAR SEISMIC IMAGING
Why Eureka
Try Eureka