

Method and system for analyzing reactions using an information system
a technology of information system and reaction data, applied in the field of nucleic acid amplification reaction data analysis, can solve the problem of non-uniform cycle duration of cyclical amplification reaction
- Summary
- Abstract
- Description
- Claims
- Application Information
AI Technical Summary
Benefits of technology
Problems solved by technology
Method used
Image

Examples
example 1
Captured Data
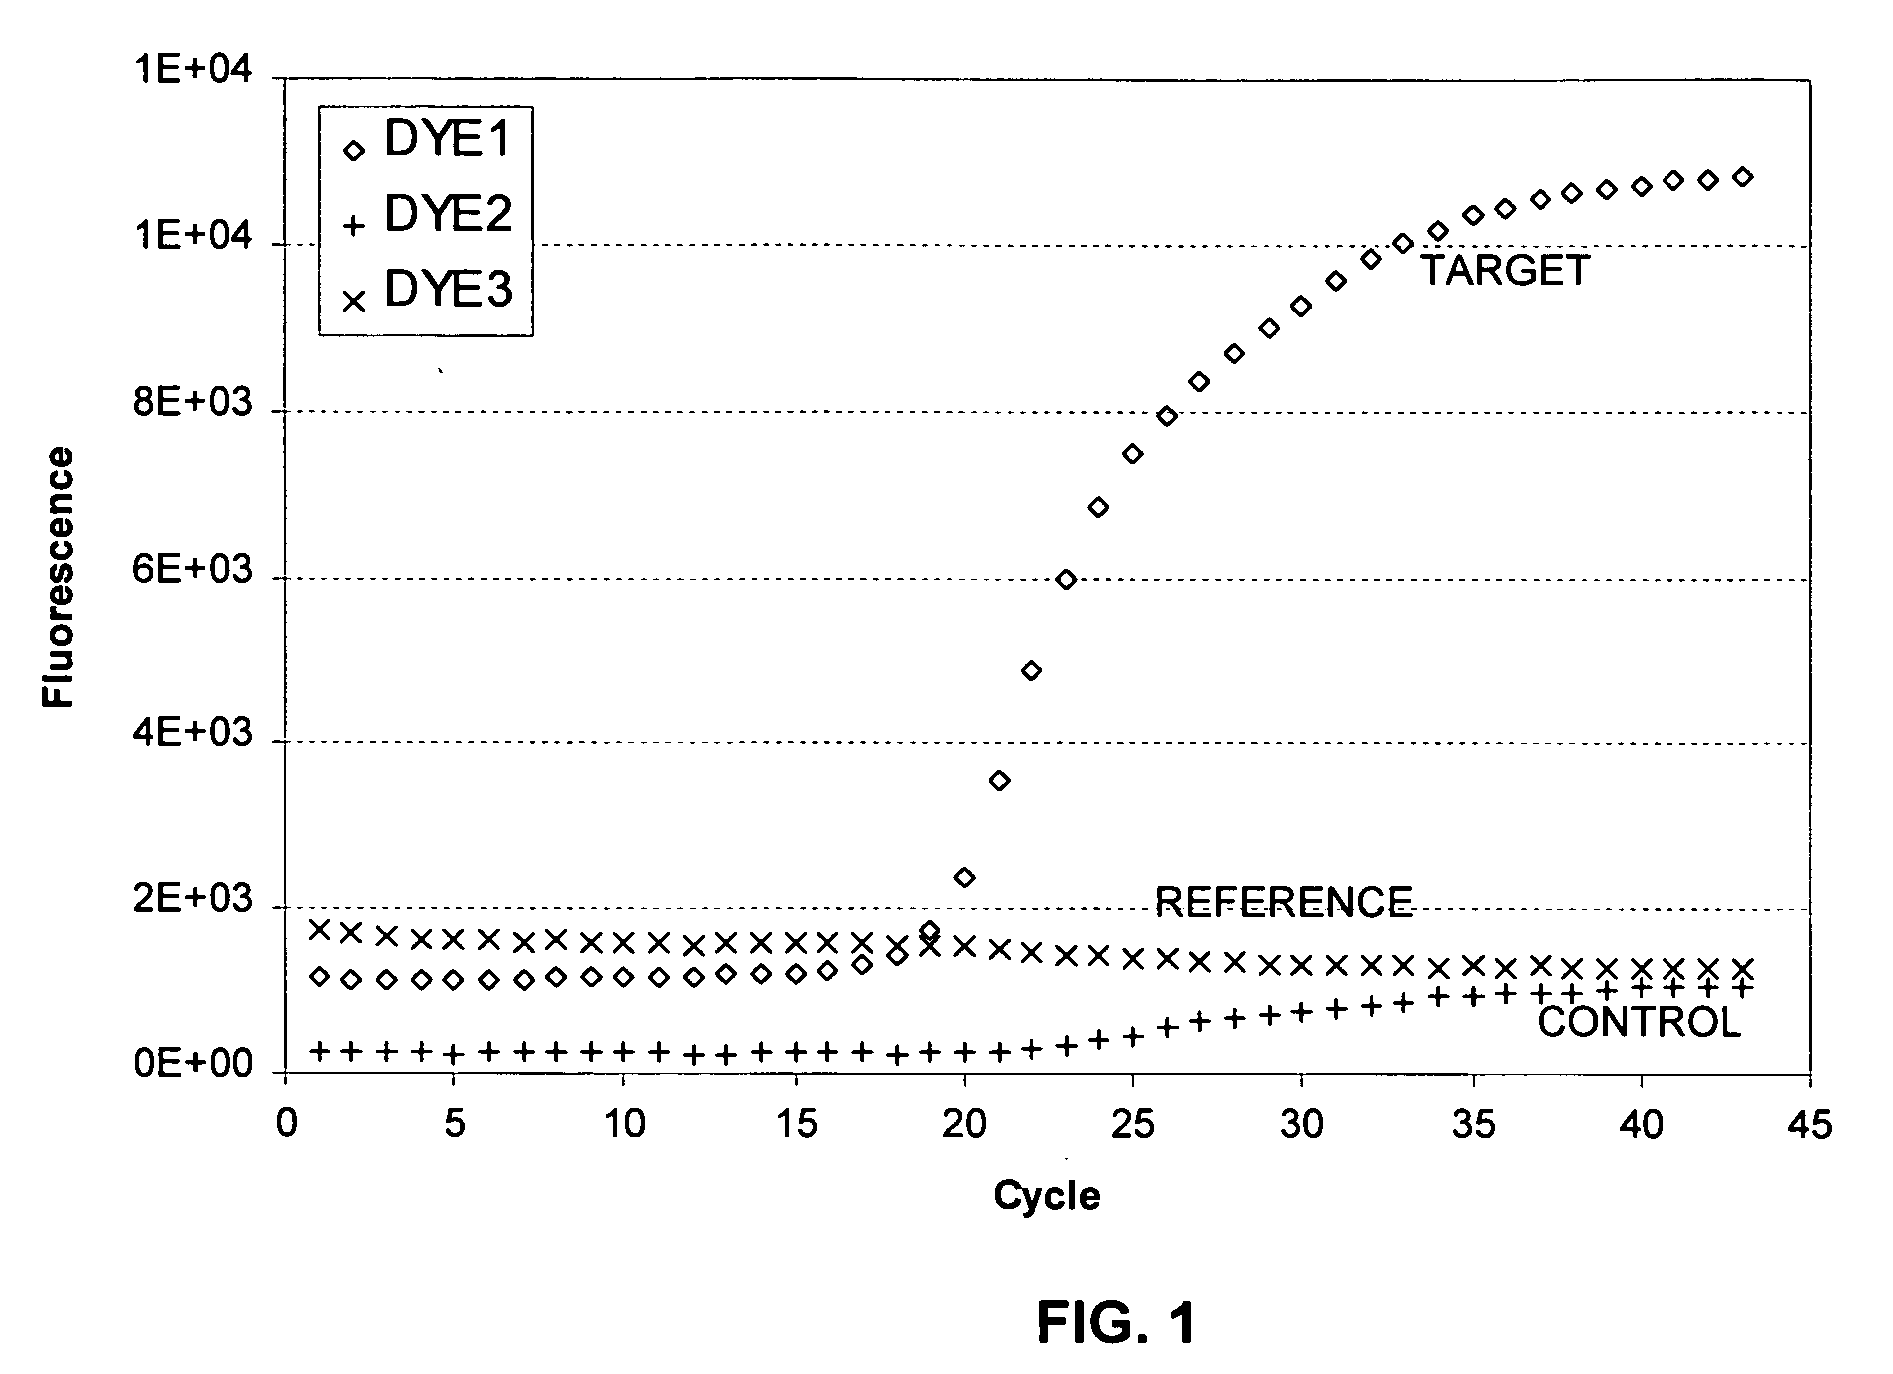
[0101] By way of example, a typical real-time PCR reaction detection system generates a data file that stores the signal generated from one or more detection dyes. FIG. 1 illustrates a plot of captured reaction data that can be used in an analytical method according to the present invention. In this example, one dye signal (DYE1) provides the captured target data, another dye signal (DYE2) provides captured internal control data, and a further dye signal (DYE3) provides optional captured reference data. These data represent data from a single reaction, taken from a standard output file. This particular plot can be understood to represent initial data to which some type of multi-component algorithm has been applied. In this plot, the x-axis provides an indication of cycle number (e.g., 1 to 45) and the y-axis indicates dye intensity detected, in relative fluorescence units. In this figure, the three different capture data sets are illustrated as continuous curves. Howev...
example 2
Normalization
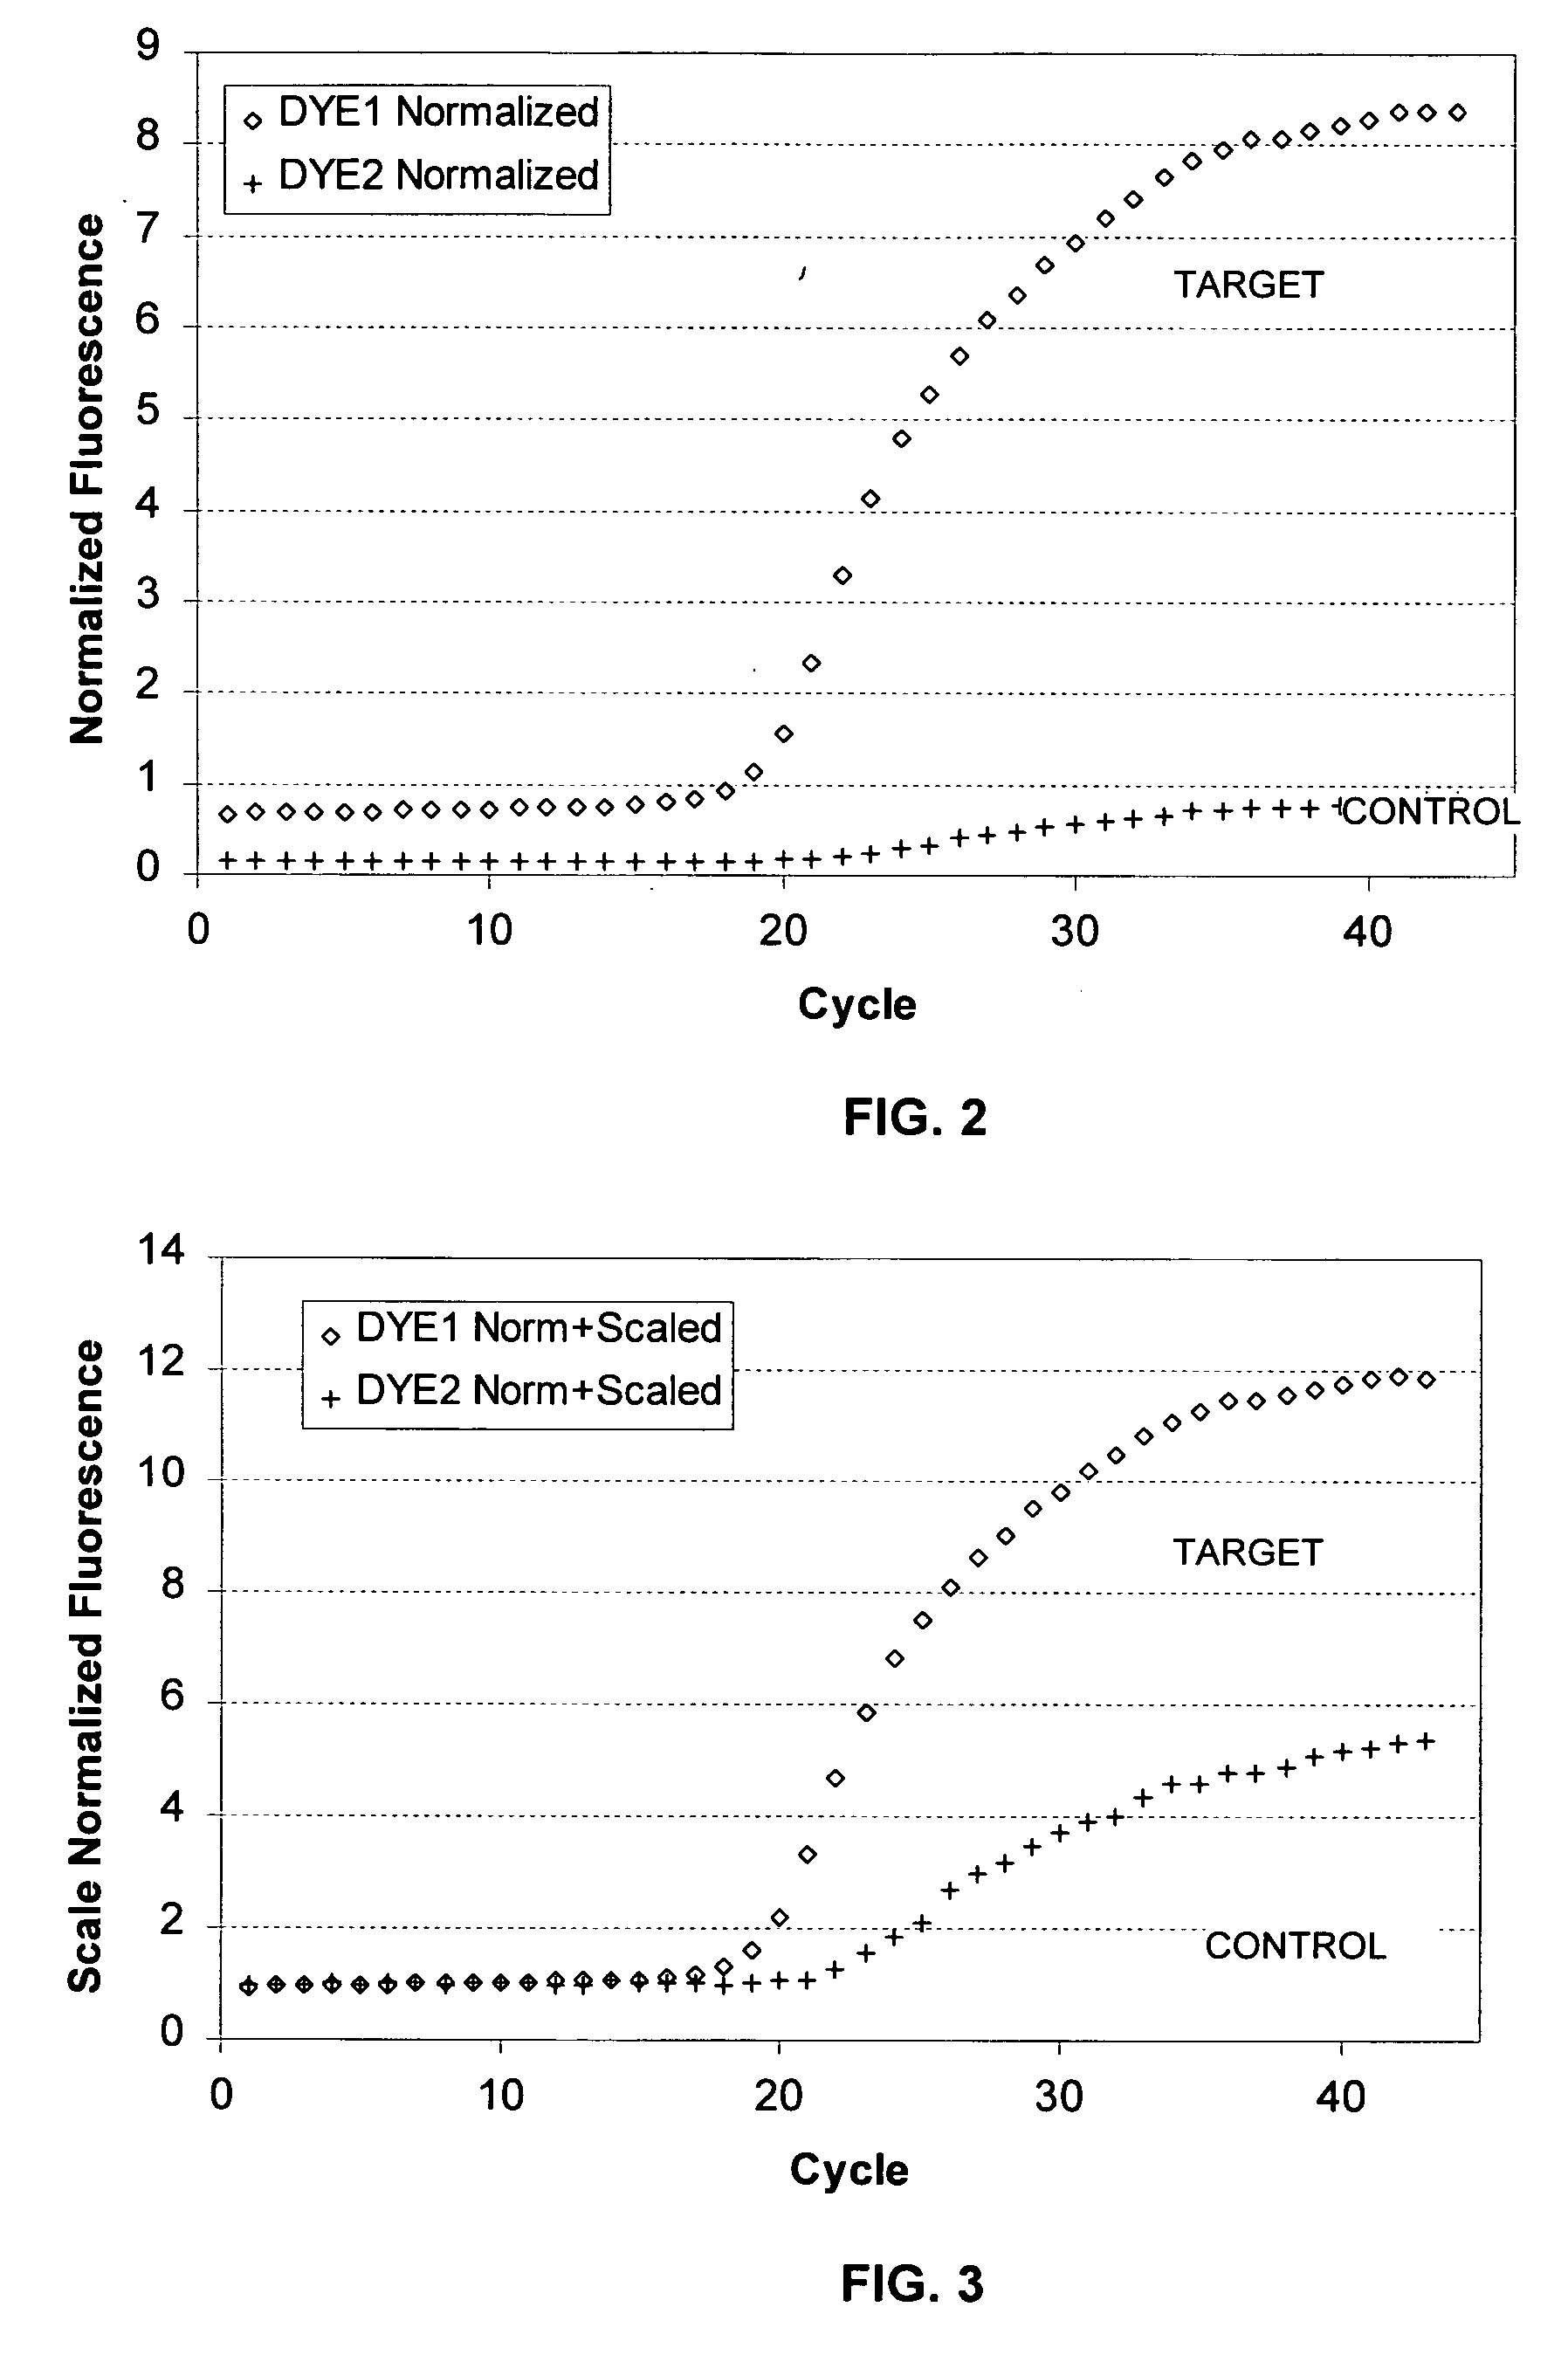
[0102] Although optional, normalization can be performed on the captured data in several different ways. One method involves dividing the target and control values at each cycle reading by the corresponding reference dye signal. Alternatively, the divisor can be the average reference value over all cycles or an average over certain cycles. In another alternative embodiment, the divisor can be the average of the target dye or the control dye or the target dye and the control dye over one or more earlier (baseline) cycles, when no amplification signal is detected. Any known normalization method can be employed in a data analysis. The invention can be used with data that has already been normalized by a PCR system. FIG. 2 is a plot of captured reaction data showing target and control data sets that have been normalized according to the present invention. In this example, as a result of the normalization, the y-axis scale represents a pure number. In this case, the number ...
example 3
Scaling
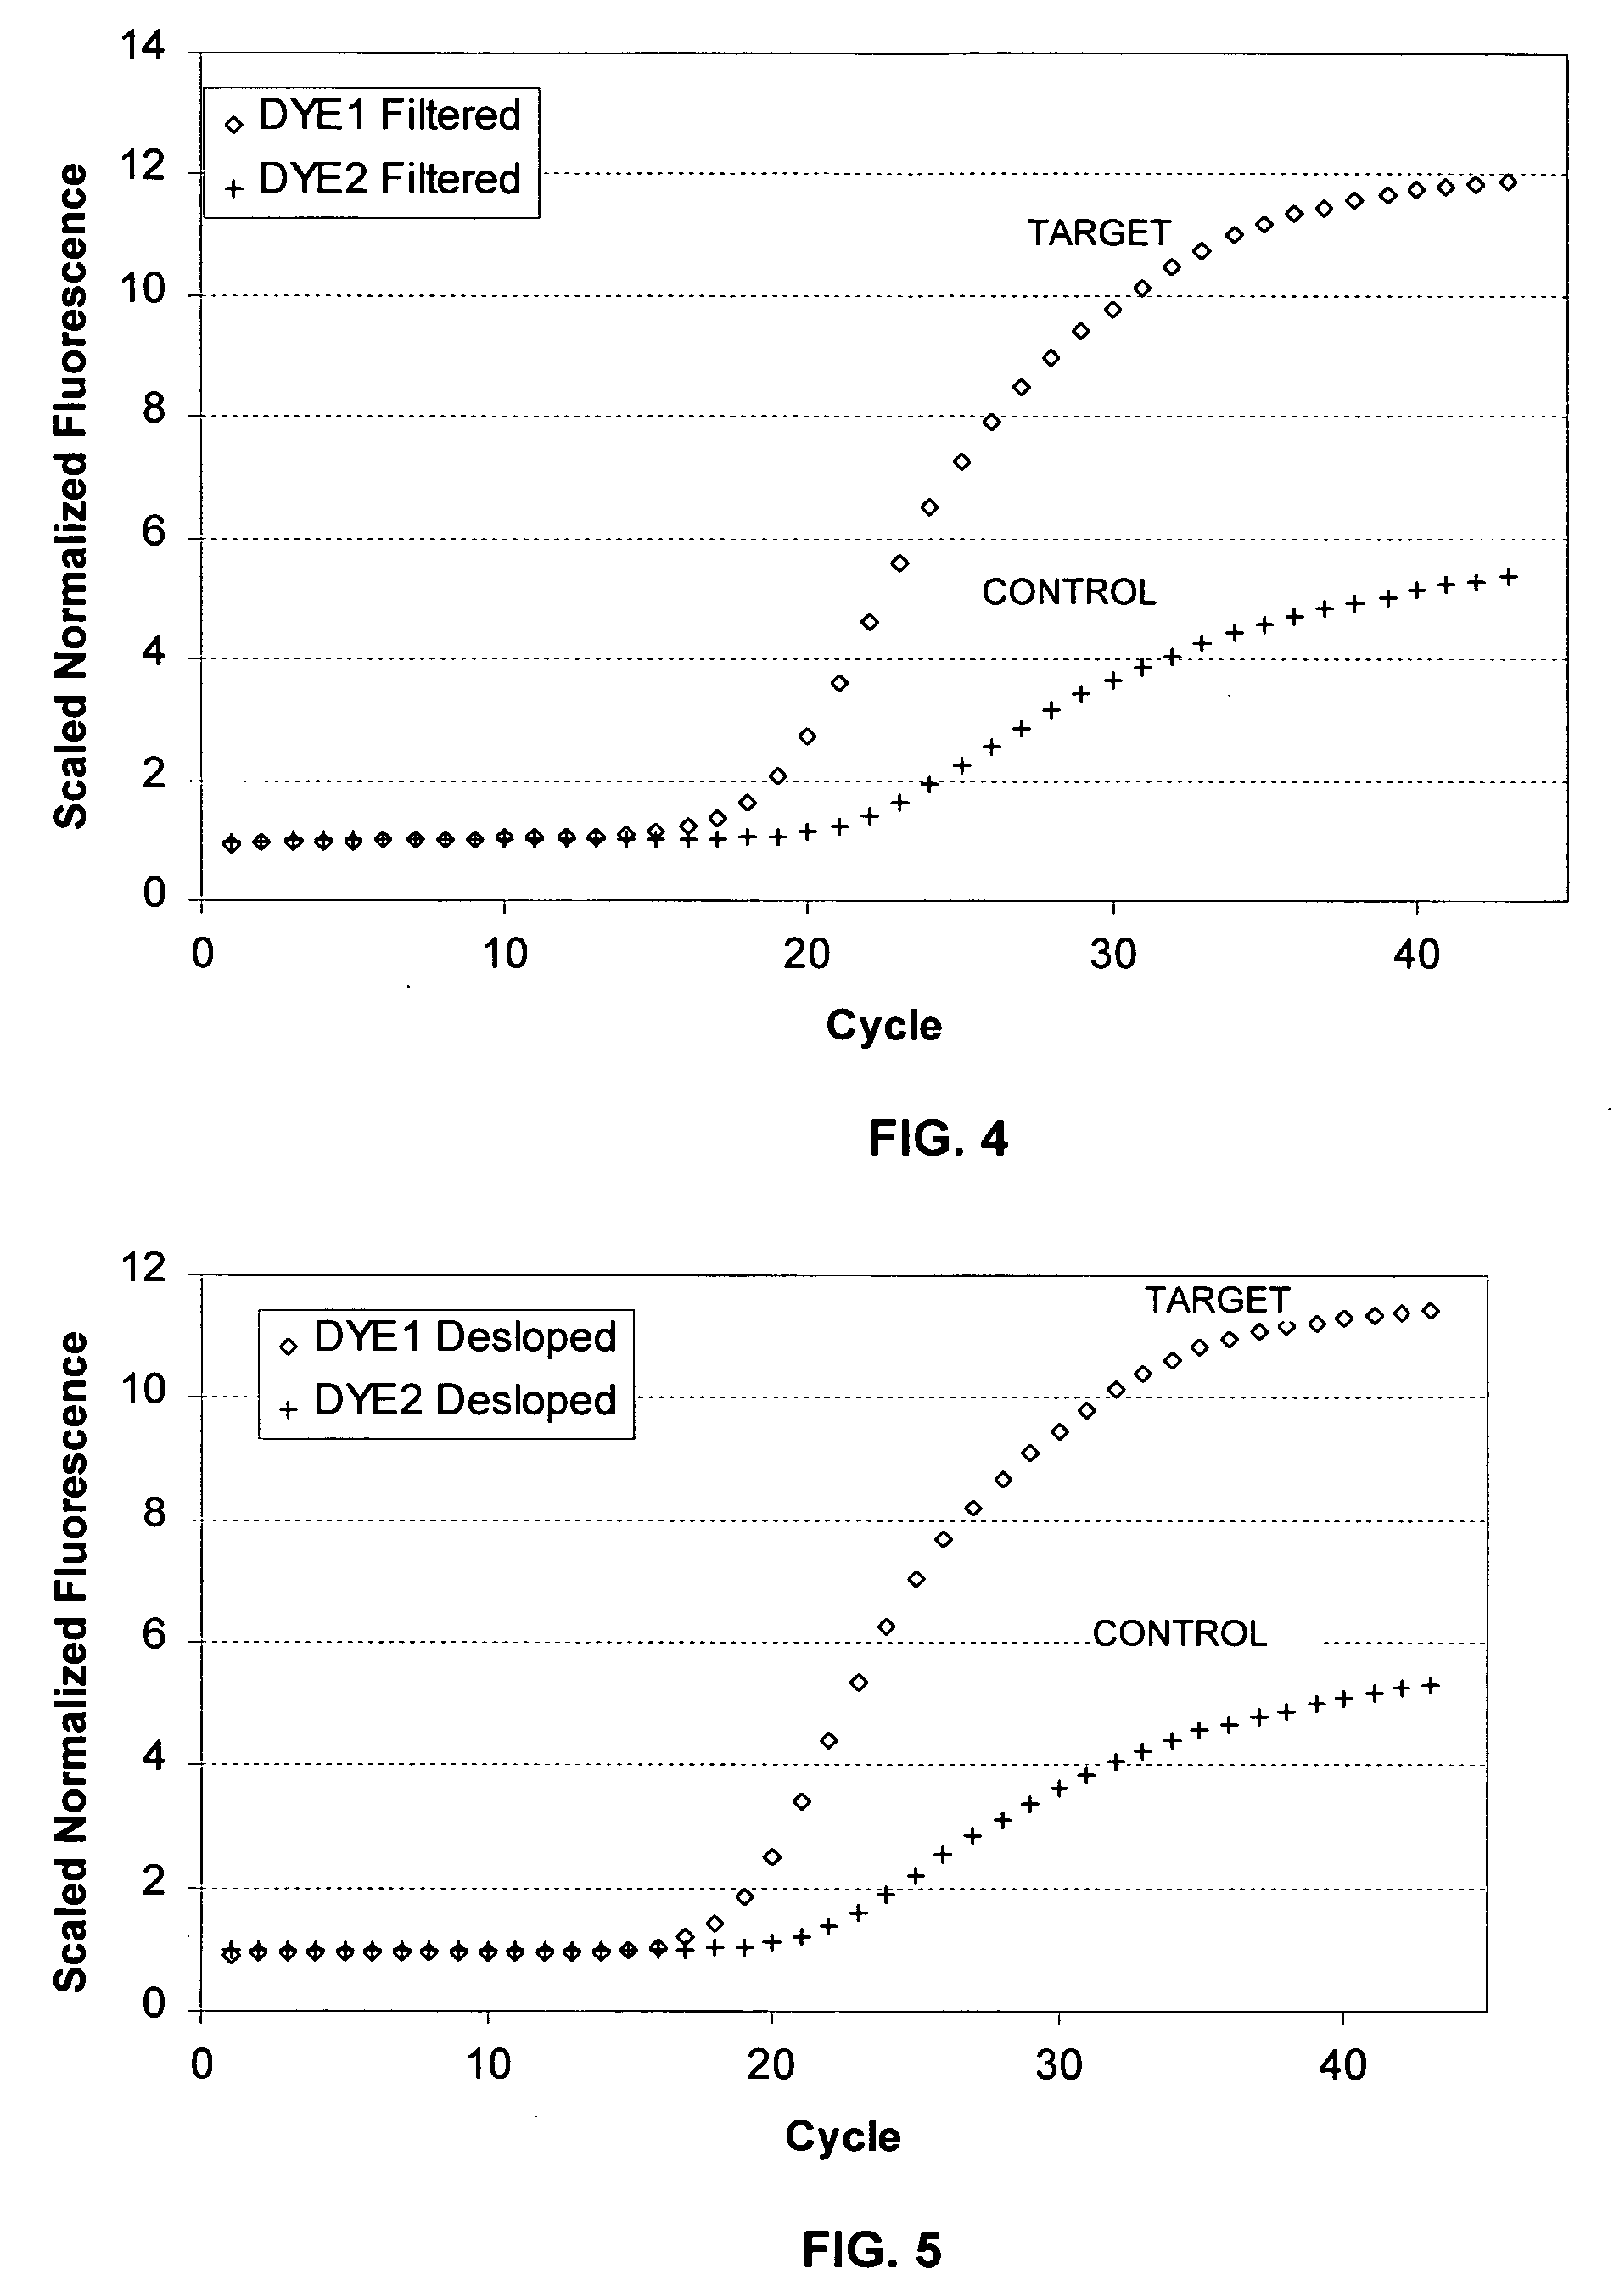
[0104] Scaling is optional but can be performed to make it easier for a human operator to visualize the data. Scaling does not affect analytical results. Scaling can be carried out in addition to normalization, in the absence of normalization, or before or after normalization.
[0105] One method of scaling involves dividing each data set value by the average of the values during some early cycles, generally in the baseline region before any positive data signal is detected. In this example, readings 4 through 8 were averaged and normalization was performed first. FIG. 3 is a plot of reaction data showing target and control data that have been scaled. In this example, scaling forces the early values of the target and control to one, and because the early values are less than one, the division forces the later values to slightly larger pure numbers.
PUM
| Property | Measurement | Unit |
|---|---|---|
| Time | aaaaa | aaaaa |
| Ratio | aaaaa | aaaaa |
| Width | aaaaa | aaaaa |
Abstract
Description
Claims
Application Information