Artificial intelligence and global normalization methods for genotyping
a global normalization and genotyping technology, applied in the field of artificial intelligence and global normalization methods for genotyping, can solve the problems of skewing the results of genotyping analysis, deteriorating the quality of data, and rarely feasible manual data analysis
- Summary
- Abstract
- Description
- Claims
- Application Information
AI Technical Summary
Benefits of technology
Problems solved by technology
Method used
Image
Examples
example i
Normalizing Genotyping Data
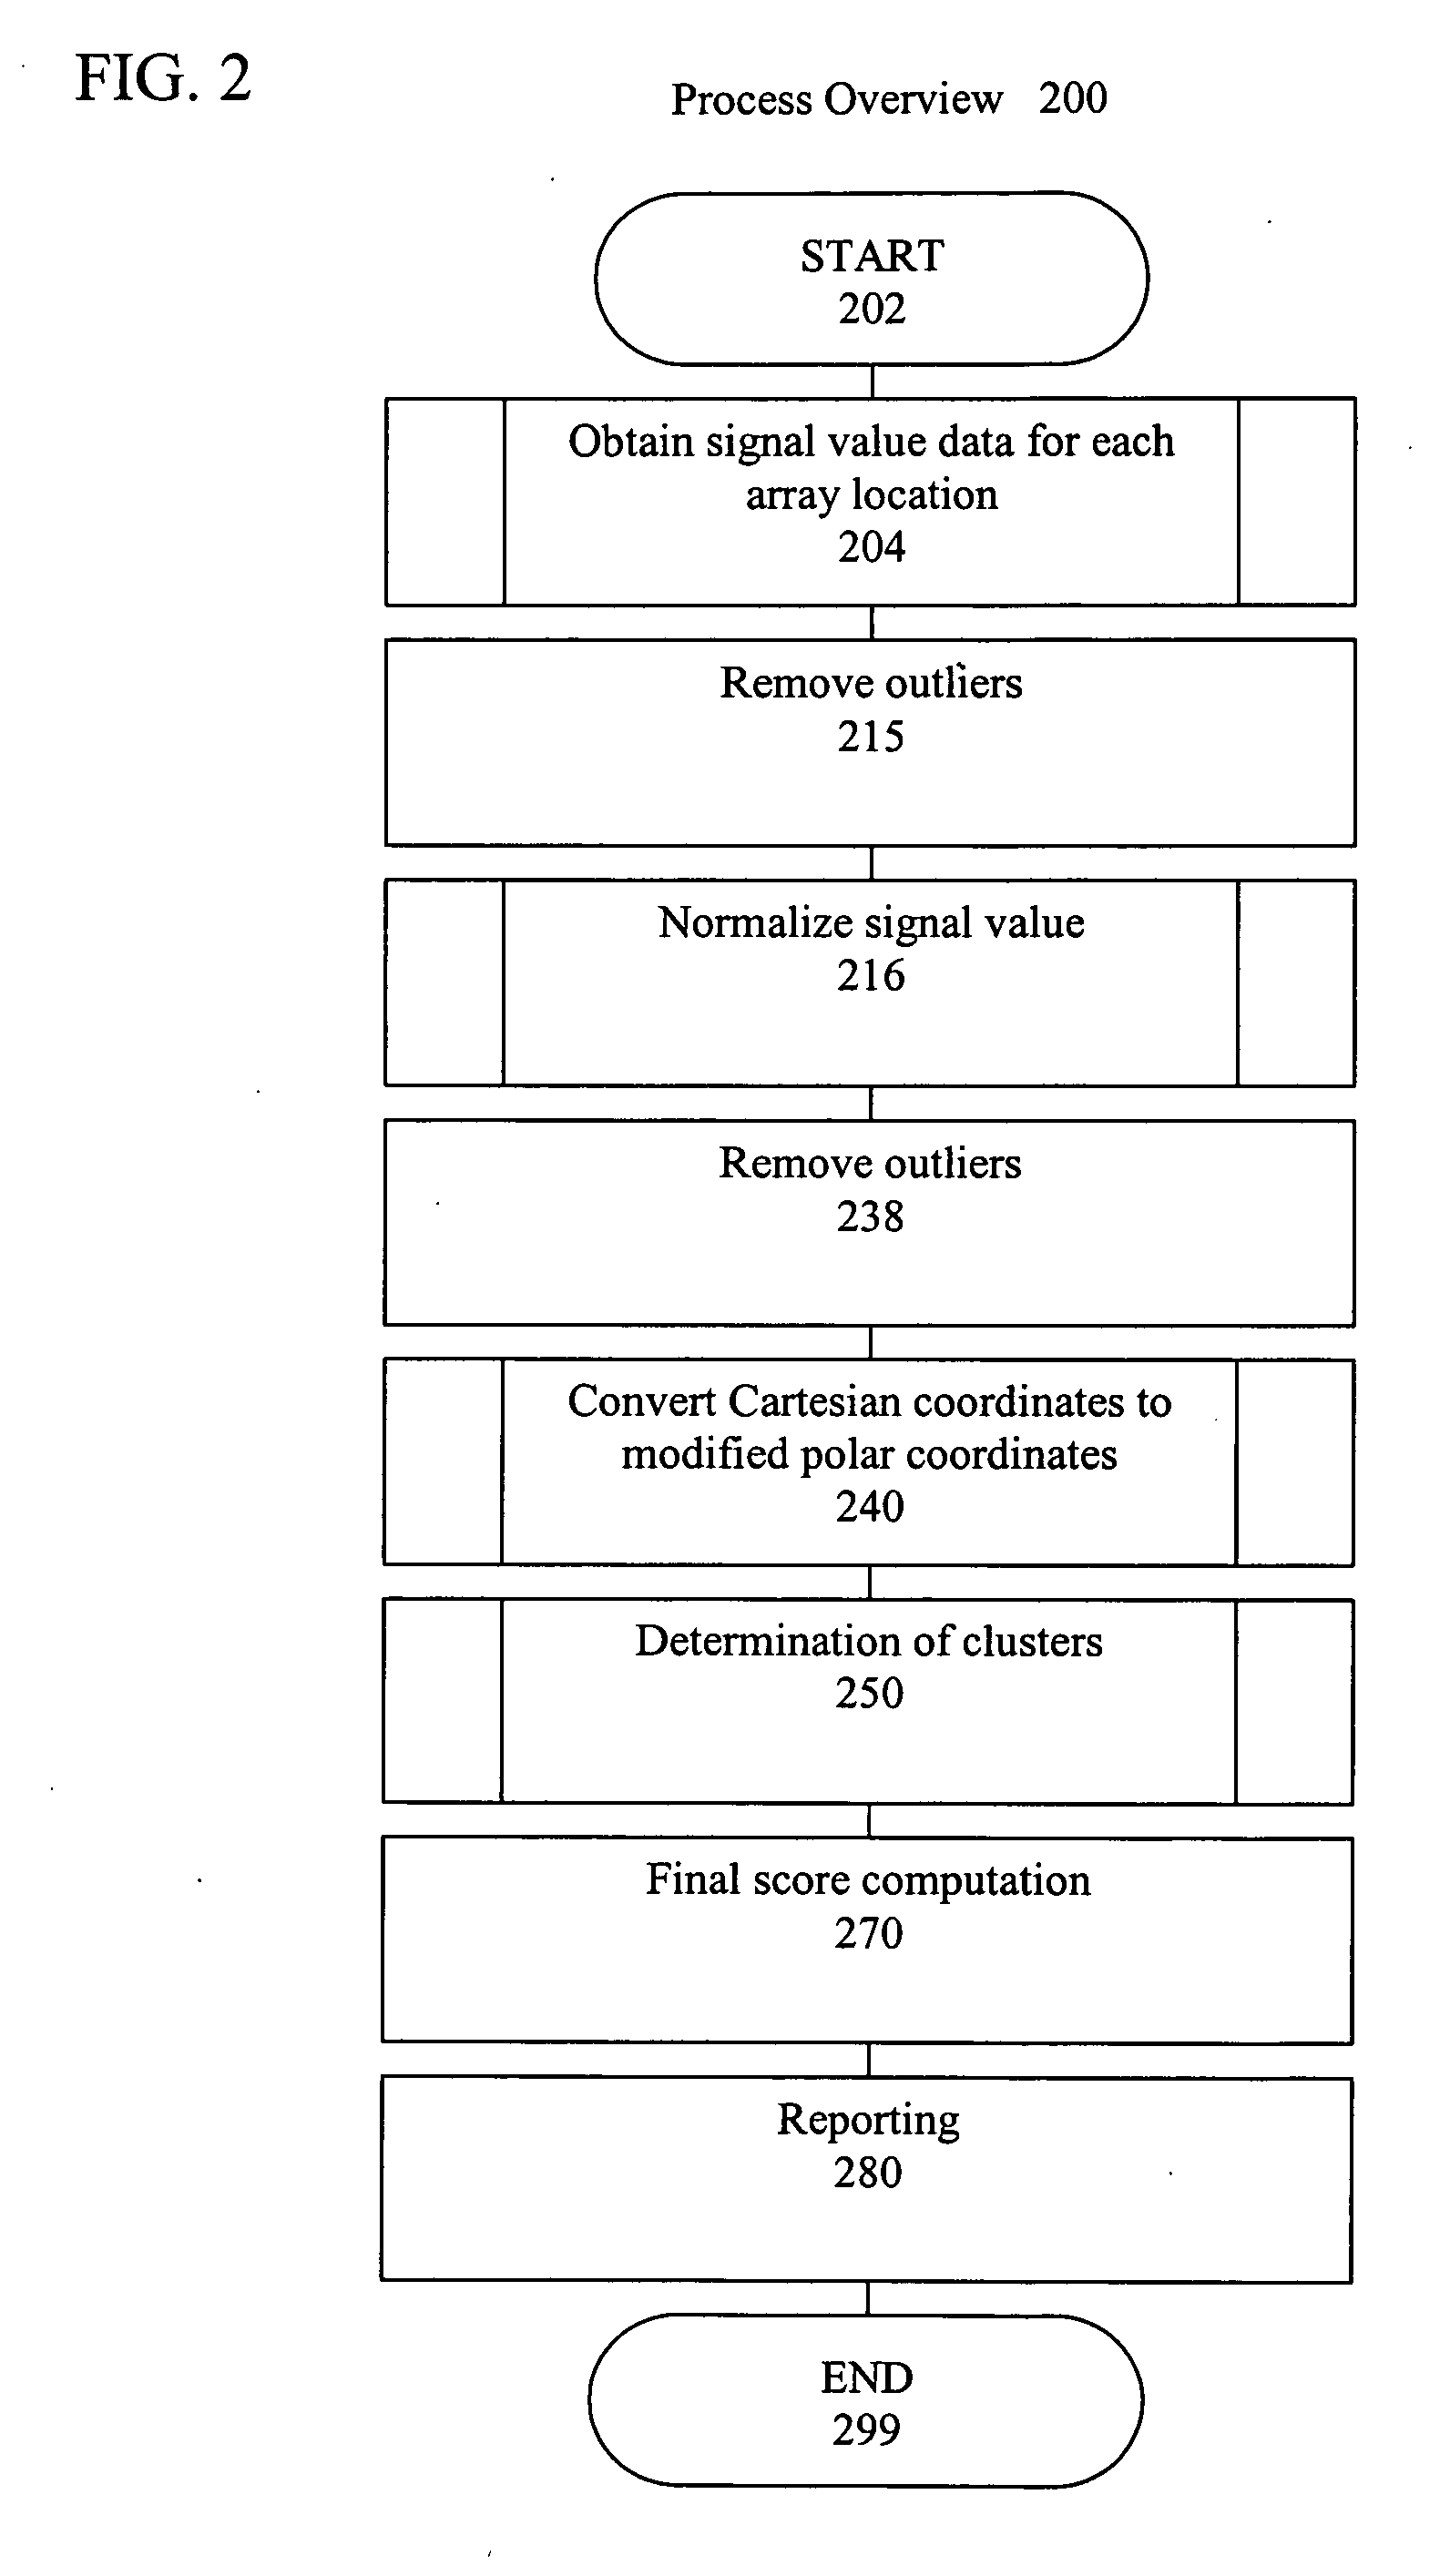
[0134] This example demonstrates a method for normalizing genotyping data using a transformation equation that includes a translation operation, rotation operation, shear operation and scale operation.
[0135]FIG. 10A shows a plot of signal value scatter points typical of a GoldenGate™ based genotyping assay. The x axis of the plot represents intensity of signals from probes for A alleles and the y axis represents intensities of signals from probes for B alleles. Each point is plotted according to intensity of signals for an A allele and B allele measured at a particular array location.
[0136] In a first step outliers were identified and removed based on statistics on intensity. In particular, sum of intensities of the points that fell into the lower quartile were removed. Outliers were also removed based on missing values. After outlier removal, the signal value scatter points were translated as follows. An X-sweep was carried out such that sweep points s...
example ii
Clustering Genotyping Data
[0141] This example demonstrates a method for clustering genotyping data into one or more groups.
[0142] If the data is to be grouped into one cluster, all the points are associated to that one cluster.
[0143] For the case of two clusters, genotyping data is plotted in polar coordinates. The following steps are carried out in the Theta dimension. A moving cut-off point is tested at predefined intervals. At each cut-off point, the points to the left of the cut-off are assigned as one cluster, and the points to the right are assigned to the other cluster. Statistics of the two clusters are extracted. Two energy functions are computed. The first one is the negative log likelihood of the data to the model. The second one is the sum of standard deviations of the present data clusters. The two energy functions are combined into a single energy function. After evaluating all the possible cut-offs from among the tested moving cut-off points, the cut-off that rende...
PUM
| Property | Measurement | Unit |
|---|---|---|
| angle | aaaaa | aaaaa |
| angle | aaaaa | aaaaa |
| angle | aaaaa | aaaaa |
Abstract
Description
Claims
Application Information
 - R&D
- Intellectual Property
- Life Sciences
- Materials
- Tech Scout
- Unparalleled Data Quality
- Higher Quality Content
- 60% Fewer Hallucinations
Browse by: Latest US Patents, China's latest patents, Technical Efficacy Thesaurus, Application Domain, Technology Topic, Popular Technical Reports.
© 2025 PatSnap. All rights reserved.Legal|Privacy policy|Modern Slavery Act Transparency Statement|Sitemap|About US| Contact US: help@patsnap.com


