Method and apparatus for automatically segmenting a microarray image

a microarray image and automatic segmentation technology, applied in the field of microarrays, can solve the problems of small variations, scan mechanism location accuracy errors in the scanner, and the number grid rarely aligns well with the underlying scanned microarray image, and achieves the effect of accurately reducing the sum significantly, and segmenting the microarray image quickly

Inactive Publication Date: 2005-11-03
PERKINELMER HEALTH SCIENCES INC
View PDF6 Cites 16 Cited by
  • Summary
  • Abstract
  • Description
  • Claims
  • Application Information

AI Technical Summary

Benefits of technology

[0026] To determine if the grid image aligns with the sub-array image in, for example, the horizontal direction, the method produces the total column score at each step of the window by calculating dummy column scores and subtracting a weighted version of the dummy scores from the sum of the column scores for the columns that correspond to the grid. If the grid image is aligned with the sub-array image, subtracting the dummy column scores does not reduce the sum significantly. Otherwise, subtracting the dummy scores reduces the sum, and thus, the total score by a relatively large amount. The system then selects the window position that corresponds to the maximum total column score, and by doing so correctly selects the window position in which the locations of the dummy columns correspond to the locations of the sub-array gaps, that is, the position in which the grid and sub-array images are correctly aligned. The selected window position also sets the locations of the grid columns with respect to the columns in the underlying sub-array image. The same method steps are repeated to determine the locations of the upper and lower sub-array image gaps and the grid rows.
[0027] As also discussed in more detail below, the system may rotate the nominal grid image relative to the pixel matrix of the sub-array image, to search through a rotated position. In this way, the system determines if the underlying sub-array image is rotated due to, for example, a misalignment of the microarray substrate in the microarray spotter or scanner. The system calculates total row and total column scores in the manner discussed above for each rotation position, and selects the rotation position that corresponds to the highest total row and total column scores. The system thus readily determines the locations and rotational position, or orientation, of the grid image rows and columns, such that the system can accurately segment tilted sub-array images.
[0028] In contrast to known prior method and systems for segmenting microarray images, the current method and system segments the microarray image quickly by using iterative calculations that are not particularly computationally intensive while at the same time producing results that are accurate even with multi-spot, multi-column artifacts. Further, the current method and system perform in this manner even if corner spots in the sub-array are dim or missing. The iterative calculations are performed on relatively small amounts of data, namely, the image row, column and gap projections, and thus, changes in position between iterations can be small, without slowing down the process. In this way, locations that vary by fractions of a spot diameter or are tilted slightly can be rapidly searched.

Problems solved by technology

In practice, a nominal grid rarely aligns well with the underlying scanned microarray image due to the combined effects of various tolerances in the spotting instrument.
These include variations in the locations of the pin tips in the spotter's print head, misalignment of the print head with the spotter's x / y motion axes, non-orthogonality of the spotter's motion axes, spotter robot motion accuracy errors, and microarray substrate location errors in the spotter.
There also may be scanning mechanism location accuracy errors in the scanner which scans the microarray image during the segmentation process.
Some of these errors are systematic in that they are repeatable for every microarray printed by a particular spotter, some errors are repeatable within a batch of printed arrays and some errors are random.
A random spot location error may be caused by random variations in the motion of the print head in a given spotter which may cause small variations in the locations of individual spots within each block of the microarray.
However, manual manipulation of individual markers or rows or columns of such markers within the grid association with a given microarray to locate the spots is a tedious and time consuming task, bearing in mind that a is typical microarray may contain thousands of spots.
Such automating of the spot location process eliminates the painstaking labor involved in the manual methods described above, but the algorithms that are available to do so can produce erroneous results, especially for dim or noisy microarray images, See Marzolf et al., Validation of Microarray Image Analysis Accuracy, Bio Techniques 36:304-308, February 2004.
Such automatic spot location techniques are also more likely to fail with increased location errors between the nominal grid markers and the actual spot locations in the microarray image.
In any event, spot location errors, if not corrected before quantitation, can lead to mis-identified spots (analytes) in the analysis of the array or incorrect quantitation results for some spots.
Because of these frequent spot location errors with automatic spot location apparatus, manual inspection and correction of the automatic spot location results must often be performed thereby undoing some of the labor saving steps intended through the use of such automatic spot location methods.
Even if the automatic methods produce good results, the automatic methods are generally computationally intensive, and thus, time consuming.
While this method is not particularly computationally intensive, the method fails when multi-spot artifacts that span multiple rows or columns are encountered.
The Ugolin method is, however, very computationally intensive, and thus slow.

Method used


Image

  • Method and apparatus for automatically segmenting a microarray image
  • Method and apparatus for automatically segmenting a microarray image
  • Method and apparatus for automatically segmenting a microarray image

Examples


Embodiment Construction

[0043] The present invention may be implemented as program instructions for configuring a microarray image analysis or quantitation workstation such as the one shown at 10 in FIG. 14. As shown there, workstation 10 may include a central processing unit (CPU) 12 which operates on program instructions in a memory 14 using a processor in CPU 12. A scanner 16 scans microarrays to obtain corresponding image data which may be stored in an image storage device 18 connected to CPU 12. A user may input instructions concerning the microarray image analysis by way of a keyboard 20 or a mouse 22 connected to CPU 12 and images and other data may be displayed on a monitor 23. Also, the workstation usually includes a printer 24 for printing images and data. Image data representing the nominal grid may be loaded into the workstation via a disk drive 26 and stored in memory 14 along with the program instructions for implementing the present invention.

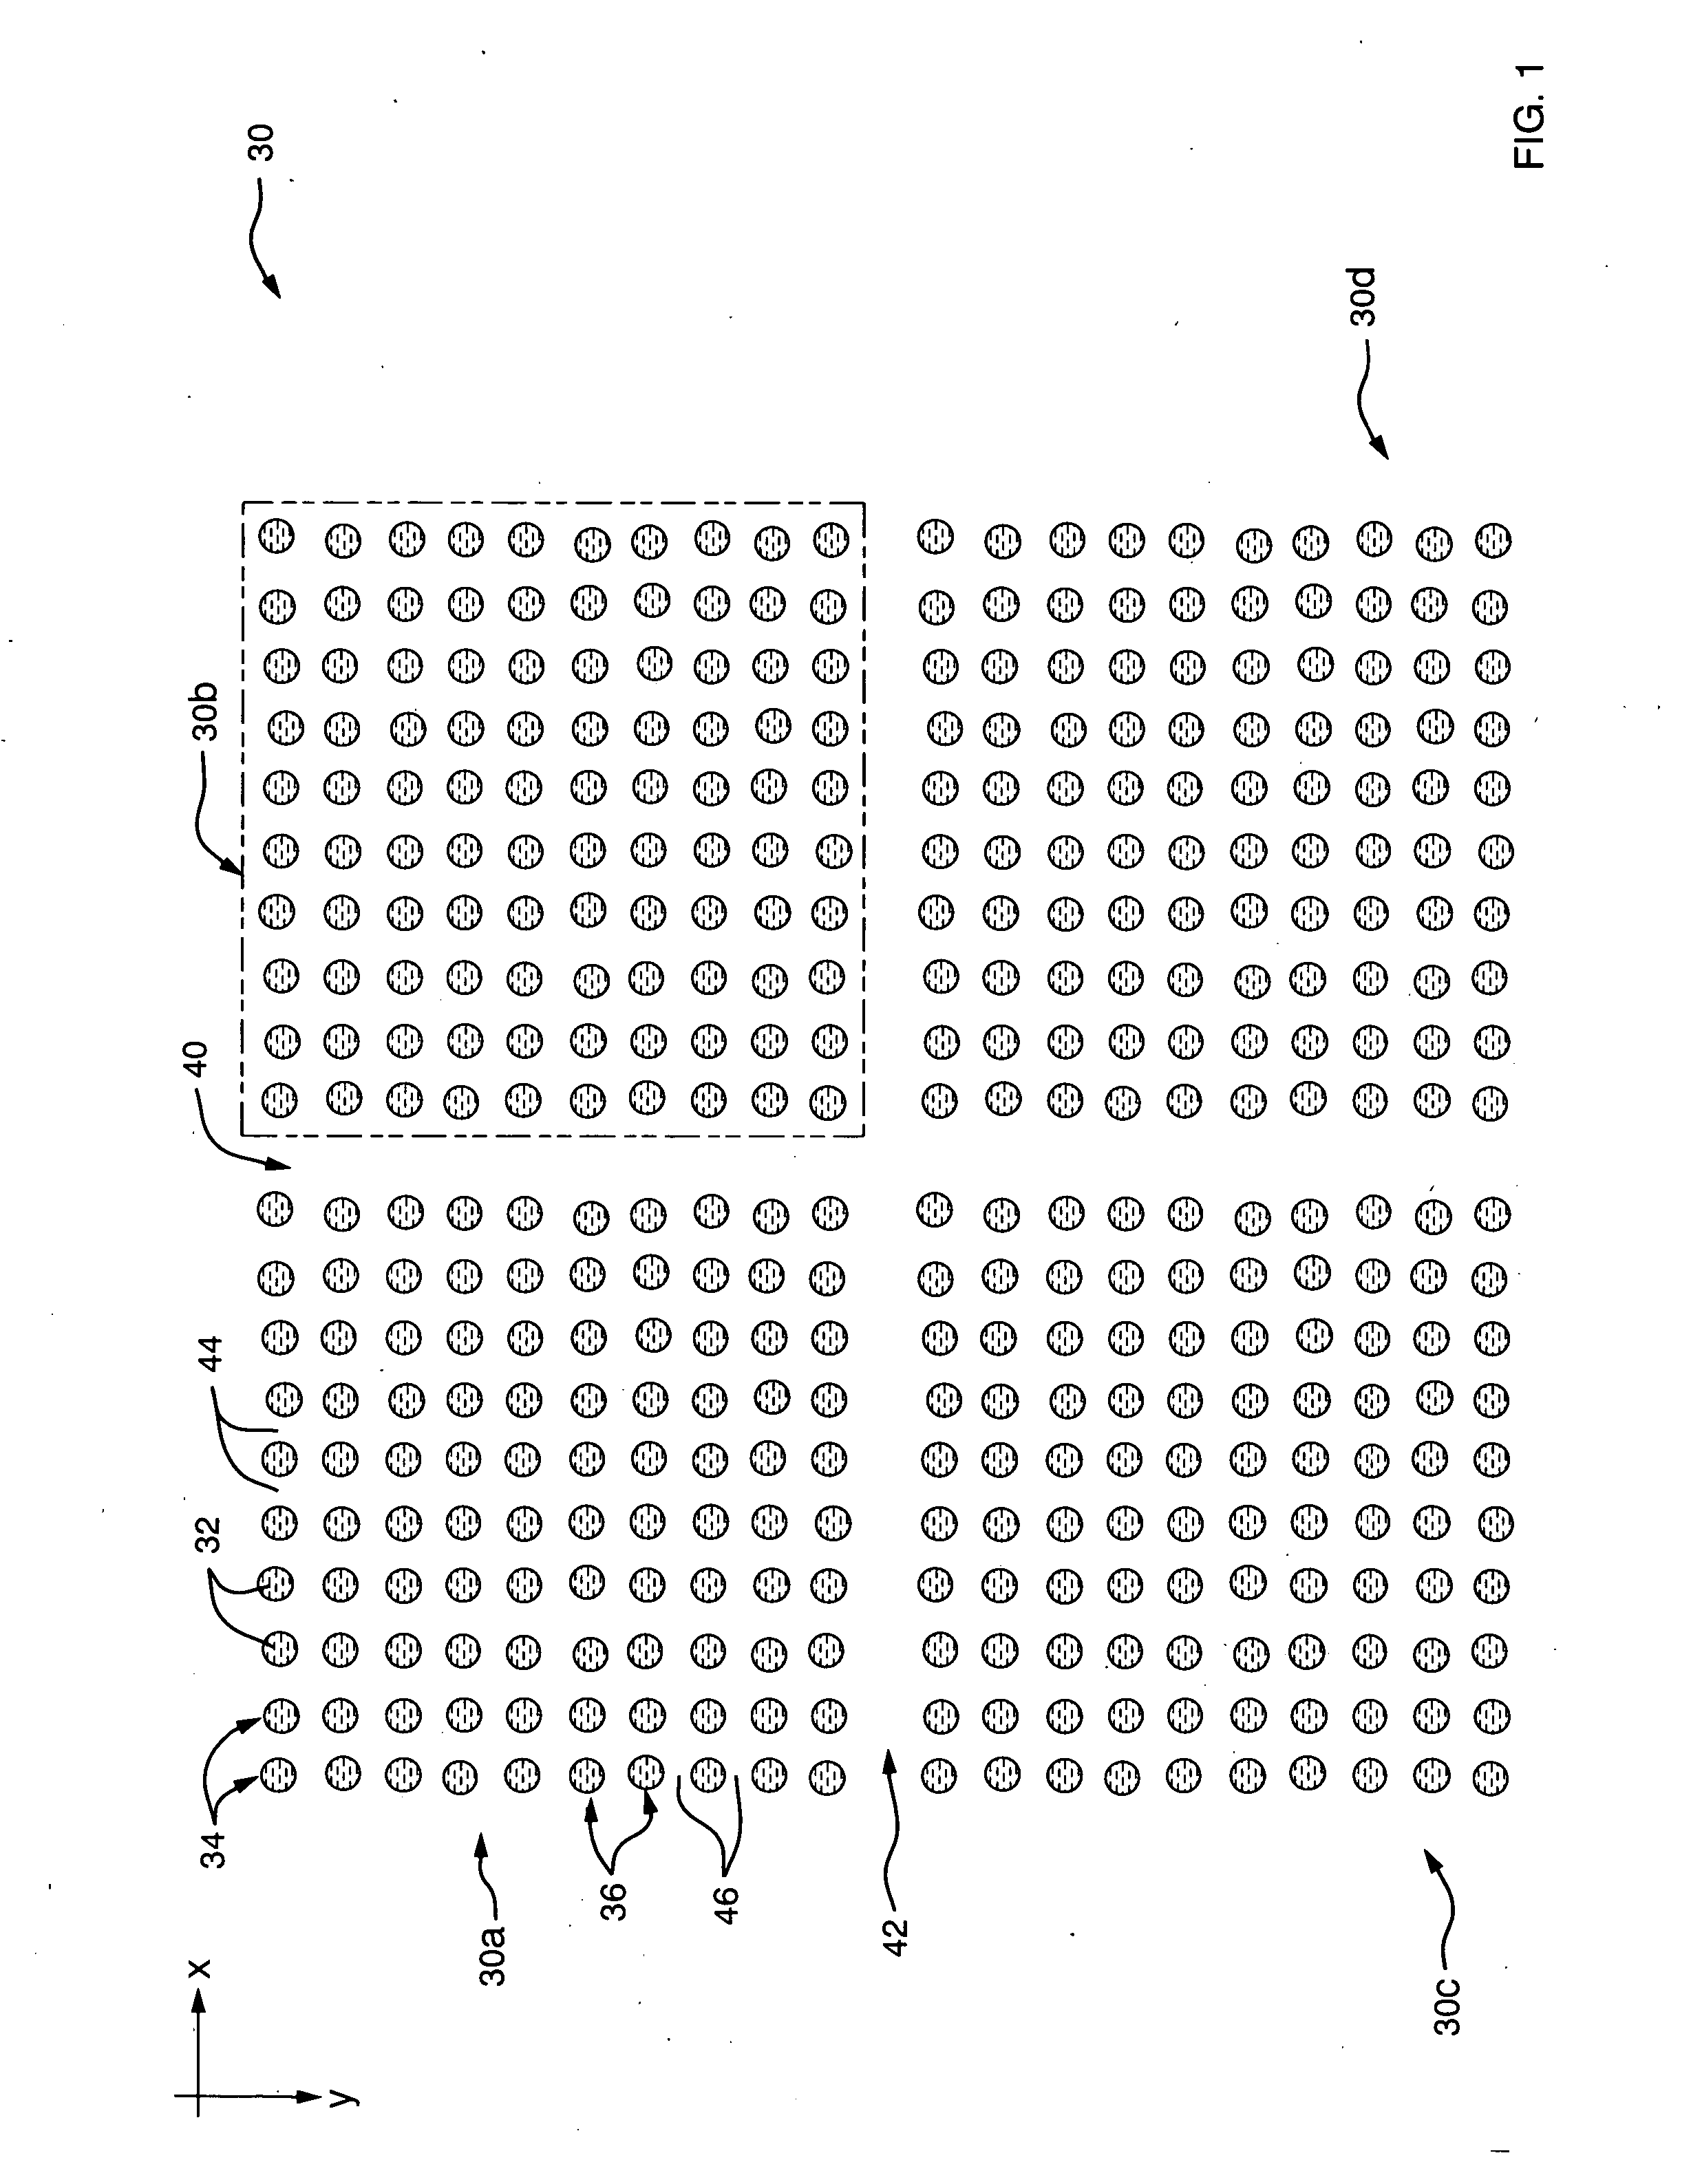
[0044] Refer now to FIG. 1 which illustrates an ...


PUM


Abstract

A microarray image is segmented into discreet segments for respective spots in the microarray image based on locating microarray image rows and columns by maximizing scores associated with vertical and horizontal image projections. To determine the locations of the rows and columns that extend through artifacts that involve multiple spots and/or multiple columns and rows, the scores may also include contributions from the gaps between adjacent rows and columns. The scores are calculated by stepping windows containing nominally spaced spot-sized row or column boundaries, over the horizontal projection curves. At each step a total row or column score is calculated that represents the areas of the projection curves that fall within the row boundaries. The system then selects the window positions that correspond to the maximum total row score and total column score, and uses the locations of the boundaries as the locations of row and column “stripes” that are sized to the spot diameters. The intersections of the row and column stripes define the segments for the respective spots, and the centers of the intersections are the locations for the spot location, or grid, markers. The system may also determine the best spot size, column and row gap sizes and sub-array gap sizes by changing the boundaries accordingly and determining corresponding maximum scores.

Description

CROSS-REFERENCE TO RELATED APPLICATION [0001] The present application claims the benefit of U.S. Provisional Application Ser. No. 60 / 521475, filed on May 3, 2004, which is hereby incorporated by reference herein.BACKGROUND OF THE INVENTION [0002] This invention relates to microarrays. It relates more particularly to a method and apparatus for locating spots in a microarray image, also referred to as image segmentation. [0003] A microarray is an array of very small samples of chemical or biochemical material drawn from reservoirs by a spotting instrument or spotter and deposited as a grid of many such spots on a solid substrate such as a glass microscope slide. When the microarray is exposed to selected probe material including a label molecule such as a fluorophore, the probe material selectively binds to the target sites only where complimentary binding spots are present through a process called hybridization thereby providing an assay. The microarray may then be scanned by a flore...

Claims


Application Information

Patent Timeline
Patent Type & Authority Applications(United States)
IPC IPC(8): G06T7/00G06V10/25
CPCG06K9/3216G06T2207/30072G06T7/004G06K9/3233G06T7/70G06V10/245G06V10/25
Inventor LI, XINGYUANGEHRIG, JAY S.
Owner PERKINELMER HEALTH SCIENCES INC
Why Eureka
Try Eureka