Method of debugging code and software debugging tool

a debugging tool and code technology, applied in the field of debugging code and software debugging tools, can solve the problems of inapplicability of conventional schemes and extremely slow relative to the actual execution of instructions, and achieve the effect of high discovery

Inactive Publication Date: 2005-11-10
RAYTHEON CO
View PDF4 Cites 39 Cited by
  • Summary
  • Abstract
  • Description
  • Claims
  • Application Information

AI Technical Summary

Benefits of technology

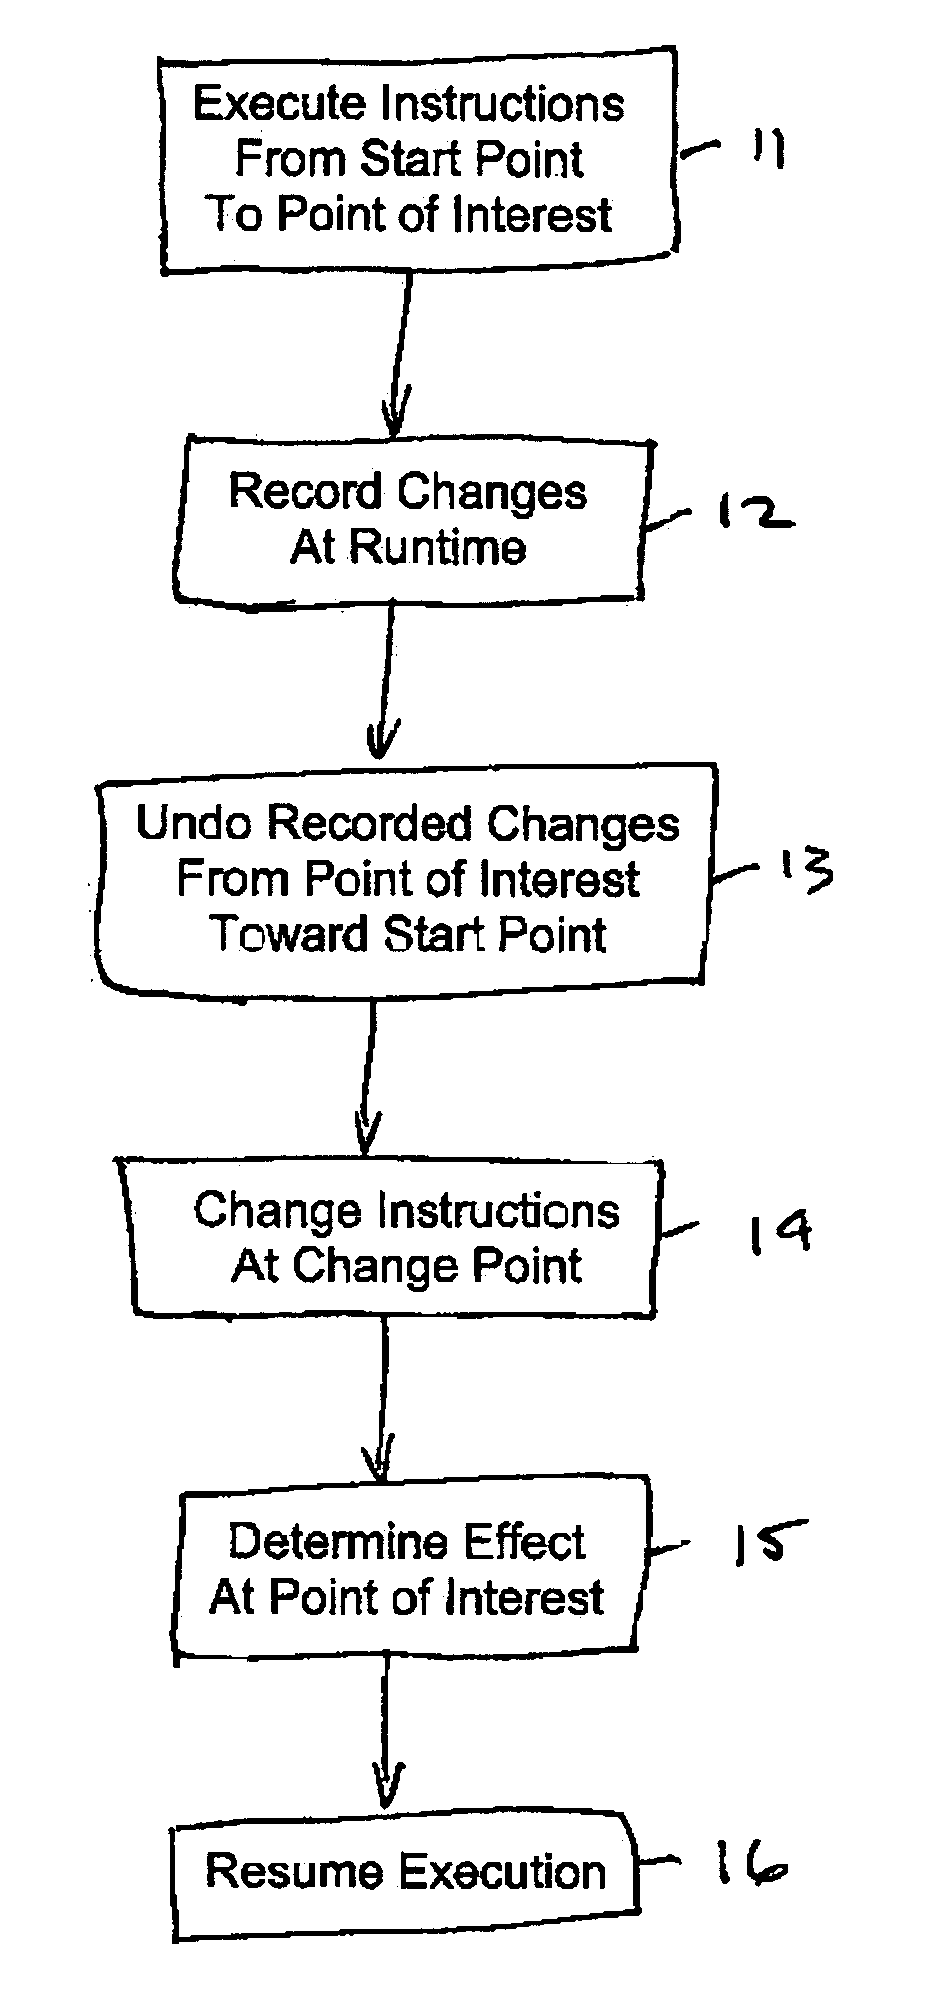
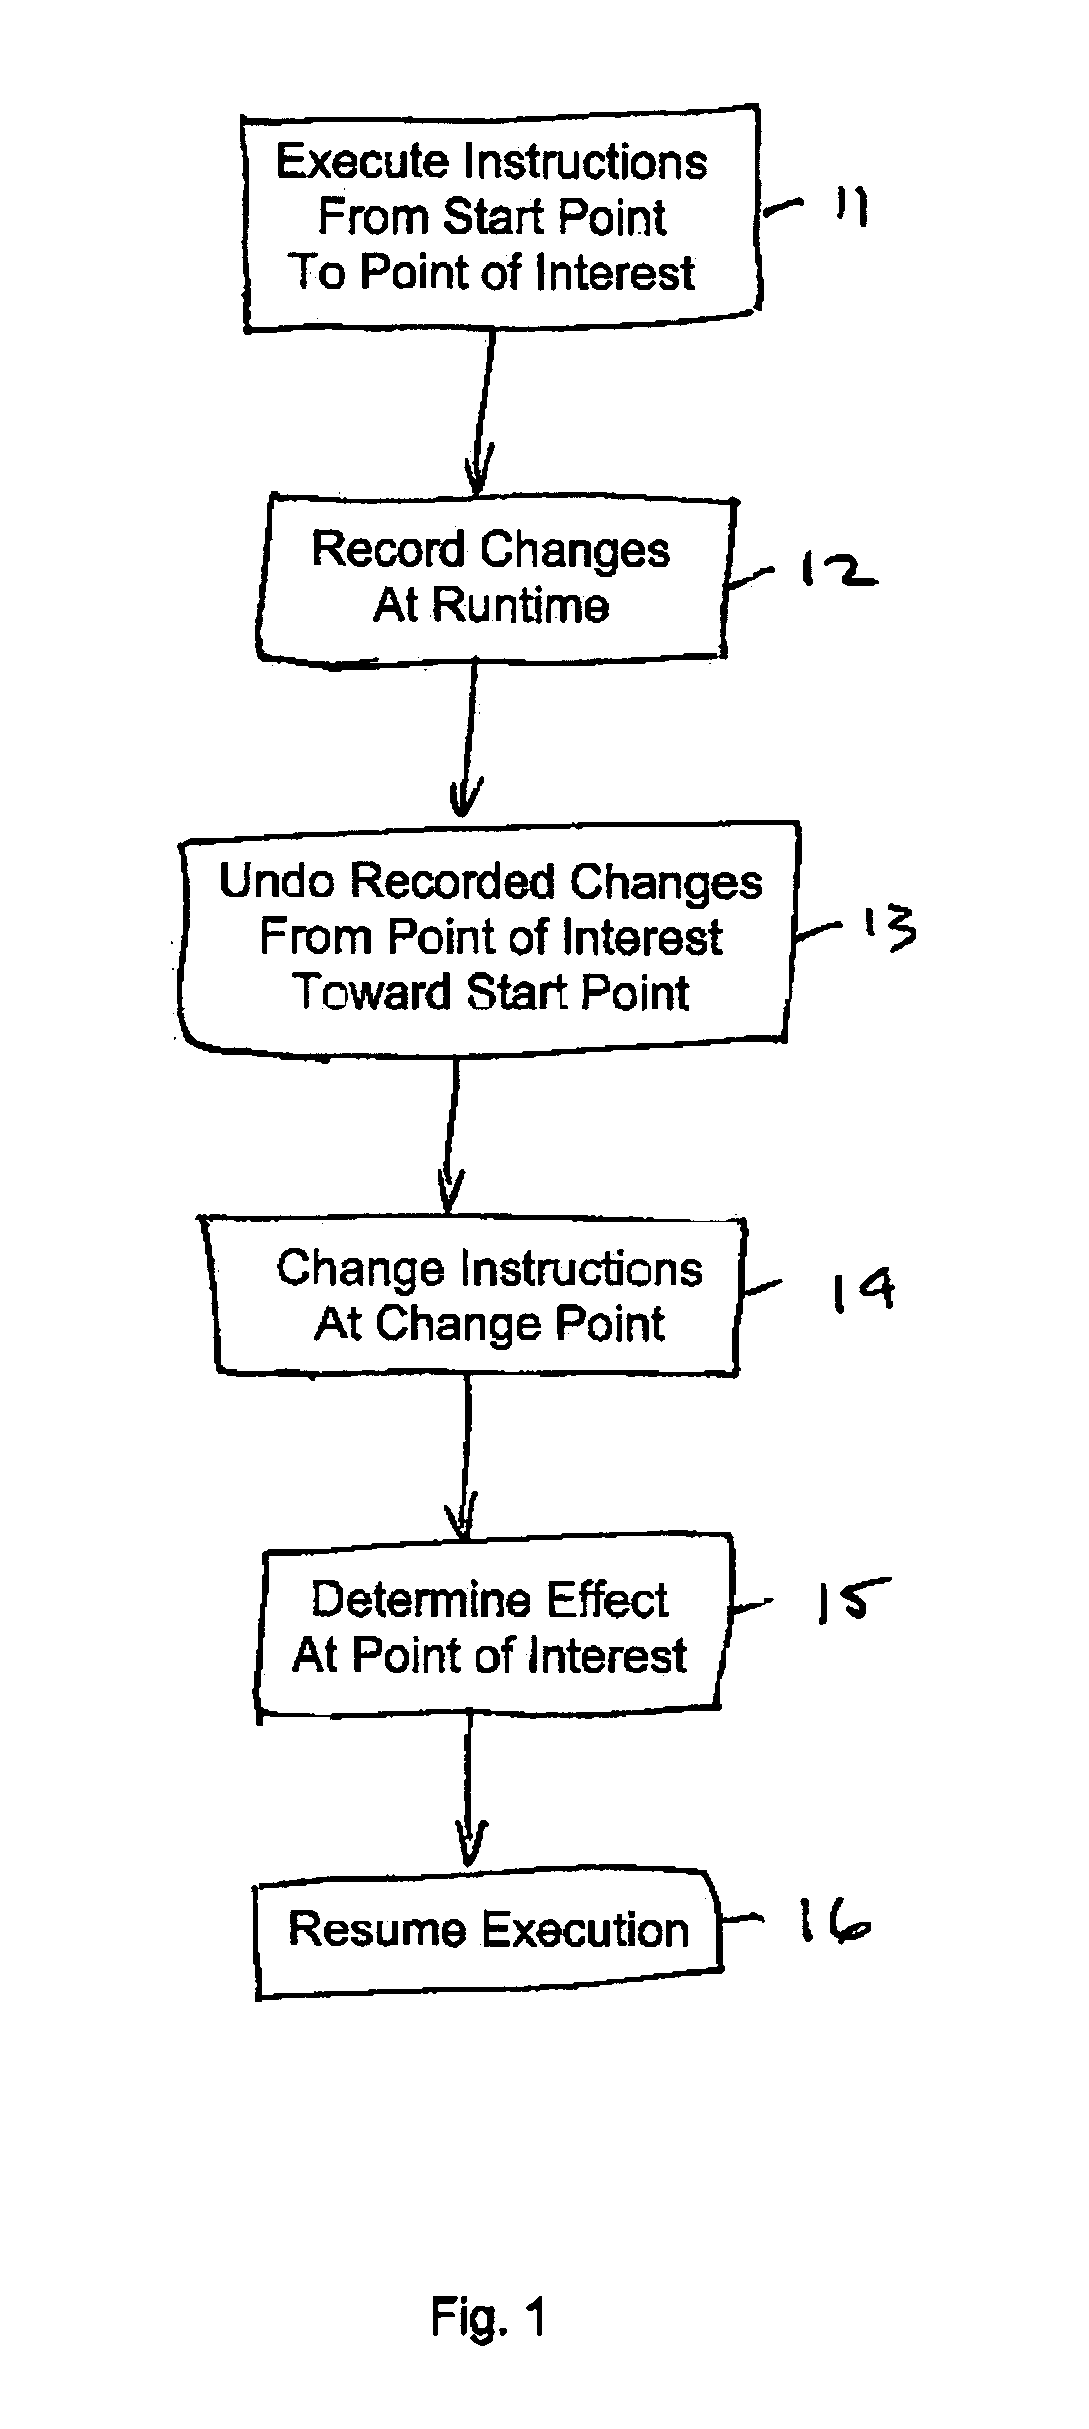
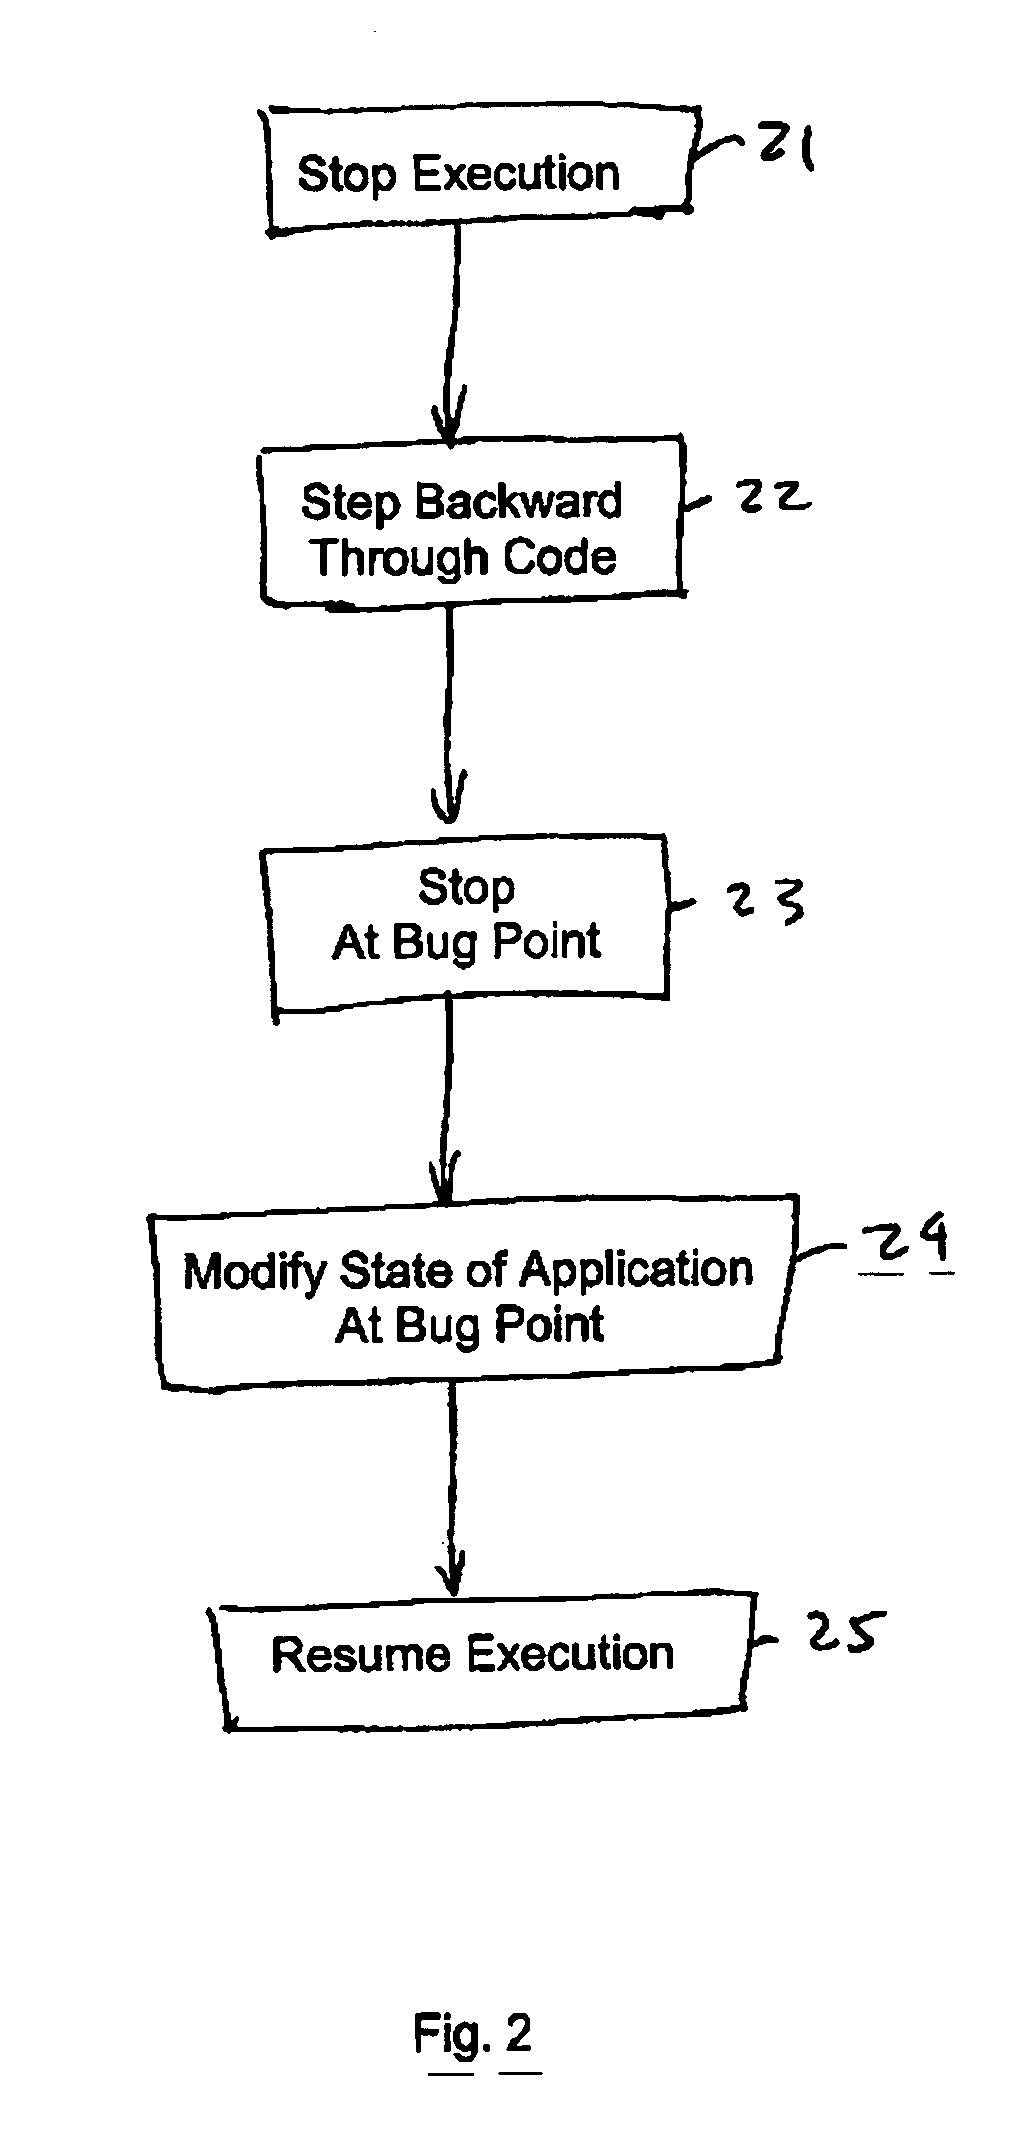
[0004] The present invention provides an easy-to-use and highly discoverable interface that allows a developer to step backward through code in a conventional debugger. The process of the invention allows a software developer to step backward, line-by-line, out of the current function, to the last breakpoint, to a specific line, or to the point where a memory location or variable was modified, and provides the ability to back-step past common kernel calls and exceptions.
[0005] According to the present invention, a user can step back to the point where a specific value was placed in a specific memory location. Debugging of heap overruns, stack overruns, race conditions, and deadlocks is simplified. Also, a user can save the execution history to disk along with a crash dump, preferably to an extent that the complete process state over time can be recorded during application usage, so that this information can later be processed by the present invention as integrated with a standard IDE, allowing full backward and forwards debugging session to be executed. According to the invention, a user can perform exploratory testing and rollback from crashes, drop bookmarks to be to indicate major decision points / paths through the testing process, and generate a decision graph / report that shows the steps through an application. When the debugging tool is enabled, an application will run at a reasonable percentage, for example, 25%, of its normal operating speed.
[0007] Using the process, a user can step back out of race conditions and deadlocks, and investigate their cause, and can step back to the line of code that last modified any given variable or memory location, with modes for finding the cause of heap and stack overruns. The process also allows for stepping back to the point where a specific value is written to the variable or memory location (a specific loop index, for example). As an optional feature, the process can include the action of saving the execution history to a file along with a crash dump, allowing the user to later open the file into the conventional debugger and still be able to step backward through the code. Thus, the debugging tool can act as a “black box” that records the exact sequence of events leading to a failure, with the ability to replay this sequence whenever it is needed. The debugging tool can also include a non-debugger interface that allows users to step machine-state-backward during testing without requiring use of a debugger.
[0022] According to another aspect of the invention, a memory medium stores instructions executable by a processor to provide an interface that allows a user to perform the process described above.

Problems solved by technology

The ability to step backward in code has been possible using standard debugging techniques, but conventional schemes for doing so are not practical.
Unfortunately, the performance implications of this scheme make it impractical.
A single step in a traditional debugger requires two context switches and an exception, which is extremely slow relative to the actual execution of the instruction.

Method used


Image

  • Method of debugging code and software debugging tool
  • Method of debugging code and software debugging tool
  • Method of debugging code and software debugging tool

Examples


example 1

[0053] User 1 is developing a multithreaded application that can process commands from multiple threads at the same time. He has a race condition in his software that is causing the application to crash with an access violation, but only some of the time. He got a repro under the debugger, and wants to investigate why it is happening. It is crashing during a traversal of a linked list, with the current node pointing at invalid memory. He tried using conventional debugging techniques, but the other threads are all waiting for new commands, and nothing on the crashing thread's call stack helps determine how the pointer was invalid. In order to figure out how the pointer got to be invalid, he uses the “step back” command of the present invention to step backward to the last time the current node was updated, and finds that it was this line of code:

currentNode=currentNode→next;

[0054] Somehow, the “next” field of his node structure is not valid. Because this thread was sitting in a read ...

example 2

[0058] User 2 has a heap corruption bug in the application he is developing, and he needs to get a fix to the customer as soon as possible, as it is blocking them from doing their work. He compiles in debug mode and the Visual C++ runtime gives him the debug error shown in FIG. 7.

[0059] User 2 clicks retry to debug and finds that the heap is corrupted when he tries to execute a “delete [ ]” operation in his code. Normally, he would have trouble finding where the actual point of corruption was, but he now has the “step back to the last point where a memory location was modified” command in his conventional debugger, provided by the present invention. He activates this command, points it at the heap block given, and the feature takes him directly back to a “memcpy” call that copied more than the buffer's length. He fixes the bug, and is able to get a fix to the customer the same day.

example 3

[0060] User 3 is working on a component that generates unique identifiers for a session in her company's application. It works most of the time, but occasionally it crashes with an access violation. Since it generates unique identifiers on each run, she can't just restart it under the debugger and single-step through the code, since it's unlikely that it will crash on that specific instance.

[0061] Now, however, she has the capability to step backward in the debugger, as provided by the present invention. She writes a small test application that calls her component repeatedly, and starts that under the debugger. After a few minutes, the test application hits the bug and the conventional debugger displays the exception information.

[0062] The component is trying to access a null pointer in one of the lookup tables she had generated earlier in the code. To find why this entry was null, User 3 opens the table in the memory view, finds the offending entry, and right-clicks. The context ...


PUM


Abstract

A process of debugging application code includes stopping execution of the application, stepping backward through the code by line or instruction, stopping at a bug point in the code, modifying the state of the application at the bug point, and resuming execution of the application. A memory medium stores instructions executable by a processor to perform the process, or stores instructions executable by a processor to provide an interface that allows a user to perform the process. A system includes a processor that executes instructions to perform the process, or includes a processor that executes instructions to provide an interface that allows a user to perform the process.

Description

CROSS-REFERENCE TO RELATED APPLICATION [0001] This is related to and claims priority from U.S. Provisional Patent Application No. 60 / 563,240, which was filed on Apr. 16, 2004.BACKGROUND OF THE INVENTION [0002] When debugging software, it would be helpful to step backward through the code to find the root cause of a bug. The ability to step backward in code has been possible using standard debugging techniques, but conventional schemes for doing so are not practical. Using conventional techniques, a debugger single-steps through every instruction the application executes to record a log of exactly what has changed in the application's state on a per-instruction basis. Unfortunately, the performance implications of this scheme make it impractical. A single step in a traditional debugger requires two context switches and an exception, which is extremely slow relative to the actual execution of the instruction. [0003] Further, conventional step-backward debugging for compiled code cause...

Claims


Application Information

Patent Timeline
Patent Type & Authority Applications(United States)
IPC IPC(8): G06F9/45
CPCG06F11/3664G06F11/362
Inventor TAYLOR, JASON A.WAGNER, JOHN R.TAYLOR, MATTHEW A.
Owner RAYTHEON CO
Why Eureka
Try Eureka