
Reconstruction of gene networks from time-series microarray data

a gene network and time-series microarray technology, applied in the field of causal relationship analysis using timeseries data, can solve the problems of poor quality of regulatory relations in databases, and it is difficult to use machine learning to reconstruct gene networks

Inactive Publication Date: 2005-11-17
ACAD SINIC
View PDF0 Cites 10 Cited by
  • Summary
  • Abstract
  • Description
  • Claims
  • Application Information

AI Technical Summary

Problems solved by technology

In the case of gene or protein networks, databases with large number of data do not exist and quality of the regulatory relations in the databases is poor.
These facts made it difficult to use the machine learning approach in the reconstruction of gene networks.

Method used


Image

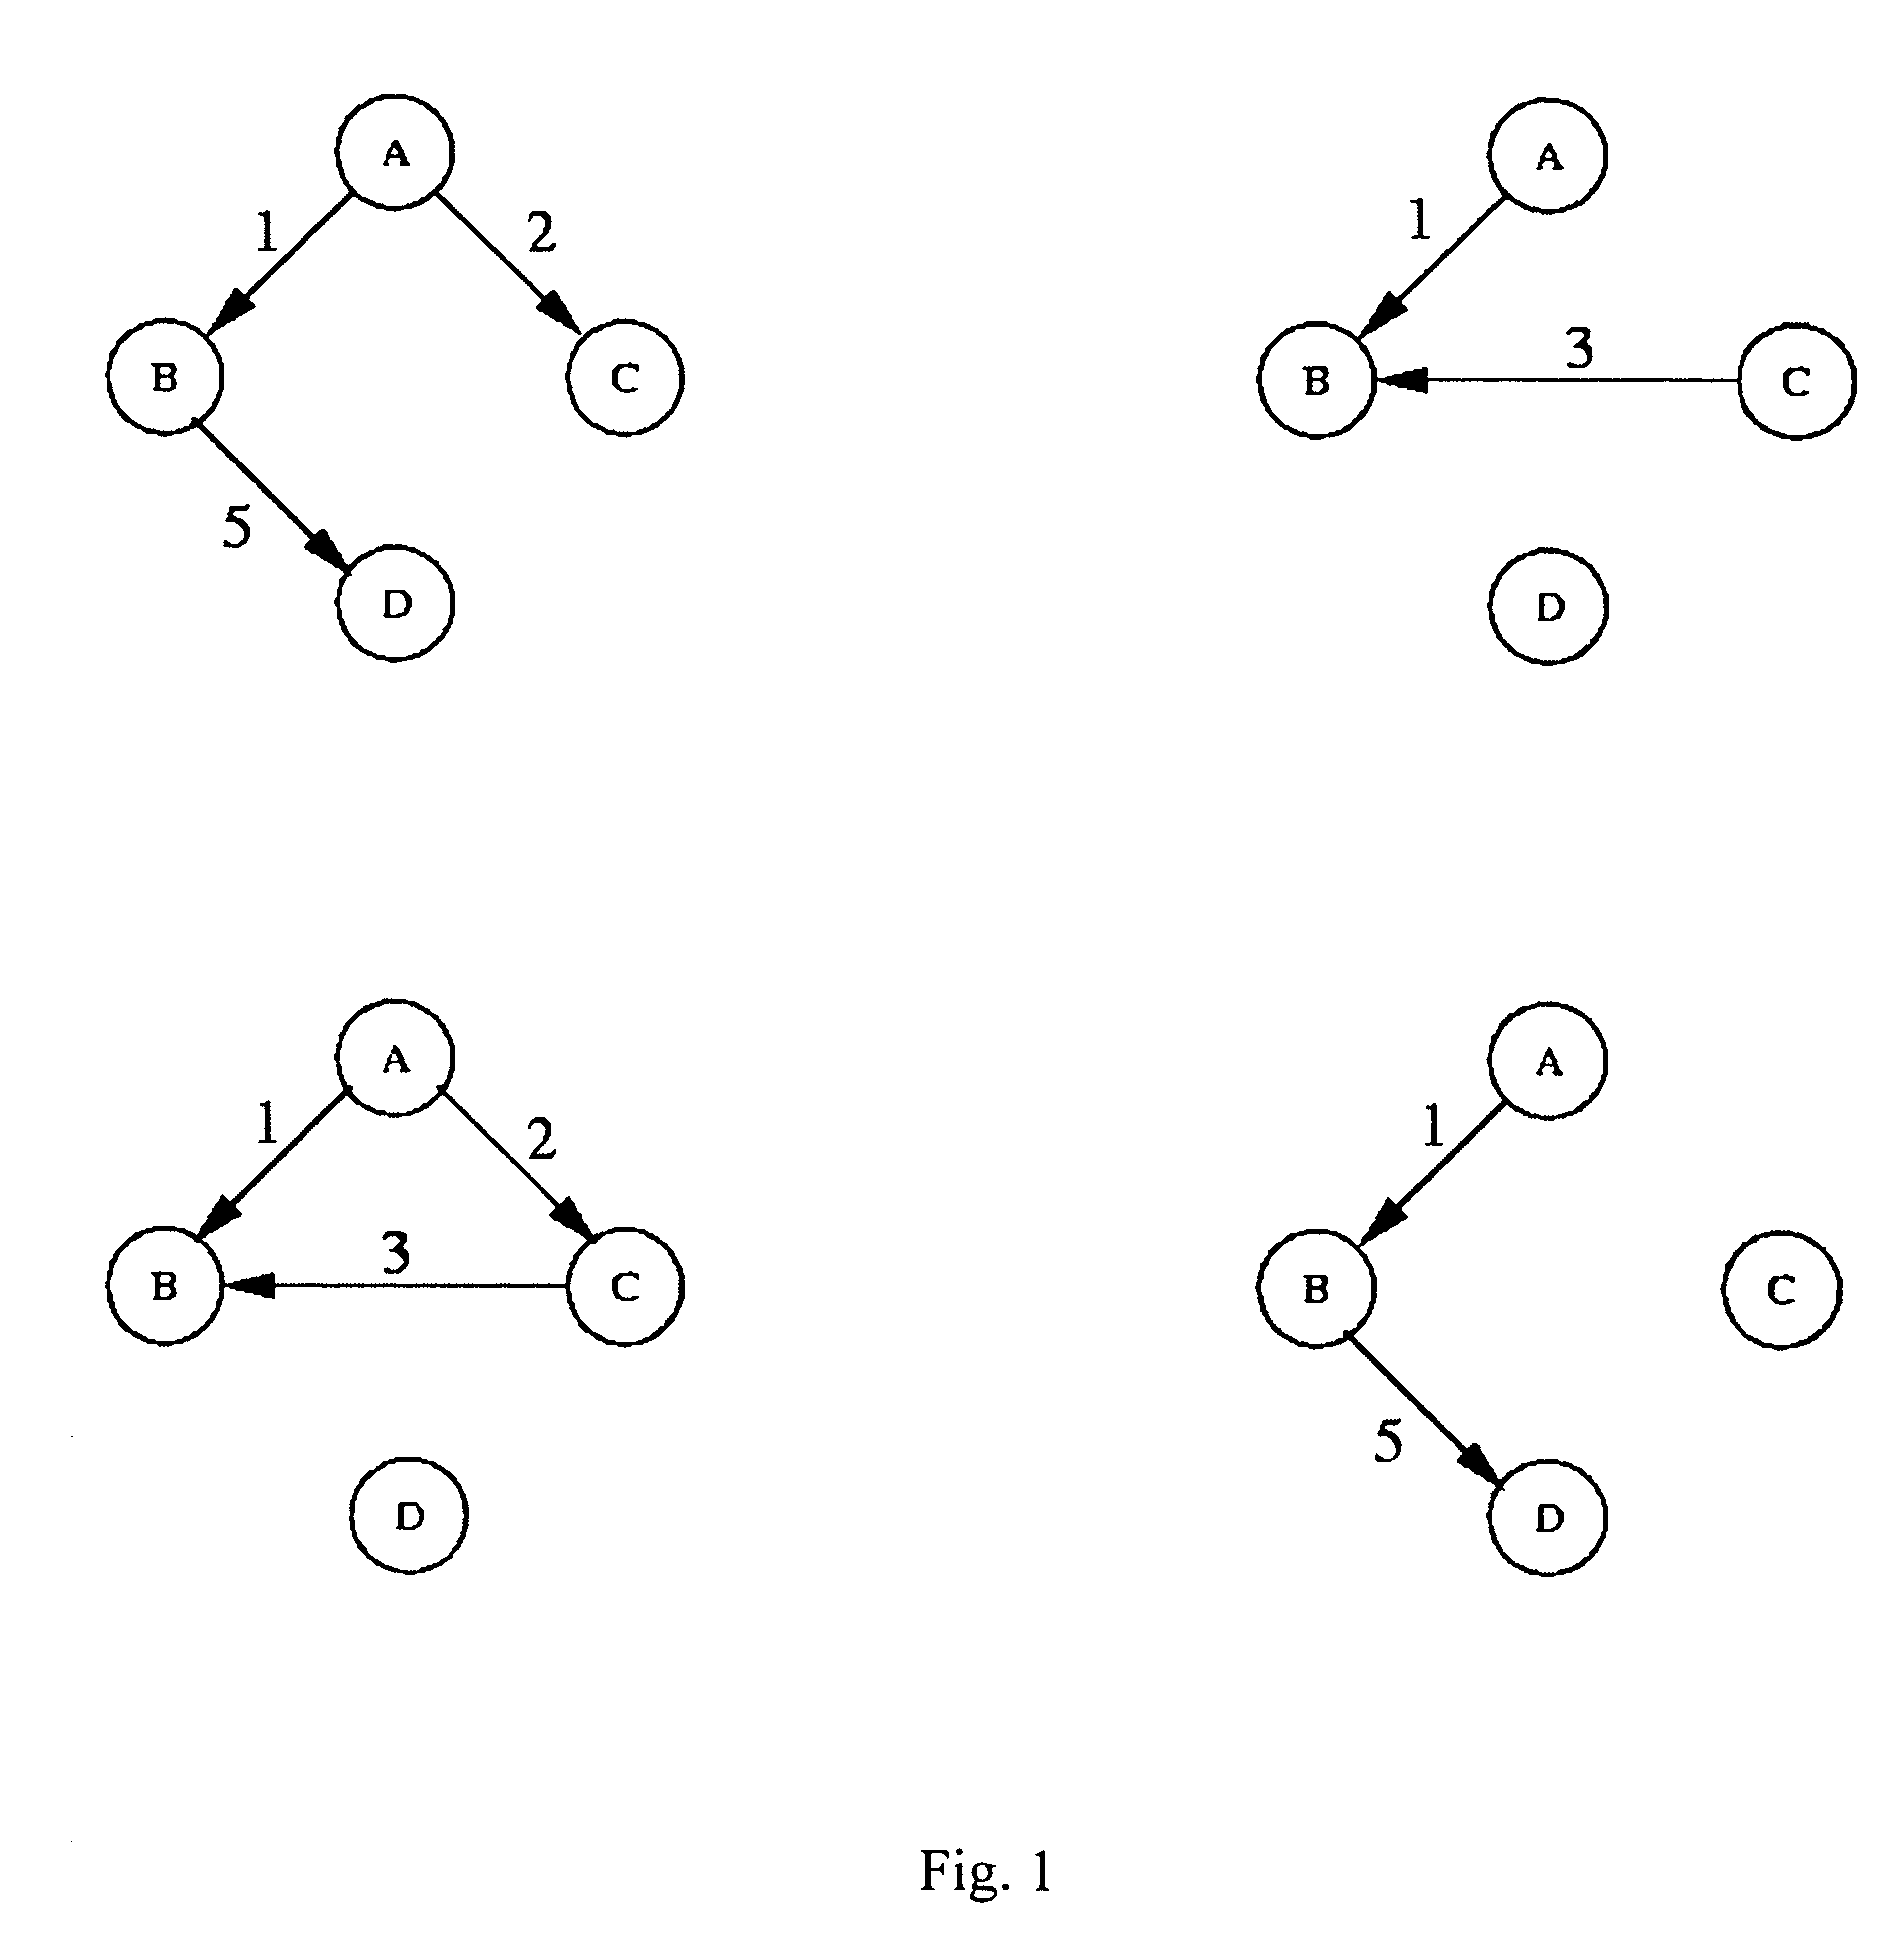
  • Reconstruction of gene networks from time-series microarray data
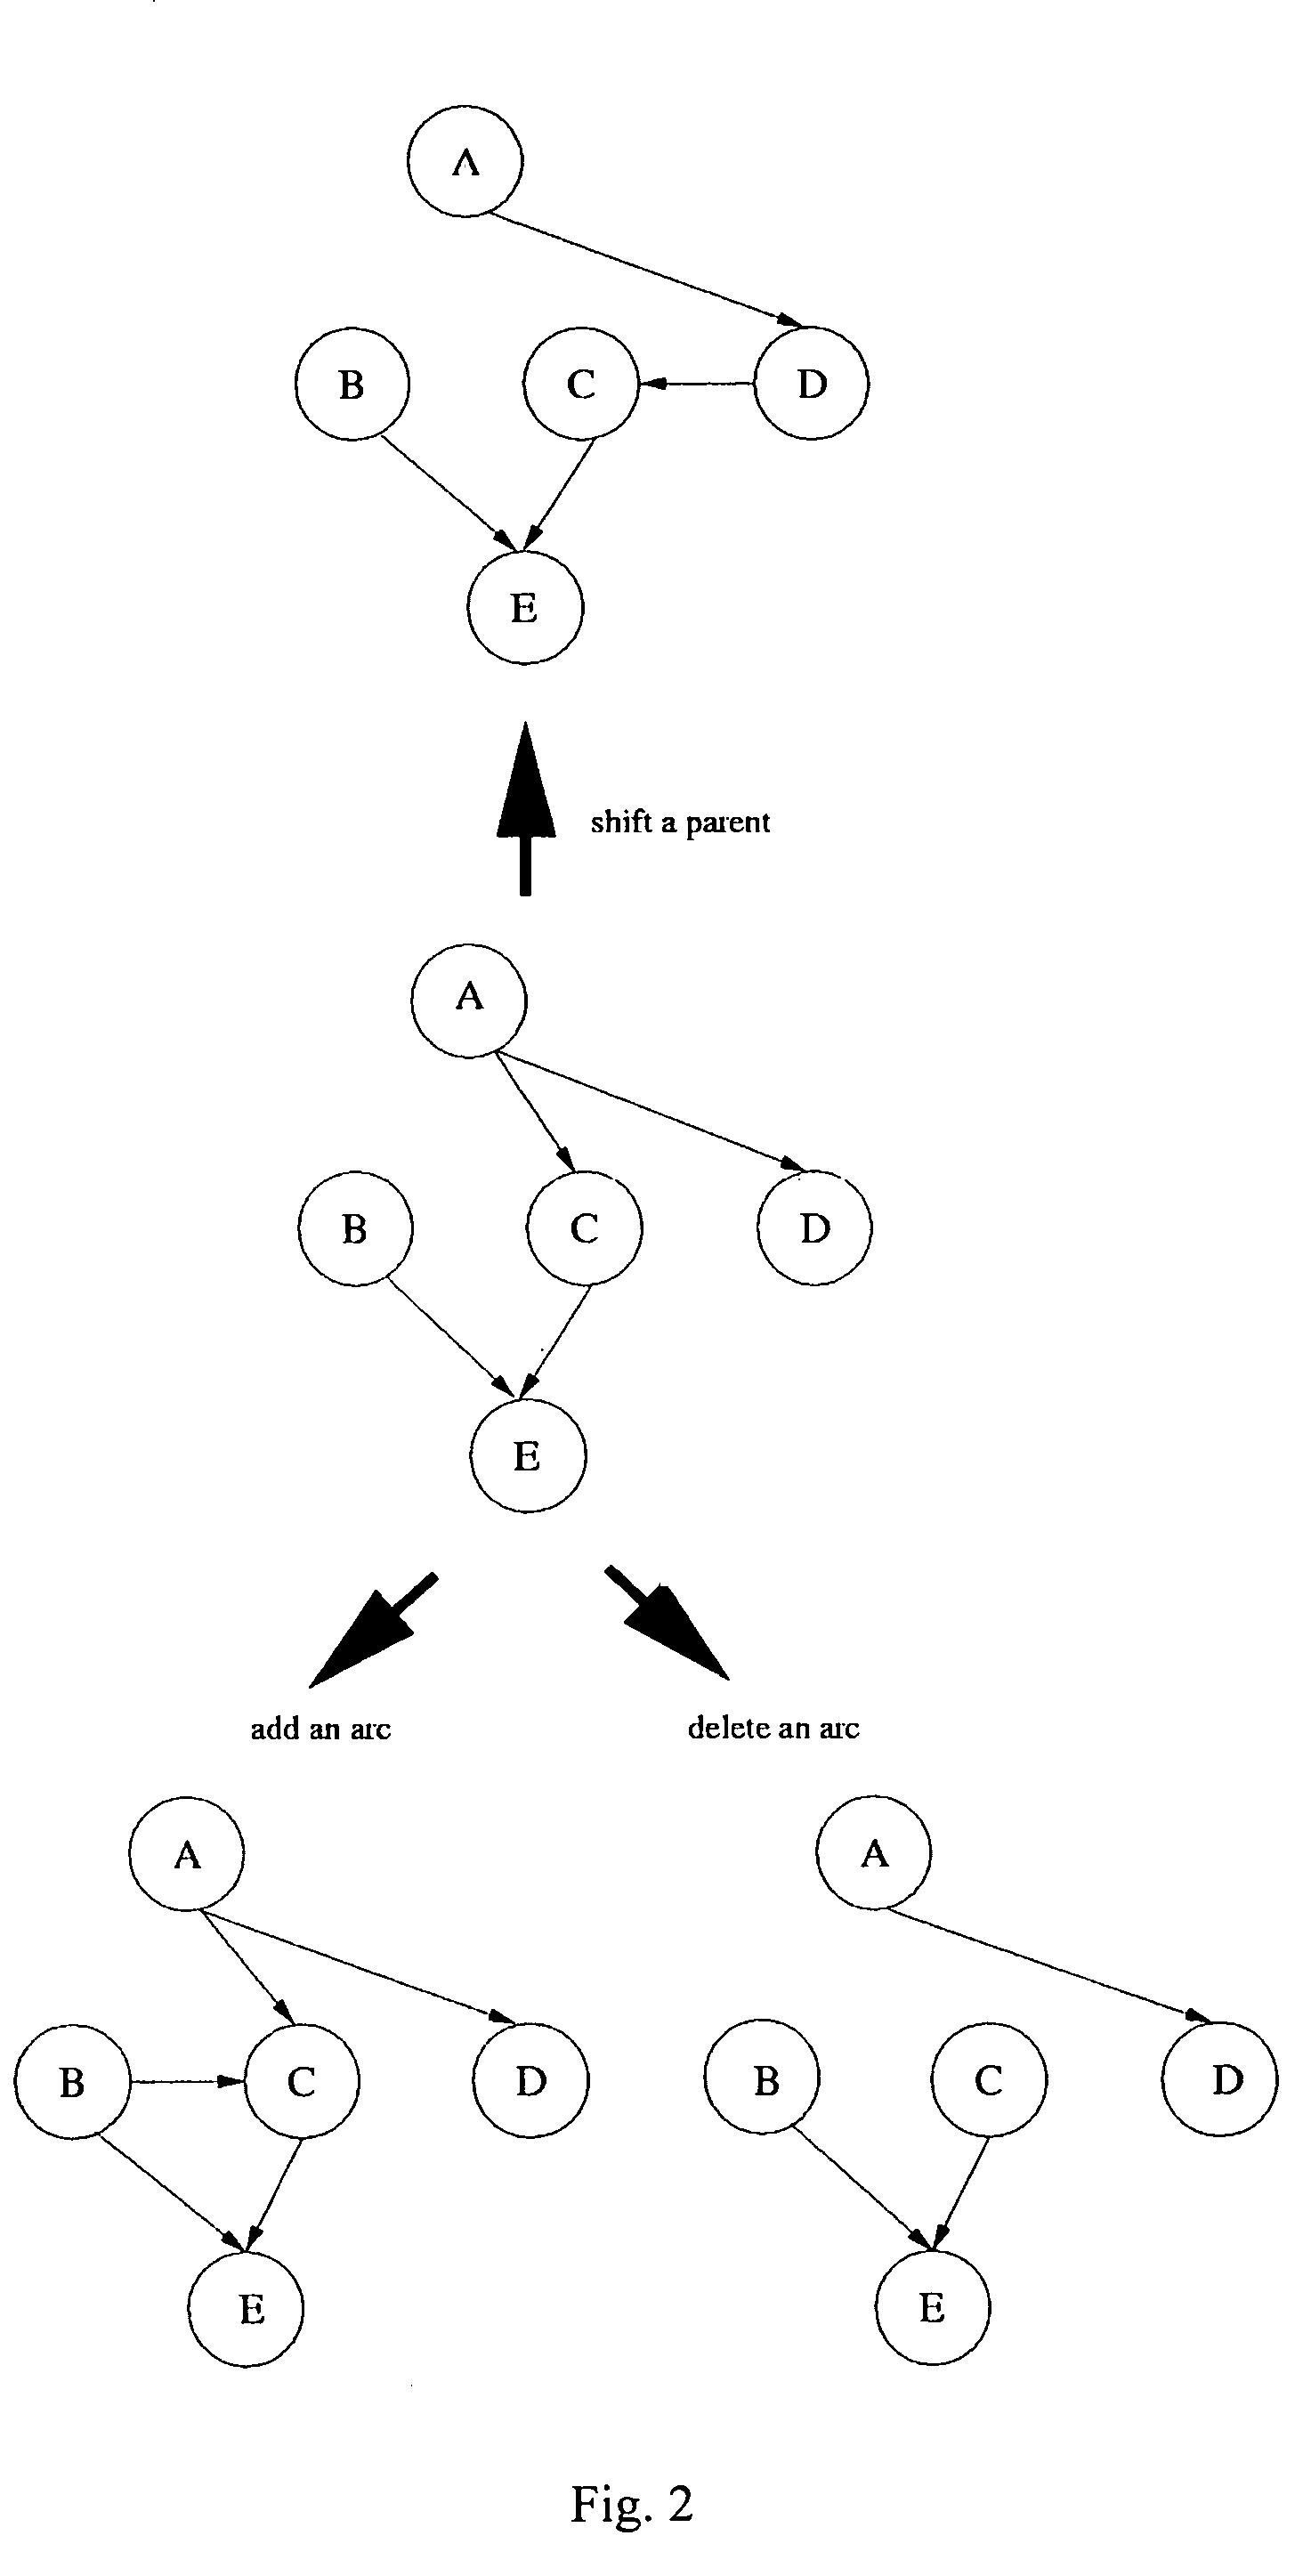
  • Reconstruction of gene networks from time-series microarray data
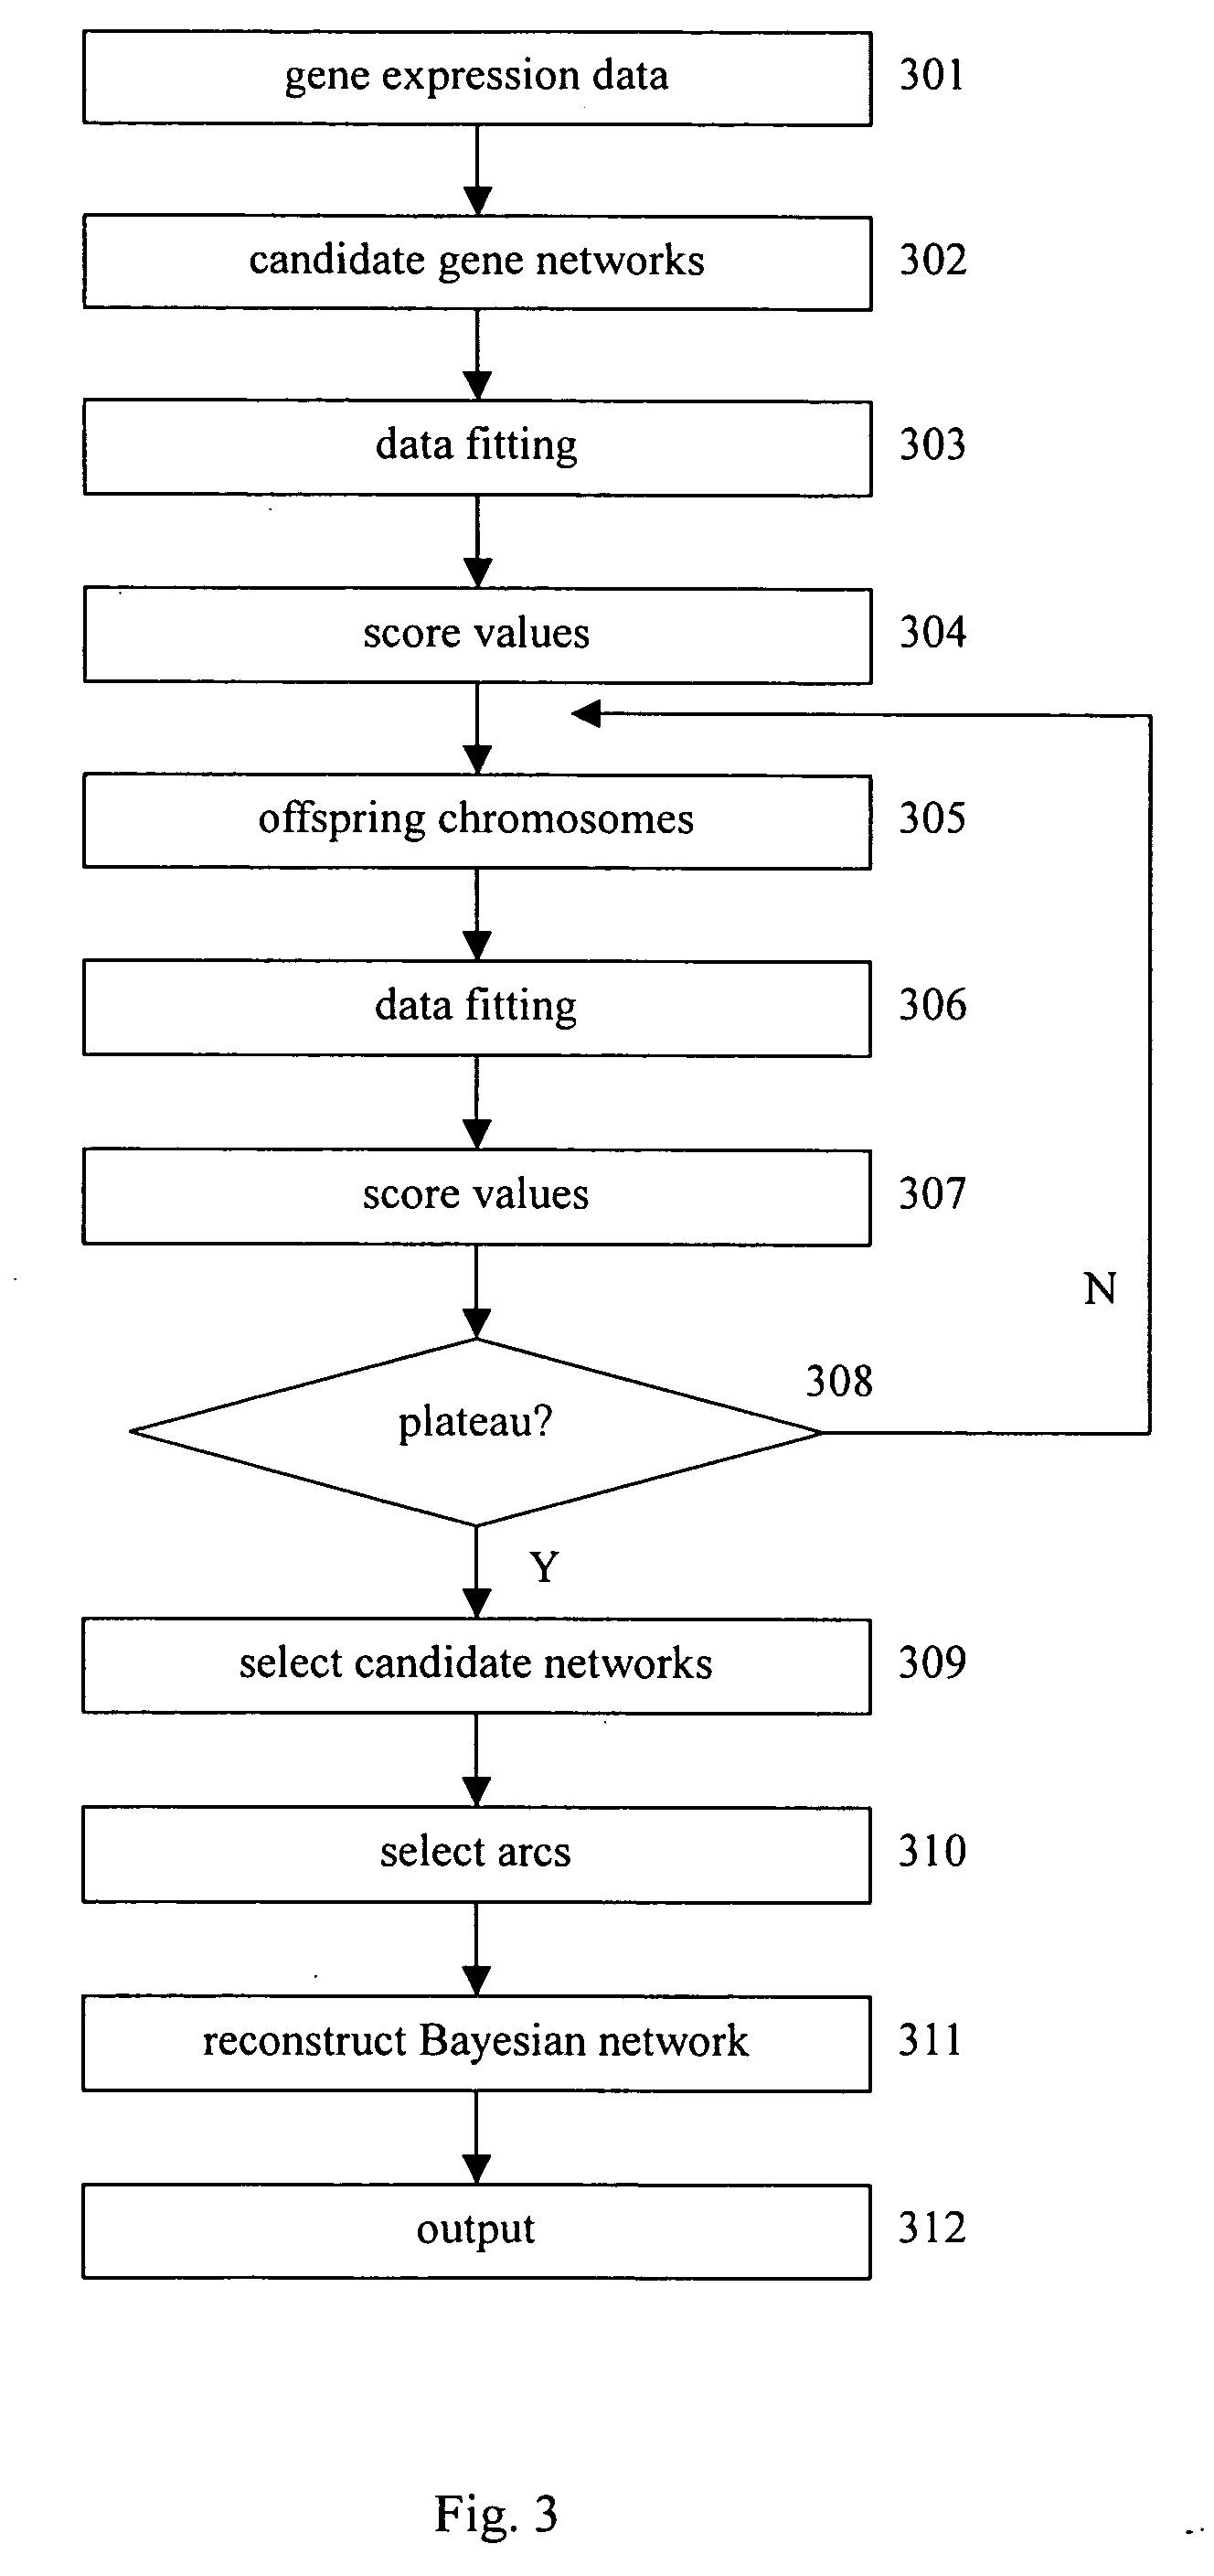
  • Reconstruction of gene networks from time-series microarray data

Examples


Embodiment Construction

[0043] The task of gene network reconstruction is to find the structure, together with the appropriate parameters in it whose joint probability density is maximal. A system to reconstruct the gene regulation network shall provide a function to describe and to estimate the regulatory relations between and among gene expressions.

[0044] Events of gene expression are stochastic. Microarray technology in its infancy incurs substantial noise. Because of the cost, replications in typical microarray experiments remain low. Methodologies to reconstruct gene regulation networks should therefore bear rich statistics and probability semantics. It is found that a graph-based method called Bayesian network (BN), well developed in the filed of uncertainty and artificial intelligence, suits most of the requirements. It is thus possible to use a Bayesian network to reconstruct a gene regulation network.

Bayesian Network (BN)

[0045] A BN consists of nodes and arcs. In using a BN to represent the ge...


PUM

PropertyMeasurementUnit
timeaaaaaaaaaa
joint probability densityaaaaaaaaaa
probability densityaaaaaaaaaa

Abstract

Gene regulation network is reconstructed using time series microarray data under the method of the Bayesian network. Particular power-law function is used to calculate the joint probabilities among genes across time points. This invention discloses the use of the downhill simplex algorithm to find global maxima of interrelational likelihood. Arcs with higher frequencies are selected to establish the gene regulation network. Prior knowledge may be included into candidate gene networks to accelerate search for best networks.

Description

FIELD OF THE INVENTION [0001] The present invention relates to analysis of causal relationships using time-series data, especially to its application in the reconstruction of gene regulation networks using time-series microarray data. BACKGROUND OF THE INVENTION [0002] With the advent of DNA microarray technology, researchers can now measure the expression levels of all genes of an organism in a single assay. Measurements have since been carried out to observe the state of cells undergoing developmental program or subjected to experimental / environmental stimuli. Analysis of microarray data by clustering methods has become popular. In the analysis, patterns of gene expressions across time points or different treatments are grouped into clusters. The function of an unknown gene can then be inferred from that of the known genes in the same cluster. [0003] Although cells of the same species carry the same genetic blueprint in the DNA, not all genes express particular features at any giv...

Claims


Application Information

Patent Timeline
Patent Type & Authority Applications(United States)
IPC IPC(8): G16B40/10C12Q1/68G01N33/48G01N33/50G06F19/00G16B5/20G16B25/00
CPCC12Q1/6837G06F19/24G06F19/20G06F19/12G16B5/00G16B25/00G16B40/00G16B40/10G16B5/20
Inventor LI, SAI-PINGWANG, SUN-CHONG
Owner ACAD SINIC
Learn More