Method for continuous interpretation of monitoring data
a technology of interwell permeability and data, applied in the field of cross correlation of data to monitor formation properties, can solve the problems of difficult translation of these methods for continuous updating of interwell permeability with non-systematic or irregular pulsing, and lose the value of high frequency information, so as to achieve the effect of simple practi
- Summary
- Abstract
- Description
- Claims
- Application Information
AI Technical Summary
Benefits of technology
Problems solved by technology
Method used
Image
Examples
example 1
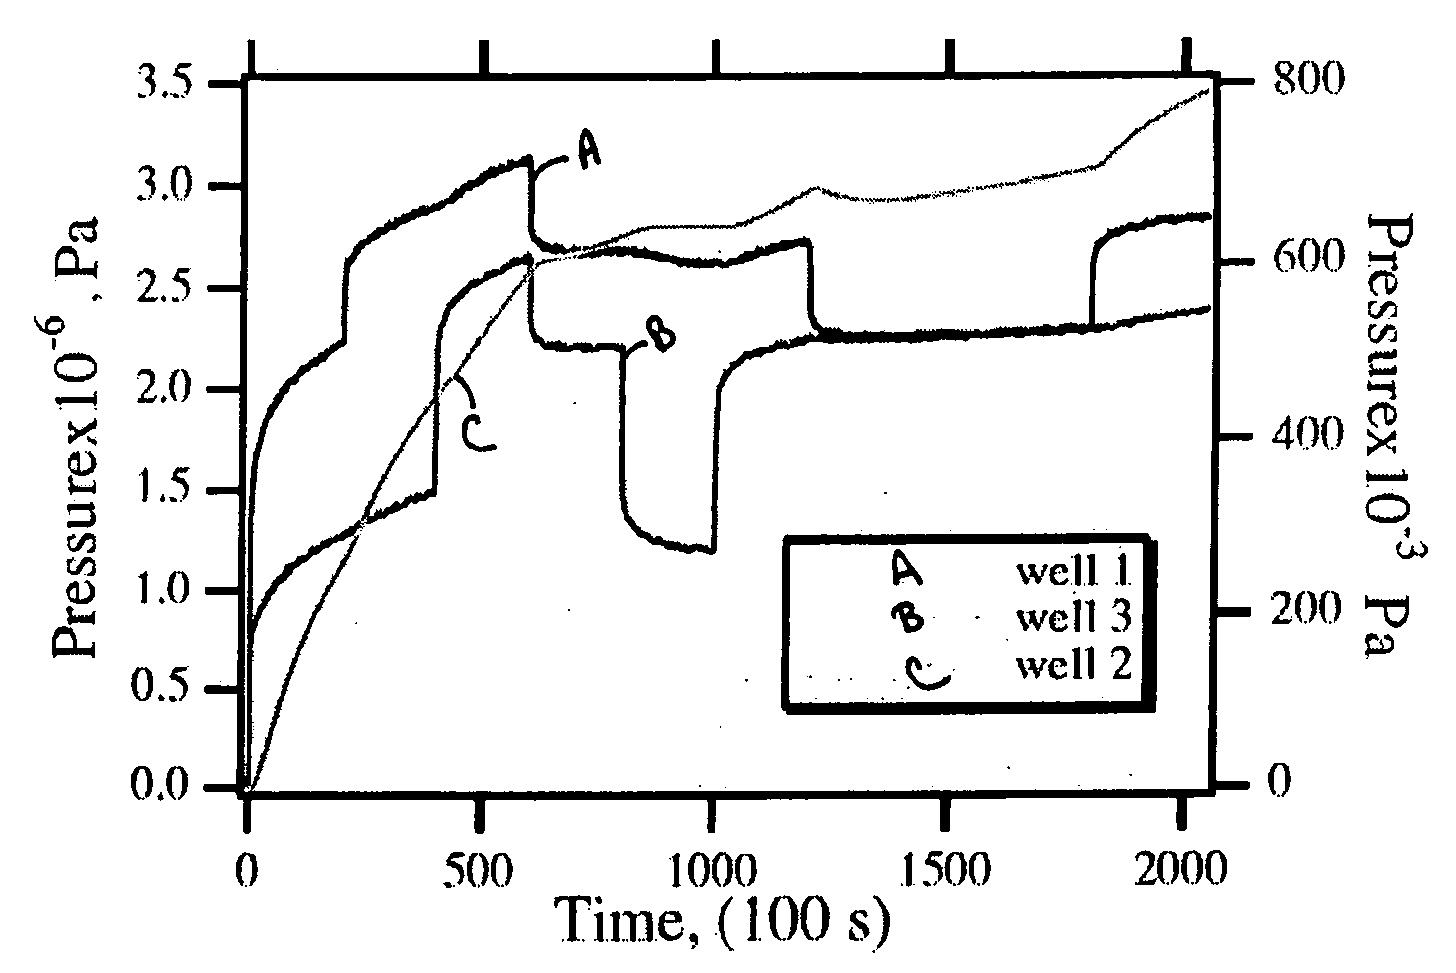
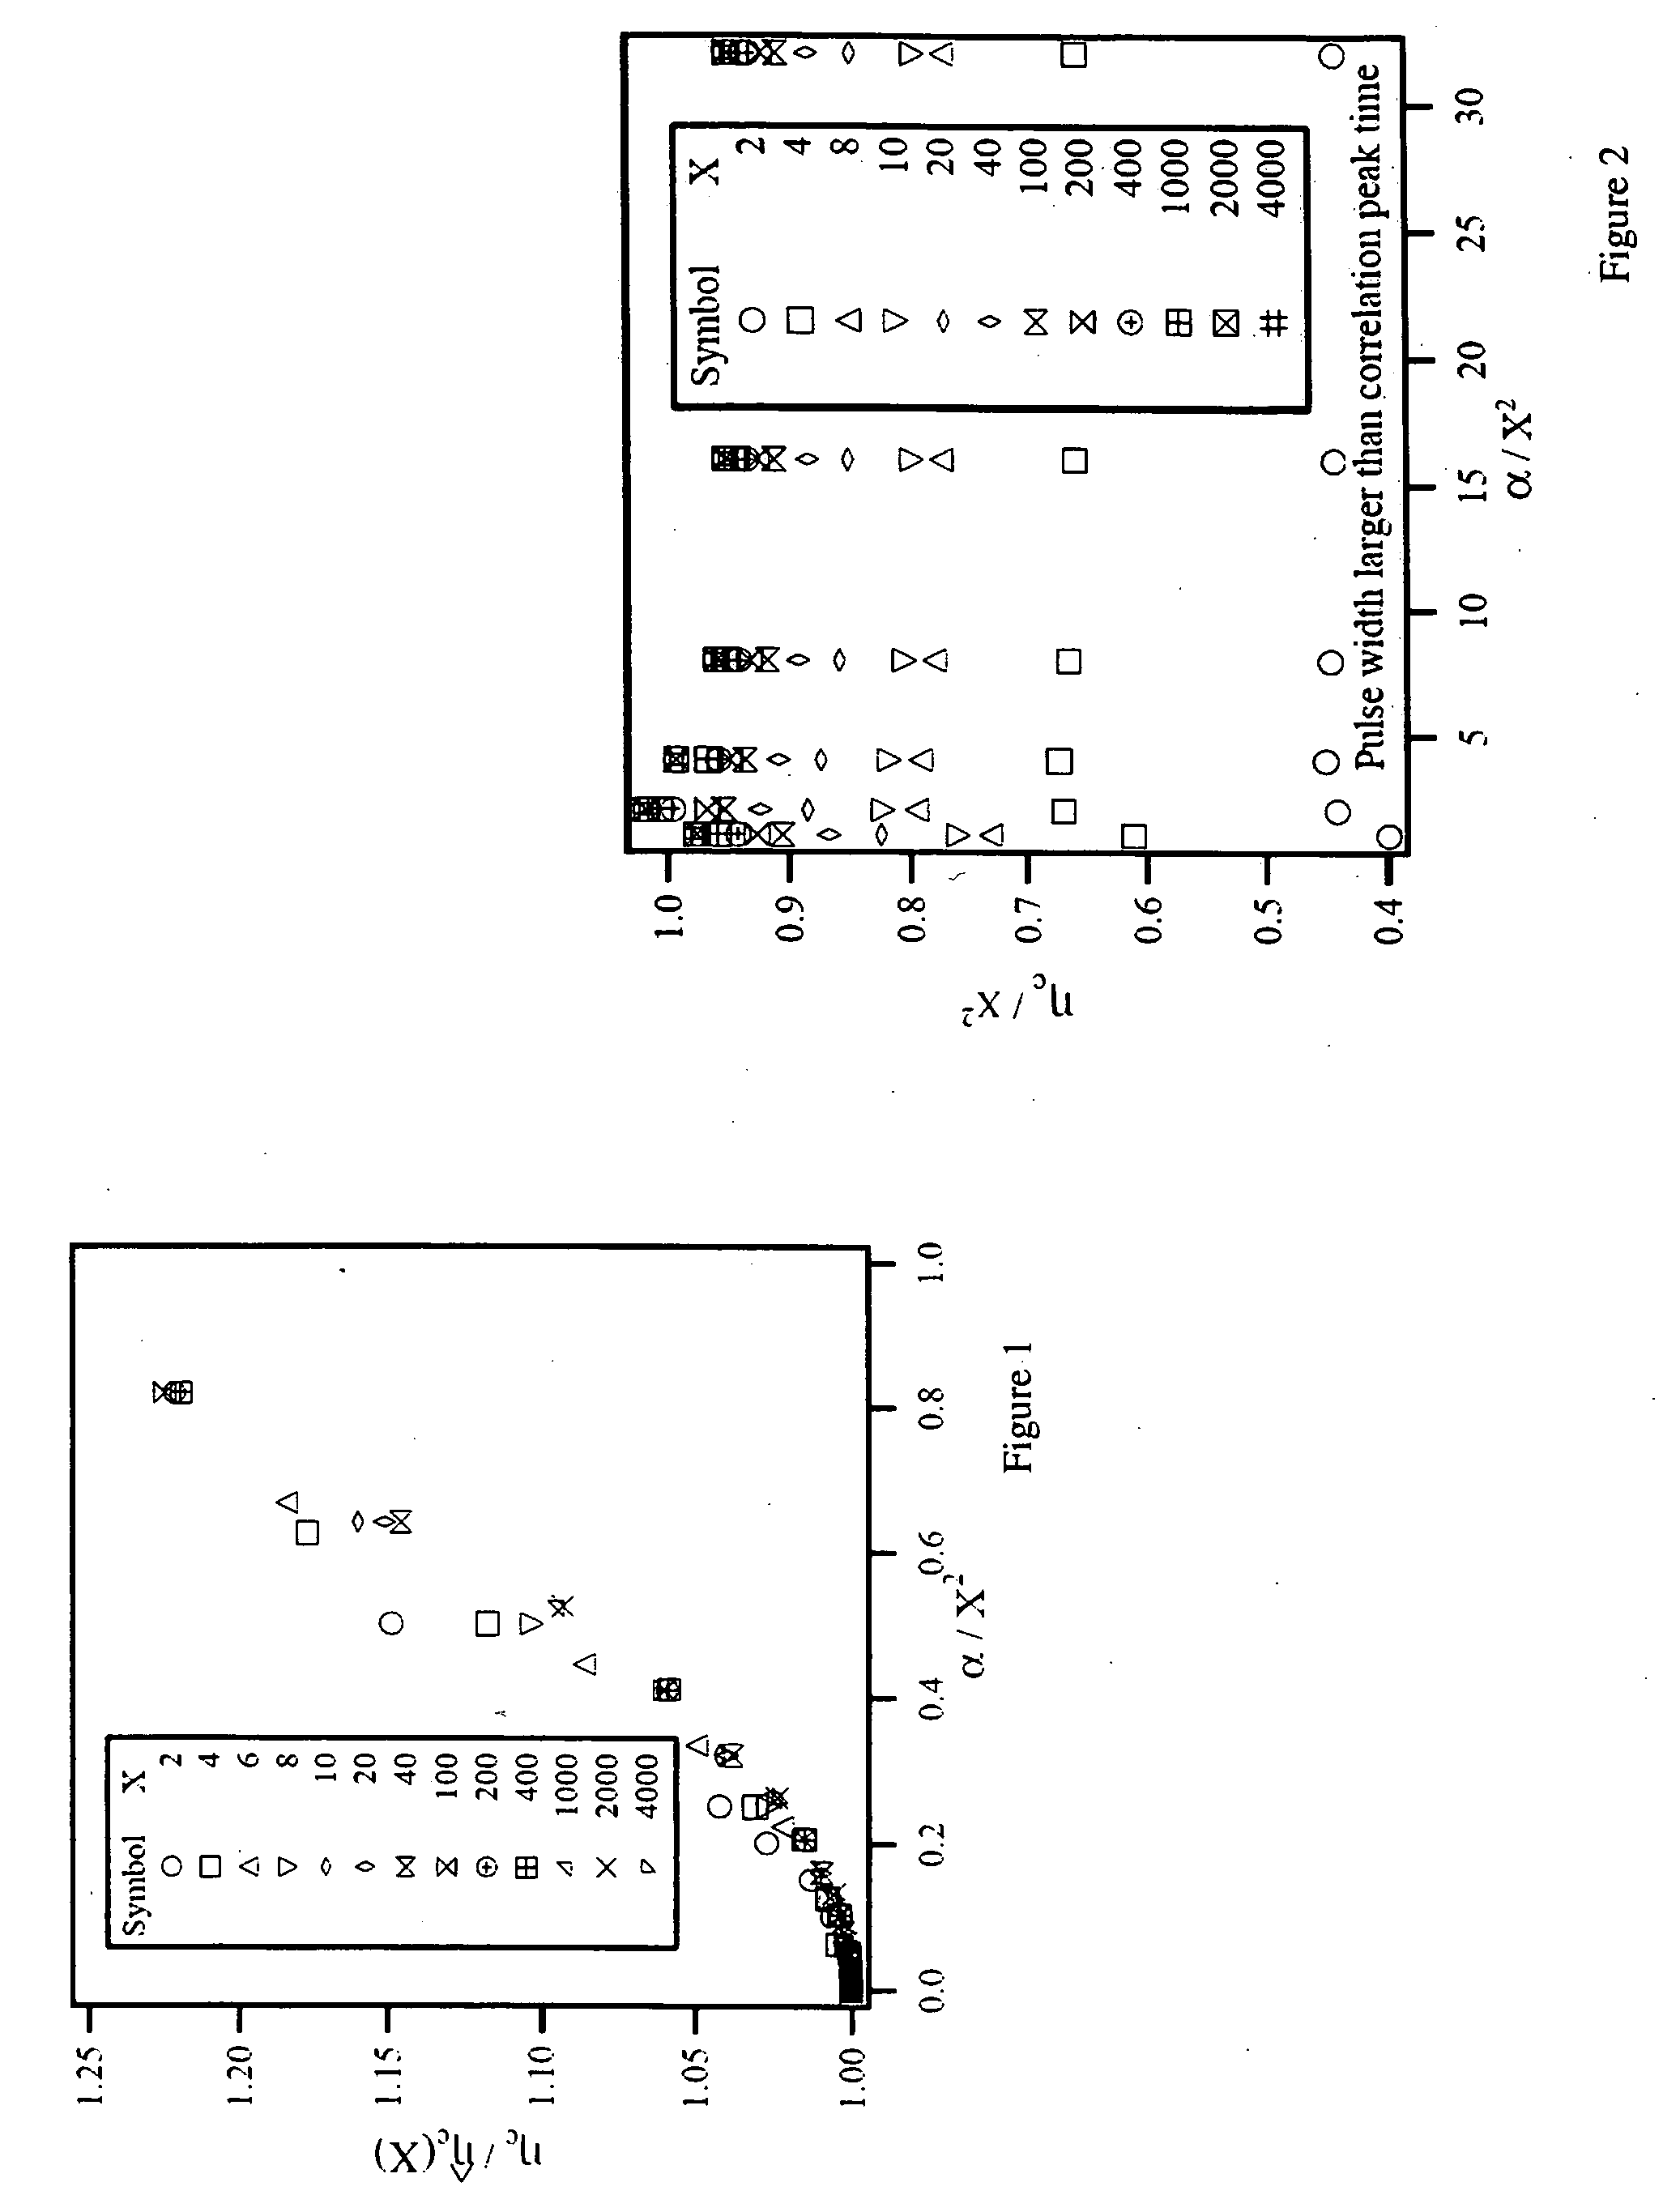
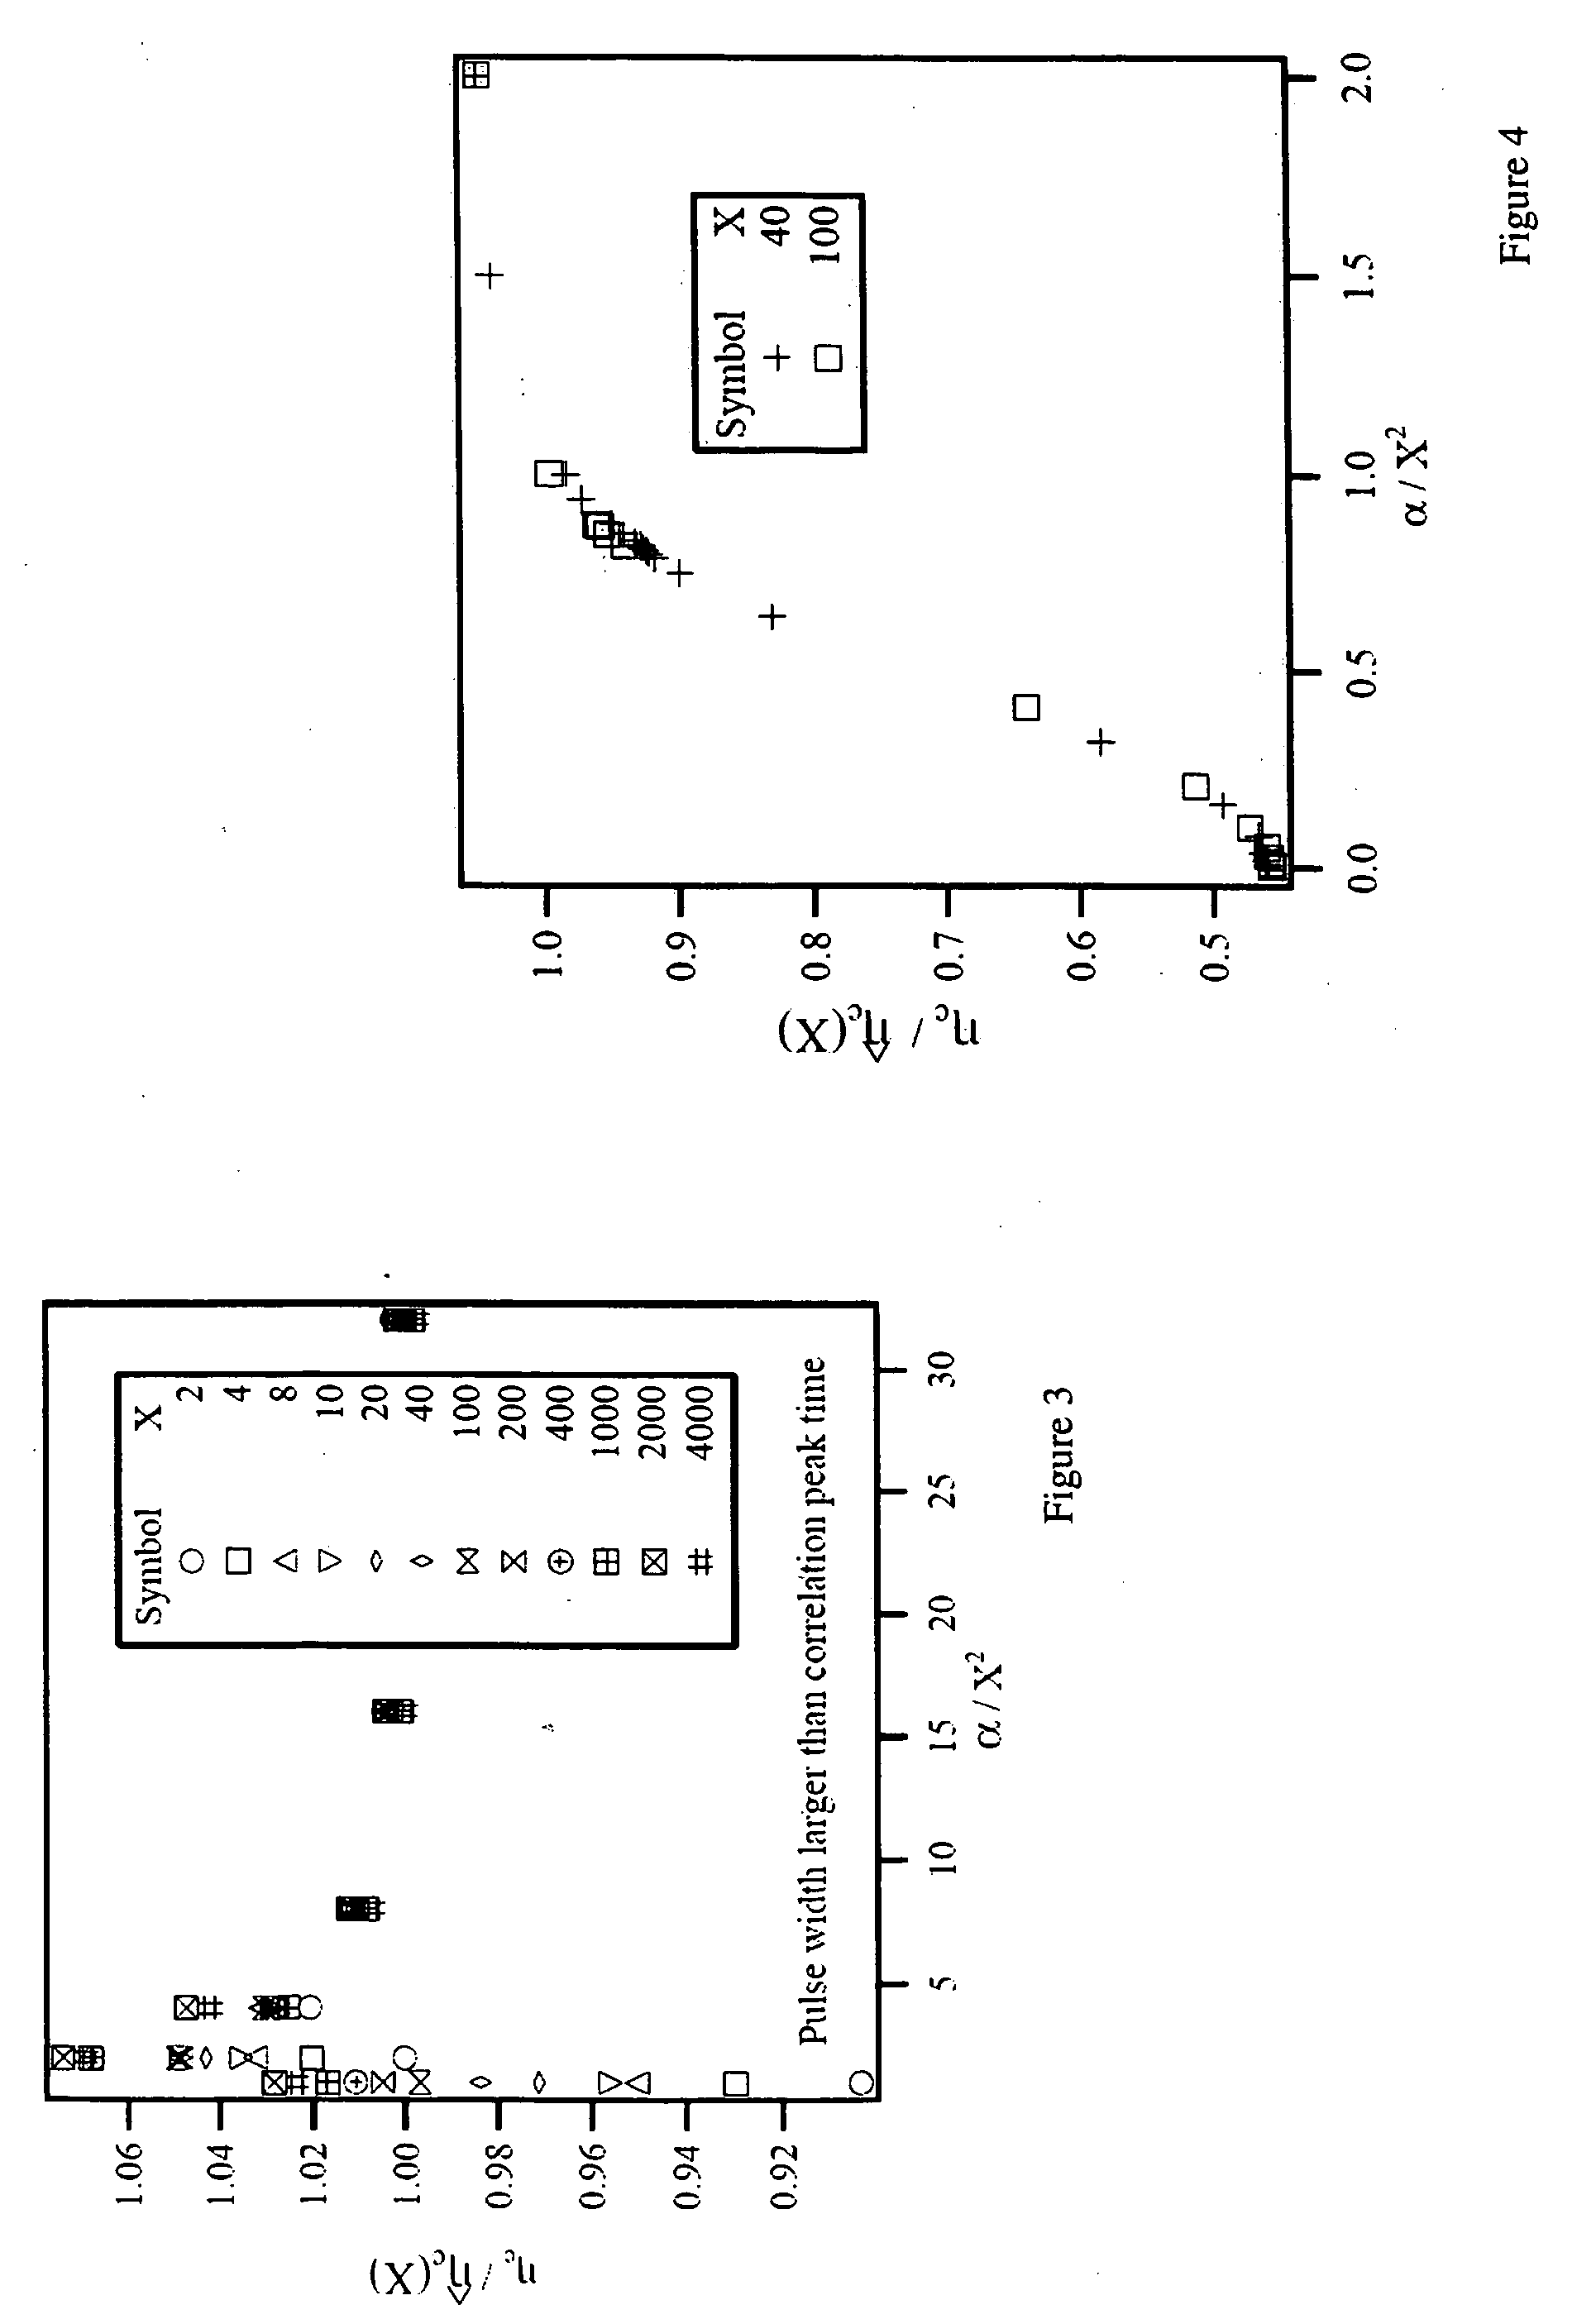
[0067] In this example, there are three wells that are colinearly located as shown in the '671 Patent and in FIG. 10(a). One of them, well 2, is an observation well. Wells 1 and 3 are active wells, 40 m apart, and well 2 is a passive or observation well. Wells 1 and 2 are 40 m apart, whereas well 2 and 3 are 80 m apart. The permeability of the formation is 0.1 μm2 (≈100 mD). The porosity is 0.25, the viscosity is 0.001 kgm−1s−1, and the compressibility is 4×10⁻⁹ m2N−1. All the trial calculations included an initial step on which were superimposed finite width pulses. For this example, the interpretation steps are the following. [0068] Pulse active wells 1 and 3 with respect to a background rate. [0069] Ensure that the pulses of each active well are sufficiently separated from those of others and the pulses are wide enough to be larger than the correlation time expected. [0070] Create a window of data, preferably containing 2N (where N is a natural number) points, surrounding the pul...
example 2
[0079]FIG. 10(b) shows the XZ cross-section of the hypothetical reservoir used in this example. The reservoir is 3800 ft long, 2250 feet wide and 60 ft thick. The pressure support comes from an aquifer connected to the XZ plane on the end of the reservoir, 1350 ft away from the well. The formation porosity is 15%. The viscosity of the water and oil are 0.5 cP and 20 cP, respectively. The 600 ft long horizontal producer is divided into 3 hydraulically isolated zones, 160 ft, 180 ft and 180 ft long respectively by packers. Within each zone, the flow can be independently controlled by a variable choke valve. The valve controls the flow from each annular zone into the common tubing. All zones are initially shut. A numerical simulator (Eclipse) was used to simulate a pressure transient created by opening zone 3 valve.
[0080] FIGS. 11(a) and 11(b) show pressure derivative responses of zone 1 (line A) and zone 2 (line B) when zone 3 (line C) is opened for two different reservoir model scen...
example 3
[0083] This example illustrates the utility of this approach using real pressure data from a producing well. Details of the well and the reservoir are given in Bryant et al. (2002). FIGS. 13(a) and 13(b) show that the pressure derivative response of zone 2 to zone 3 opening is very different from the reverse case of zone 3 response to zone 2 opening. FIG. 13(a) shows the zone 2 response when zone 3 was opened after a shut-in. This is smaller and diffused as compared to the zone 3 response to opening after a shut-in shown in FIG. 13(b).
[0084]FIG. 14(a) shows the correlation function for the pressure derivatives in these two zones for the two tests. FIG. 14(b) shows a more detailed view of FIG. 14(a) at early times. (The arrows indicate correlation times for the two tests.)
[0085] Both plots show a peak at time 0 min which corresponds to relaxation of a hydraulic fluid filled rubber packer that is isolating the two zones. The data acquisition interval here is 1 minute. The correlatio...
PUM
 Abstract
Description
Claims
Application Information
 - R&D
- Intellectual Property
- Life Sciences
- Materials
- Tech Scout
- Unparalleled Data Quality
- Higher Quality Content
- 60% Fewer Hallucinations
Browse by: Latest US Patents, China's latest patents, Technical Efficacy Thesaurus, Application Domain, Technology Topic, Popular Technical Reports.
© 2025 PatSnap. All rights reserved.Legal|Privacy policy|Modern Slavery Act Transparency Statement|Sitemap|About US| Contact US: help@patsnap.com


