Method for analyzing an unknown material as a blend of known materials calculated so as to match certain analytical data and predicting properties of the unknown based on the calculated blend

a technology of unknown materials and blends, applied in chemical methods analysis, material analysis, instruments, etc., can solve the problem that u.s. patent no. 6,662,116 b2 does not provide a means of estimating the uncertainty of predicted properties, and achieves the effect of increasing the flexibility with which the invention can be applied and increasing the compatibility of the invention

Inactive Publication Date: 2006-03-02
BROWN JAMES M +1
View PDF2 Cites 18 Cited by
  • Summary
  • Abstract
  • Description
  • Claims
  • Application Information

AI Technical Summary

Benefits of technology

[0012] One of the possible inspection inputs for U.S. Pat. No. 6,662,116 B2 is a Viscosity Blending Number calculated from a viscosity measured at a single temperature. Some software packages that manipulate crude assay data employ viscosity blending algorithms that use Viscosity Indexes that are functions of viscosities measured at multiple temperatures. The current inve

Problems solved by technology

The method of U.S. Pat. No. 6,662,116 B2 does not provide a me

Method used


Image

  • Method for analyzing an unknown material as a blend of known materials calculated so as to match certain analytical data and predicting properties of the unknown based on the calculated blend
  • Method for analyzing an unknown material as a blend of known materials calculated so as to match certain analytical data and predicting properties of the unknown based on the calculated blend
  • Method for analyzing an unknown material as a blend of known materials calculated so as to match certain analytical data and predicting properties of the unknown based on the calculated blend

Examples


example 1

[0154] Example 1 uses the method of U.S. Pat. No. 6,662,116 B2 with separate tolerances for the fit to the FT-IR spectrum, and the API Gravity and viscosity inspection inputs.

[0155] A Virtual Assay library was generated using FT-IR spectra of 562 crude oils, condensates and atmospheric resids, and 10 acetone contaminant spectra. Spectra were collected at 2 cm−1 resolution. Samples were maintained at 65° C. during the measurement. Data in the 4685.2-3450.0, 2238.0-1549.5 and 1340.3-1045.2 cm−1 spectral regions were used in the analysis. The spectra are orthogonalized to polynomials in each spectral region to eliminate baseline effects. Five polynomial terms (quartic) are used in the upper spectral region, and 4 polynomial terms (cubic) in the lower two spectral regions. The spectra are also orthogonalized to water difference spectra that are smoothed to minimize introduction of spectral noise, and to water vapor spectra. These corrections minimize the sensitivity of the analysis to ...

example 2

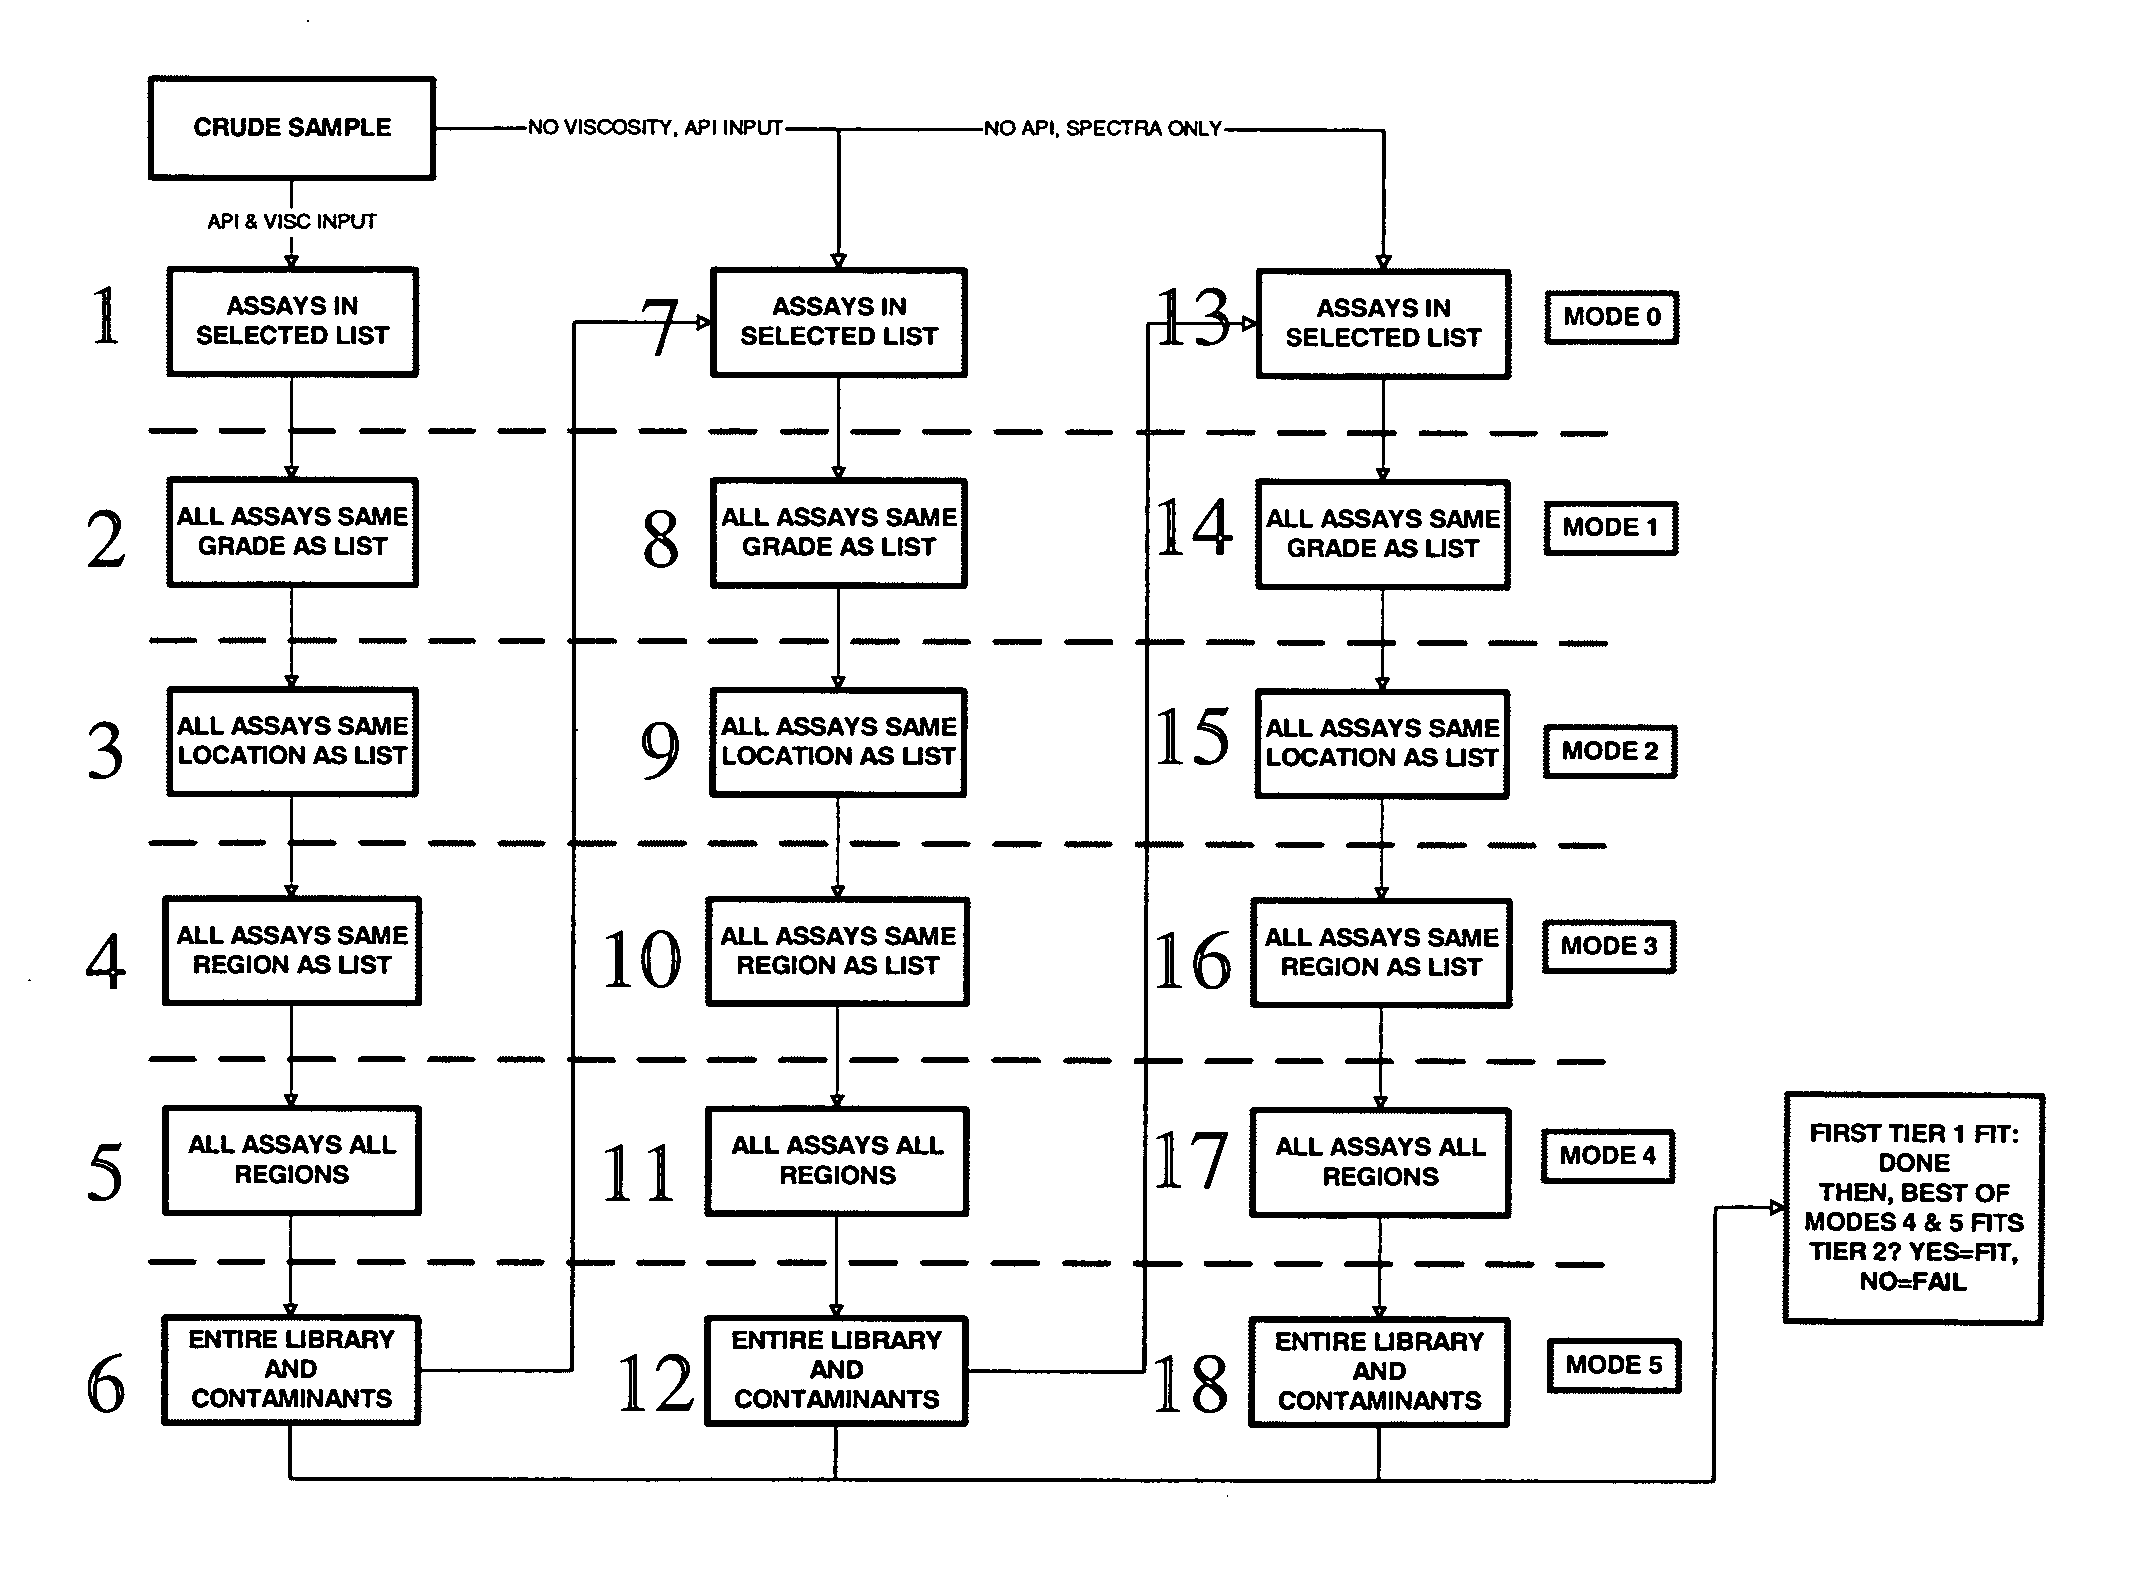
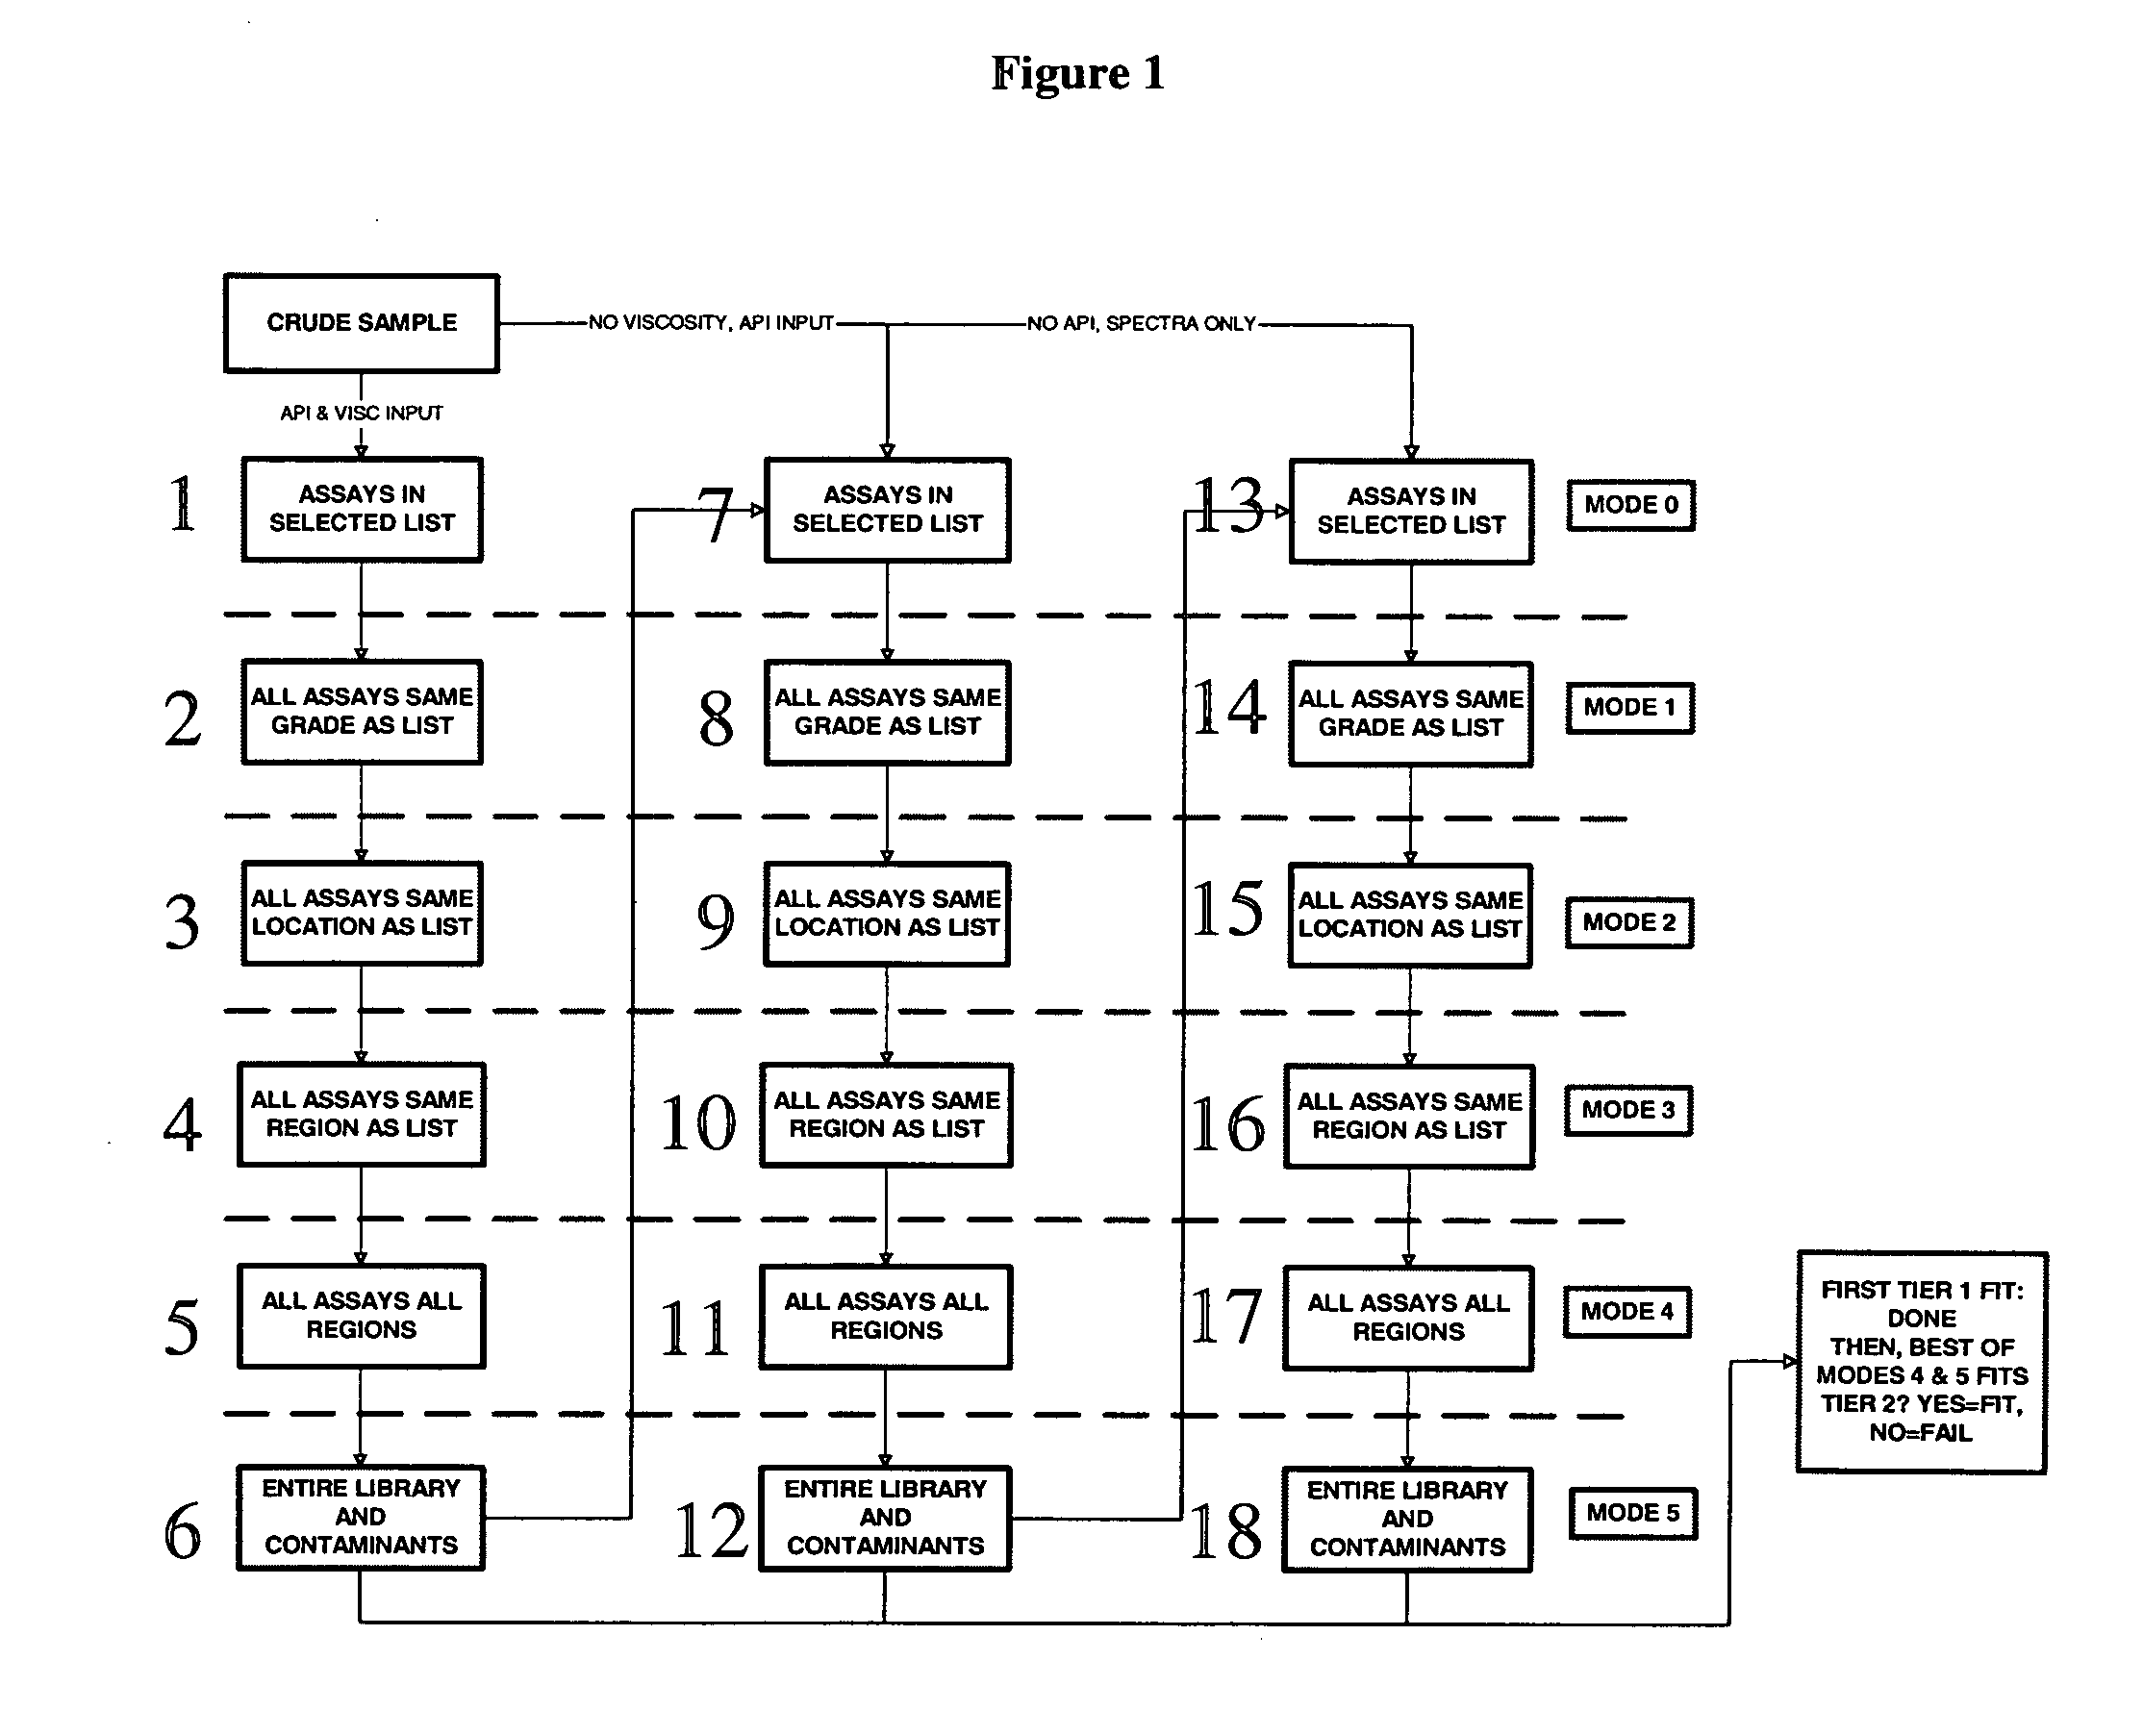
[0159] For Example 2, the same data as was used in Example 1 is again used, but in this case the method of the current invention is employed to balance the relative prediction power of analyses made using different inspection inputs. Future, analyses are conducted using the Grade / Location / Region / All Crudes iteration scheme.

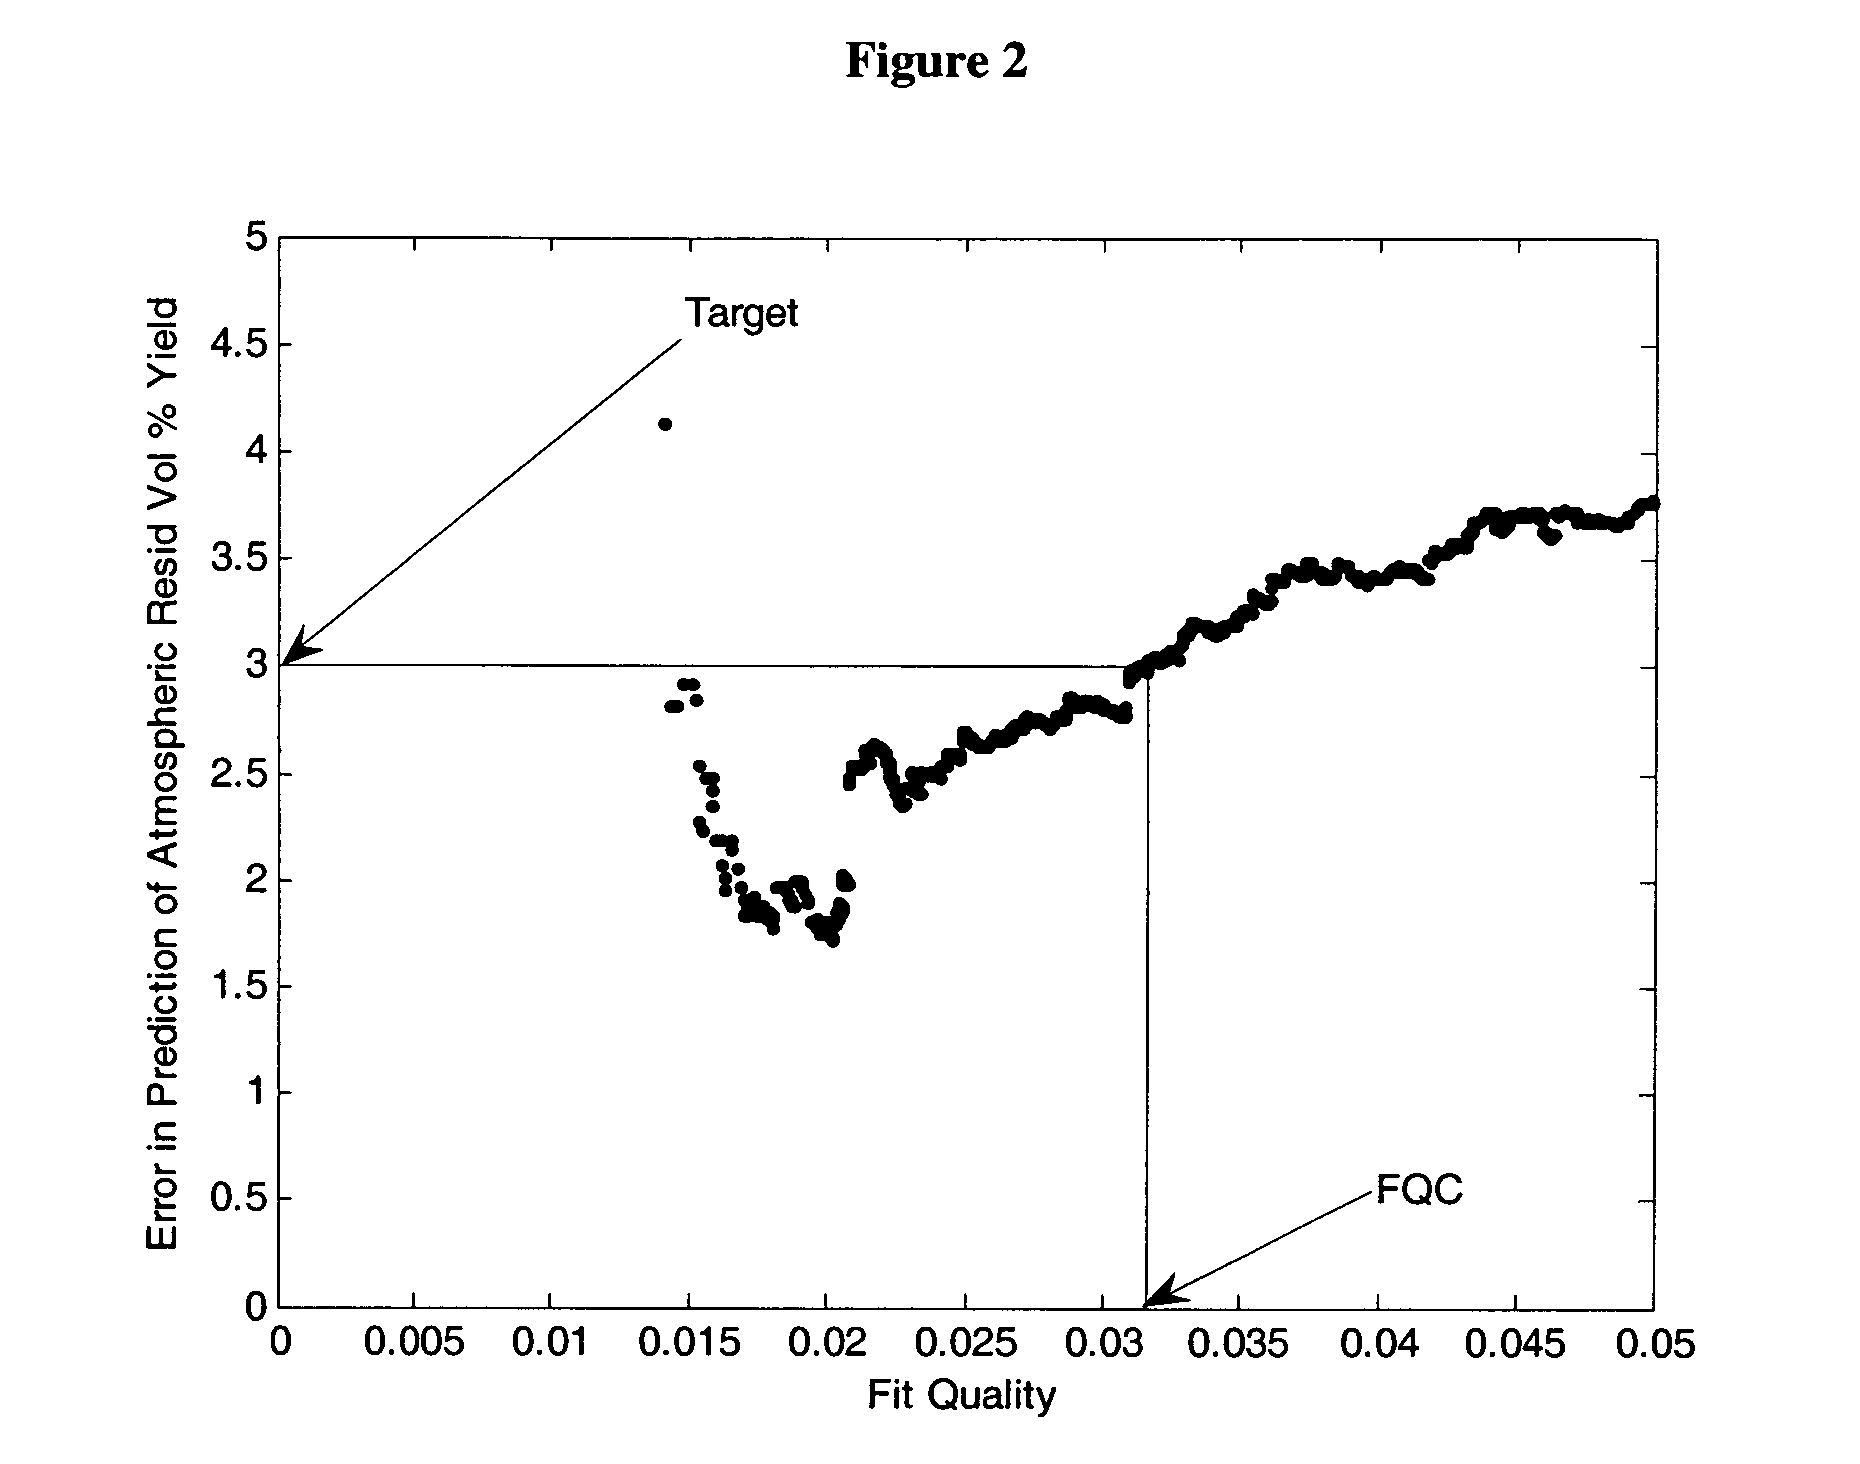
[0160] For the analysis using FT-IR only, the FQC is set such that the error (t·SECV) in the prediction of the atmospheric resid yield is approximately 3 volume percent. A “same grade” cross-validation analysis is conducted limiting the references used to crudes of the same grade as the crude left out for analysis. 312 crudes in the library can be analyzed in this fashion. A “same location” cross-validation analysis is repeated using crudes from the same location as the crude that is left out as references. 545 of the crudes in the library can be analyzed in this fashion. The cross-validation is repeated using crudes from the “same region” as the crude left out (...

example 3

[0166] The same data used in Examples 1 and 2 are analyzed using only FT-IR. In one case, the method of U.S. Pat. No. 6,662,116 B2 is used. In the second case, the method of the current invention is used. Cross-validation analyses are done using references of the “same grade” as the crude being analyzed, using references of the “same location”, using references of the “same region” and using “all crudes”. For the analyses conducted using the method of U.S. Pat. No. 6,662,116 B2, a R2 tolerance is set to 0.99963. For each set of cross-validation analyses, fits for which R2 is greater than or equal to this tolerance value are collected, and used to calculate prediction errors for yields and assay properties. For the cross-validation analyses conducted using the method of the current invention, a FQC value of 0.031677 is used to define Tier 1 analyses, the results for these Tier 1 analyses are collected, and used to calculate prediction errors for these same yields and assay properties...


PUM


Abstract

The current invention is an improvement to the method of U.S. Pat. No. 6,662,116 B2. Specifically, the current invention provides means for comparing the quality of property predictions made using different sets of known (reference) materials and different inspection inputs such that the most accurate prediction is obtained. Further, the current invention increases the flexibility of using viscosity data in the method of U.S. Pat. No. 6,662,116 B2.

Description

[0001] This application claims the benefit of U.S. Provisional application 60 / 604,170 filed Aug. 24, 2004.BACKGROUND OF THE INVENTION [0002] The present invention relates to a method for analyzing an unknown material using a multivariate analytical technique such as spectroscopy, or a combination of a multivariate analytical technique and inspections. In particular, the present invention relates to an improvement of such a method described in U.S. Pat. No. 6,662,116 B2. [0003] The method of U.S. Pat. No. 6,662,116 B2 can be used to estimate crude assay type data based on FT-IR spectral measurements and inspection data. However, this method does not provide a means of estimating the uncertainty on the predicted assay estimates, nor a means of comparing the accuracy of estimates made using different sets of references or different input inspections. The method of U.S. Pat. No. 6,662,116 B describes the use of a multiple correlation coefficient (R2) to measure how well the linear combi...

Claims


Application Information

Patent Timeline
IPC IPC(8): G06F19/00G01N31/00
CPCG01N33/2823G01N2021/3595G01N21/3577
Inventor BROWN, JAMES M.CHROSTOWSKI, CHAD J.
Owner BROWN JAMES M
Why Eureka
Try Eureka