Aptitude testing
- Summary
- Abstract
- Description
- Claims
- Application Information
AI Technical Summary
Benefits of technology
Problems solved by technology
Method used
Image
Examples
example 1
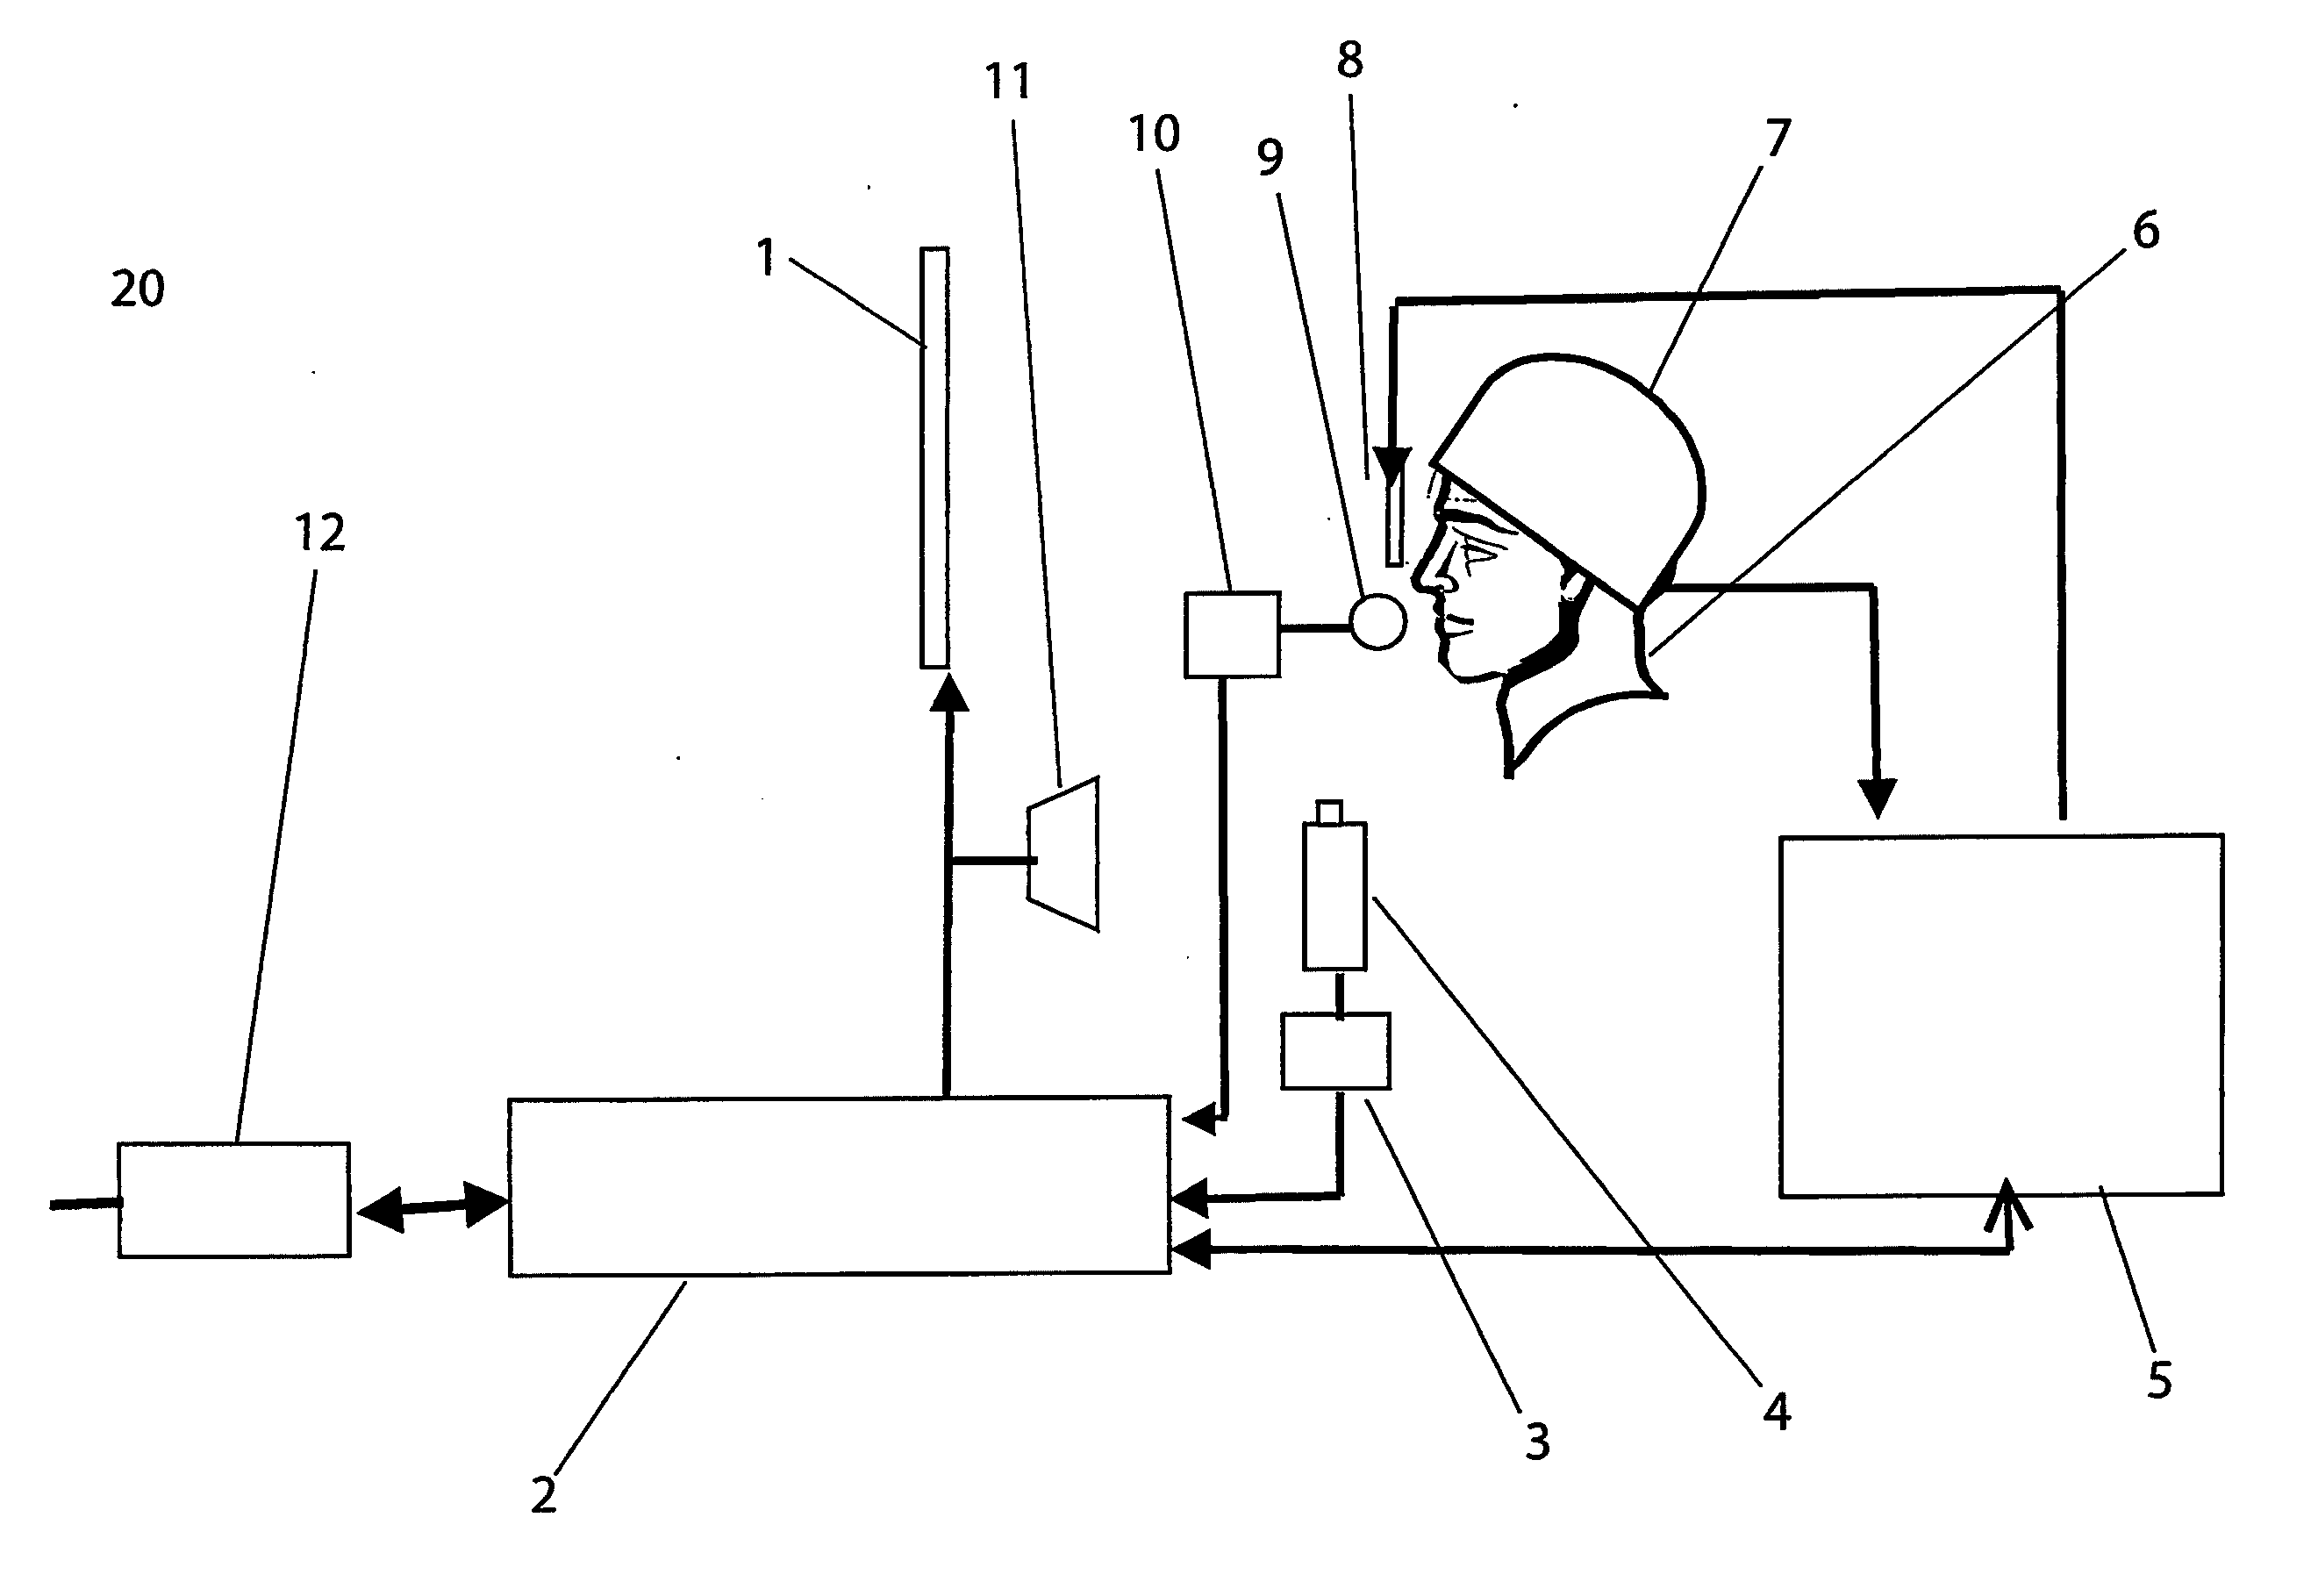
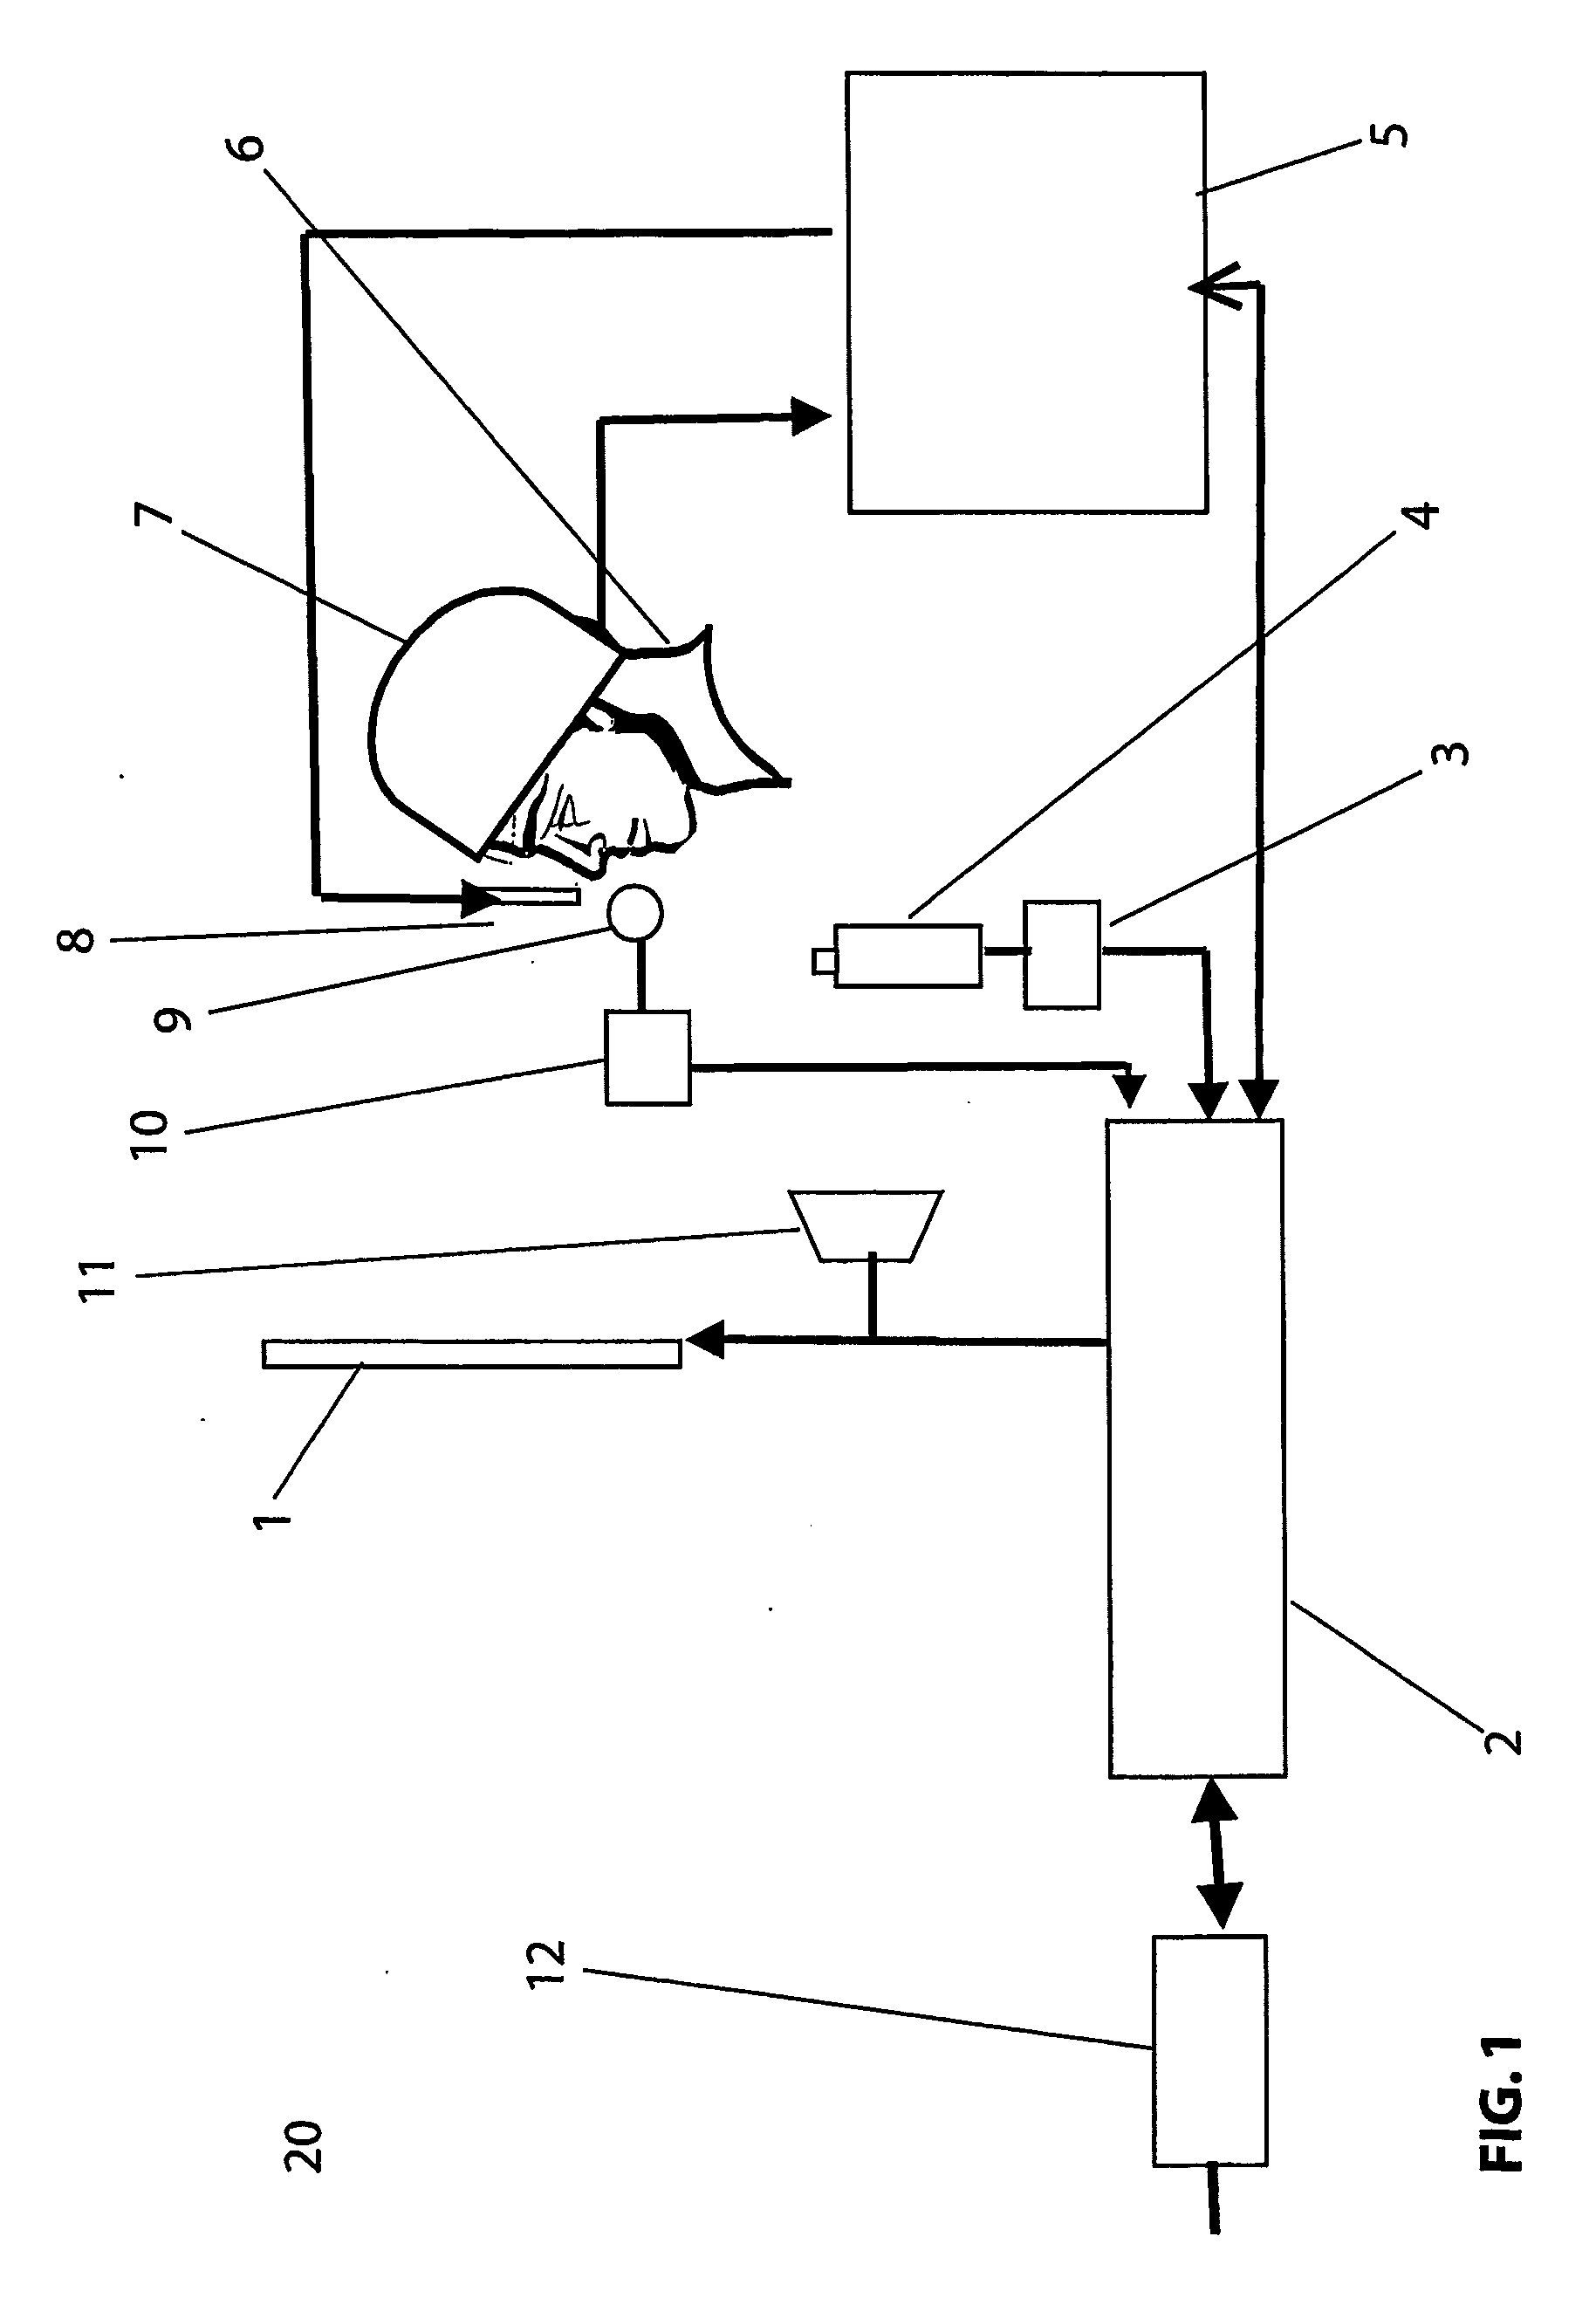
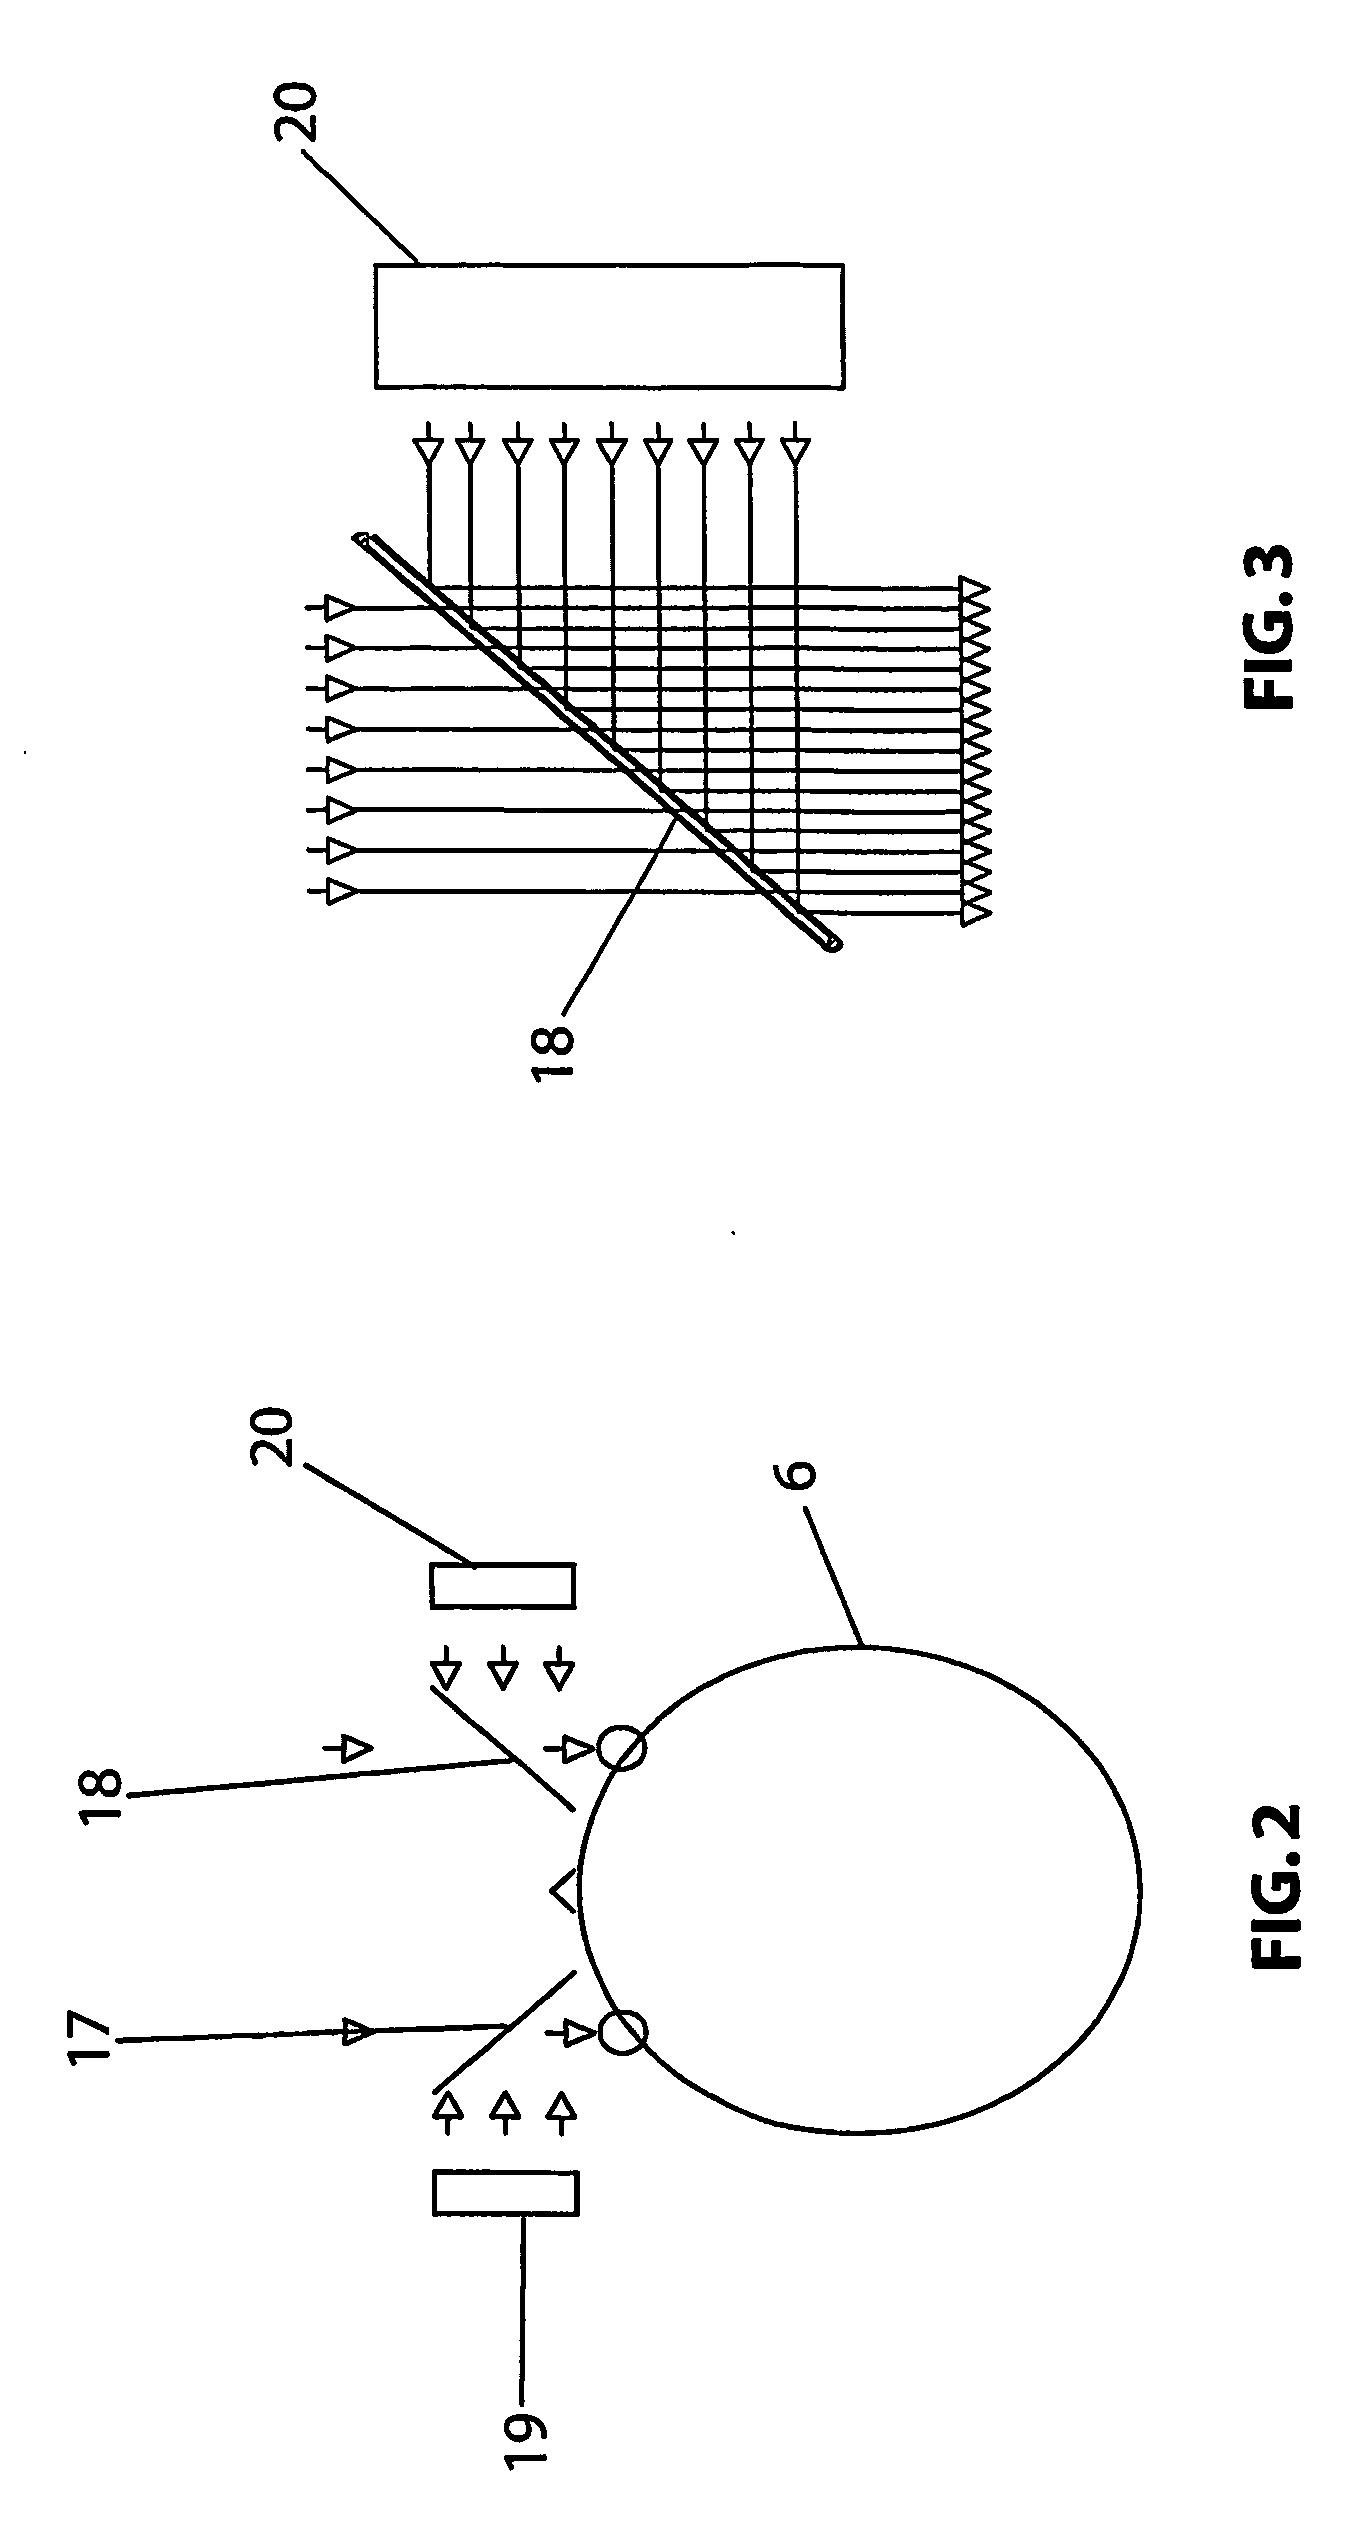
[0061] The system illustrated in FIGS. 1 to 3 was used for testing subjects using an analytical test known as the Hidden Figures Test. Data from the electrode sites was analysed using the SSPT technique based on computer algorithms listed in Equation 1.1 and the SSVEP phase distribution was displayed graphically.
[0062]FIG. 4 illustrates the SSVEP phase from a subject having high analytical aptitude. In this Figure, the lighter areas represent SSVEP phase advance or regions of increased brain processing speed. In this diagram, the darker shades represent SSVEP phase lag or regions of reduced brain processing speed. The light area 50 delineated in broken lines demonstrates and area of greater activation. This area is situated in the posterior left hemisphere in the region of the temporal and parietel cortex. This indicates that the subject has a high analytical aptitude.
[0063]FIG. 5 graphically represents the SSVEP phase distribution for a subject carrying out the same test. It will...
example 2
[0064] The same equipment was used as in Example 1 above but the subjects were made to perform the Gestalt Completion Test. The Gestalt Completion Test places demands on holistic thinking. Electrical activity from the electrode sites was analysed using the SSPT technique based on computer algorithms listed in Equation 1.1 and the results displayed graphically.
[0065]FIG. 6 diagrammatically shows SSVEP phase distribution. The results include a light area 52 bounded by broken lines. This light area demonstrates increased activity in the right temporal and right frontal areas which is consistent with the importance of right hemisphere activity in holistic recognition. This is interpreted as indicating that the subject has high holistic thinking ability.
[0066]FIG. 7 in contrast shows the results of a subject performing the same test for a subject having low holistic thinking abilities. The SSVEP phase distribution shows reduced left temporal activity and enhanced left parietal, left po...
example 3
[0067] The system shown in FIGS. 1 to 3 was used to test subjects carrying out a computerised version of Raven's Progressive Matrices. Electrical activity was again processed using the SSPT technique based on computer algorithms listed in Equation 1.8. The results are displayed graphically in FIGS. 8 and 9.
[0068] The graph of FIG. 8 shows event related SSVEP coherence between activity recording sites 56. The display includes a plurality of lines 58 between frontal sites. This result was produced from statistically significant differences in event related SSVEP coherence recorded from participants having high verbal IQ scores.
[0069]FIG. 9 graphically illustrates statistically significant differences in event related SSVEP coherence recorded from participants having high conceptual and visualisation skills (performance IQ). The results graphically shown in FIG. 9 include lines 60 demonstrating increased event related SSVEP coherence between right parieto-temporal regions and other s...
PUM
 Abstract
Description
Claims
Application Information
 - R&D
- Intellectual Property
- Life Sciences
- Materials
- Tech Scout
- Unparalleled Data Quality
- Higher Quality Content
- 60% Fewer Hallucinations
Browse by: Latest US Patents, China's latest patents, Technical Efficacy Thesaurus, Application Domain, Technology Topic, Popular Technical Reports.
© 2025 PatSnap. All rights reserved.Legal|Privacy policy|Modern Slavery Act Transparency Statement|Sitemap|About US| Contact US: help@patsnap.com


