Method and system for visualizing network performace characteristics

a network performance and performance characteristic technology, applied in the computer field, can solve the problems of aggressive active agents, ineffective cache servers, and long time-consuming monitoring, and achieve the effects of reducing or eliminating serious network effects, avoiding over-use of network resources, and improving overall network operations

Inactive Publication Date: 2006-10-26
COMP ASSOC THINK INC
View PDF7 Cites 44 Cited by
  • Summary
  • Abstract
  • Description
  • Claims
  • Application Information

AI Technical Summary

Benefits of technology

[0054] The disclosed subject matter may provide the ability to determine a network violation at some period before it occurs. In such case, there may be the ability to respond to an indicator change and, thereby, take preemptive action that could reduce or eliminate serious network effects. Such preemptive action may include avoiding over-use of network resources or timing of excessive network loading to occur at more optimal times.
[0055] In yet a further embodiment of the disclosed subject matter, there is the ability to associate a plurality of server or network print plots. It may be possible to categorically identify the different violations that occur by viewing a broad array of server or network print plots. Upon categorically identifying such violations, based on the server or network print plots, the disclosed server or network print plots may provide insights into how to categorically eliminate network violations or out of range conditions. By categorically eliminating problems, based on the characteristic server or network print plots that such problems generate, the disclosed subject matter may very significantly improve overall network operations.
[0056] Moreover, by creating and diagnosing categories of server or network print plots, the present embodiment may suggest correlations between different categories of network conditions that generate characteristic server print plots. By responding to server or network print plot data, even prior to an out of range condition arising, the disclosed subject matter may even more significantly improve overall network performance.
[0057] On an even larger scale, by associating categories of server or network print plots from various points of a network system, the disclosed subject matter may provide real-time data for assisting in the diagnosis of network problems at many different levels. Thus, in addition to providing comparisons of real time visualizations of computer network 12 performance, the disclosed subject matter allows for the aggregation of statistics over longer periods of time. Such aggregations enable trend analyses for both longer term and larger scale performance management functions. For example, FIGS. 10 and 11 display overall network exception status information for a particular computer network 12. Although the information presented by FIGS. 10 and 11 is the same in the example, the two plots appear in different forms.

Problems solved by technology

These infrastructure monitors have been around for a long time.
The use of end-to-end performance monitoring appliances has uncovered serious inefficiencies with load balancers, poorly designed applications, bypassed proxy servers, ineffective cache servers, aggressive active agents, and badly designed “redundant” networks.
Because they continuously monitor applications, such appliances notice and report even difficult intermittent issues that cannot readily be reproduced.
Unfortunately, known end-to-end performance monitoring and management systems fail to provide completely satisfactory operation.
The main problem with this approach is that it can be difficult or impossible to get the agents installed and keep them operating.
For a global network, the number of agents can be significant; installation can be slow and maintenance painful.
For an eCommerce site, installation of the agents is not practical; requesting potential customers to install software on their computers probably would not meet with much success.
A secondary issue with this approach is that each of the client-site agents must upload their measurements to a centralized management platform; this adds unnecessary traffic on what may be expensive wide-area links.
A third issue with this approach is that it is difficult to accurately separate the network from server delay contributions.
There are two main problems with this approach.
The other is that the monitoring does not generally cover the full range of client sites—the monitoring is limited to where the service provider has installed agents.

Method used


Image

  • Method and system for visualizing network performace characteristics
  • Method and system for visualizing network performace characteristics
  • Method and system for visualizing network performace characteristics

Examples


Embodiment Construction

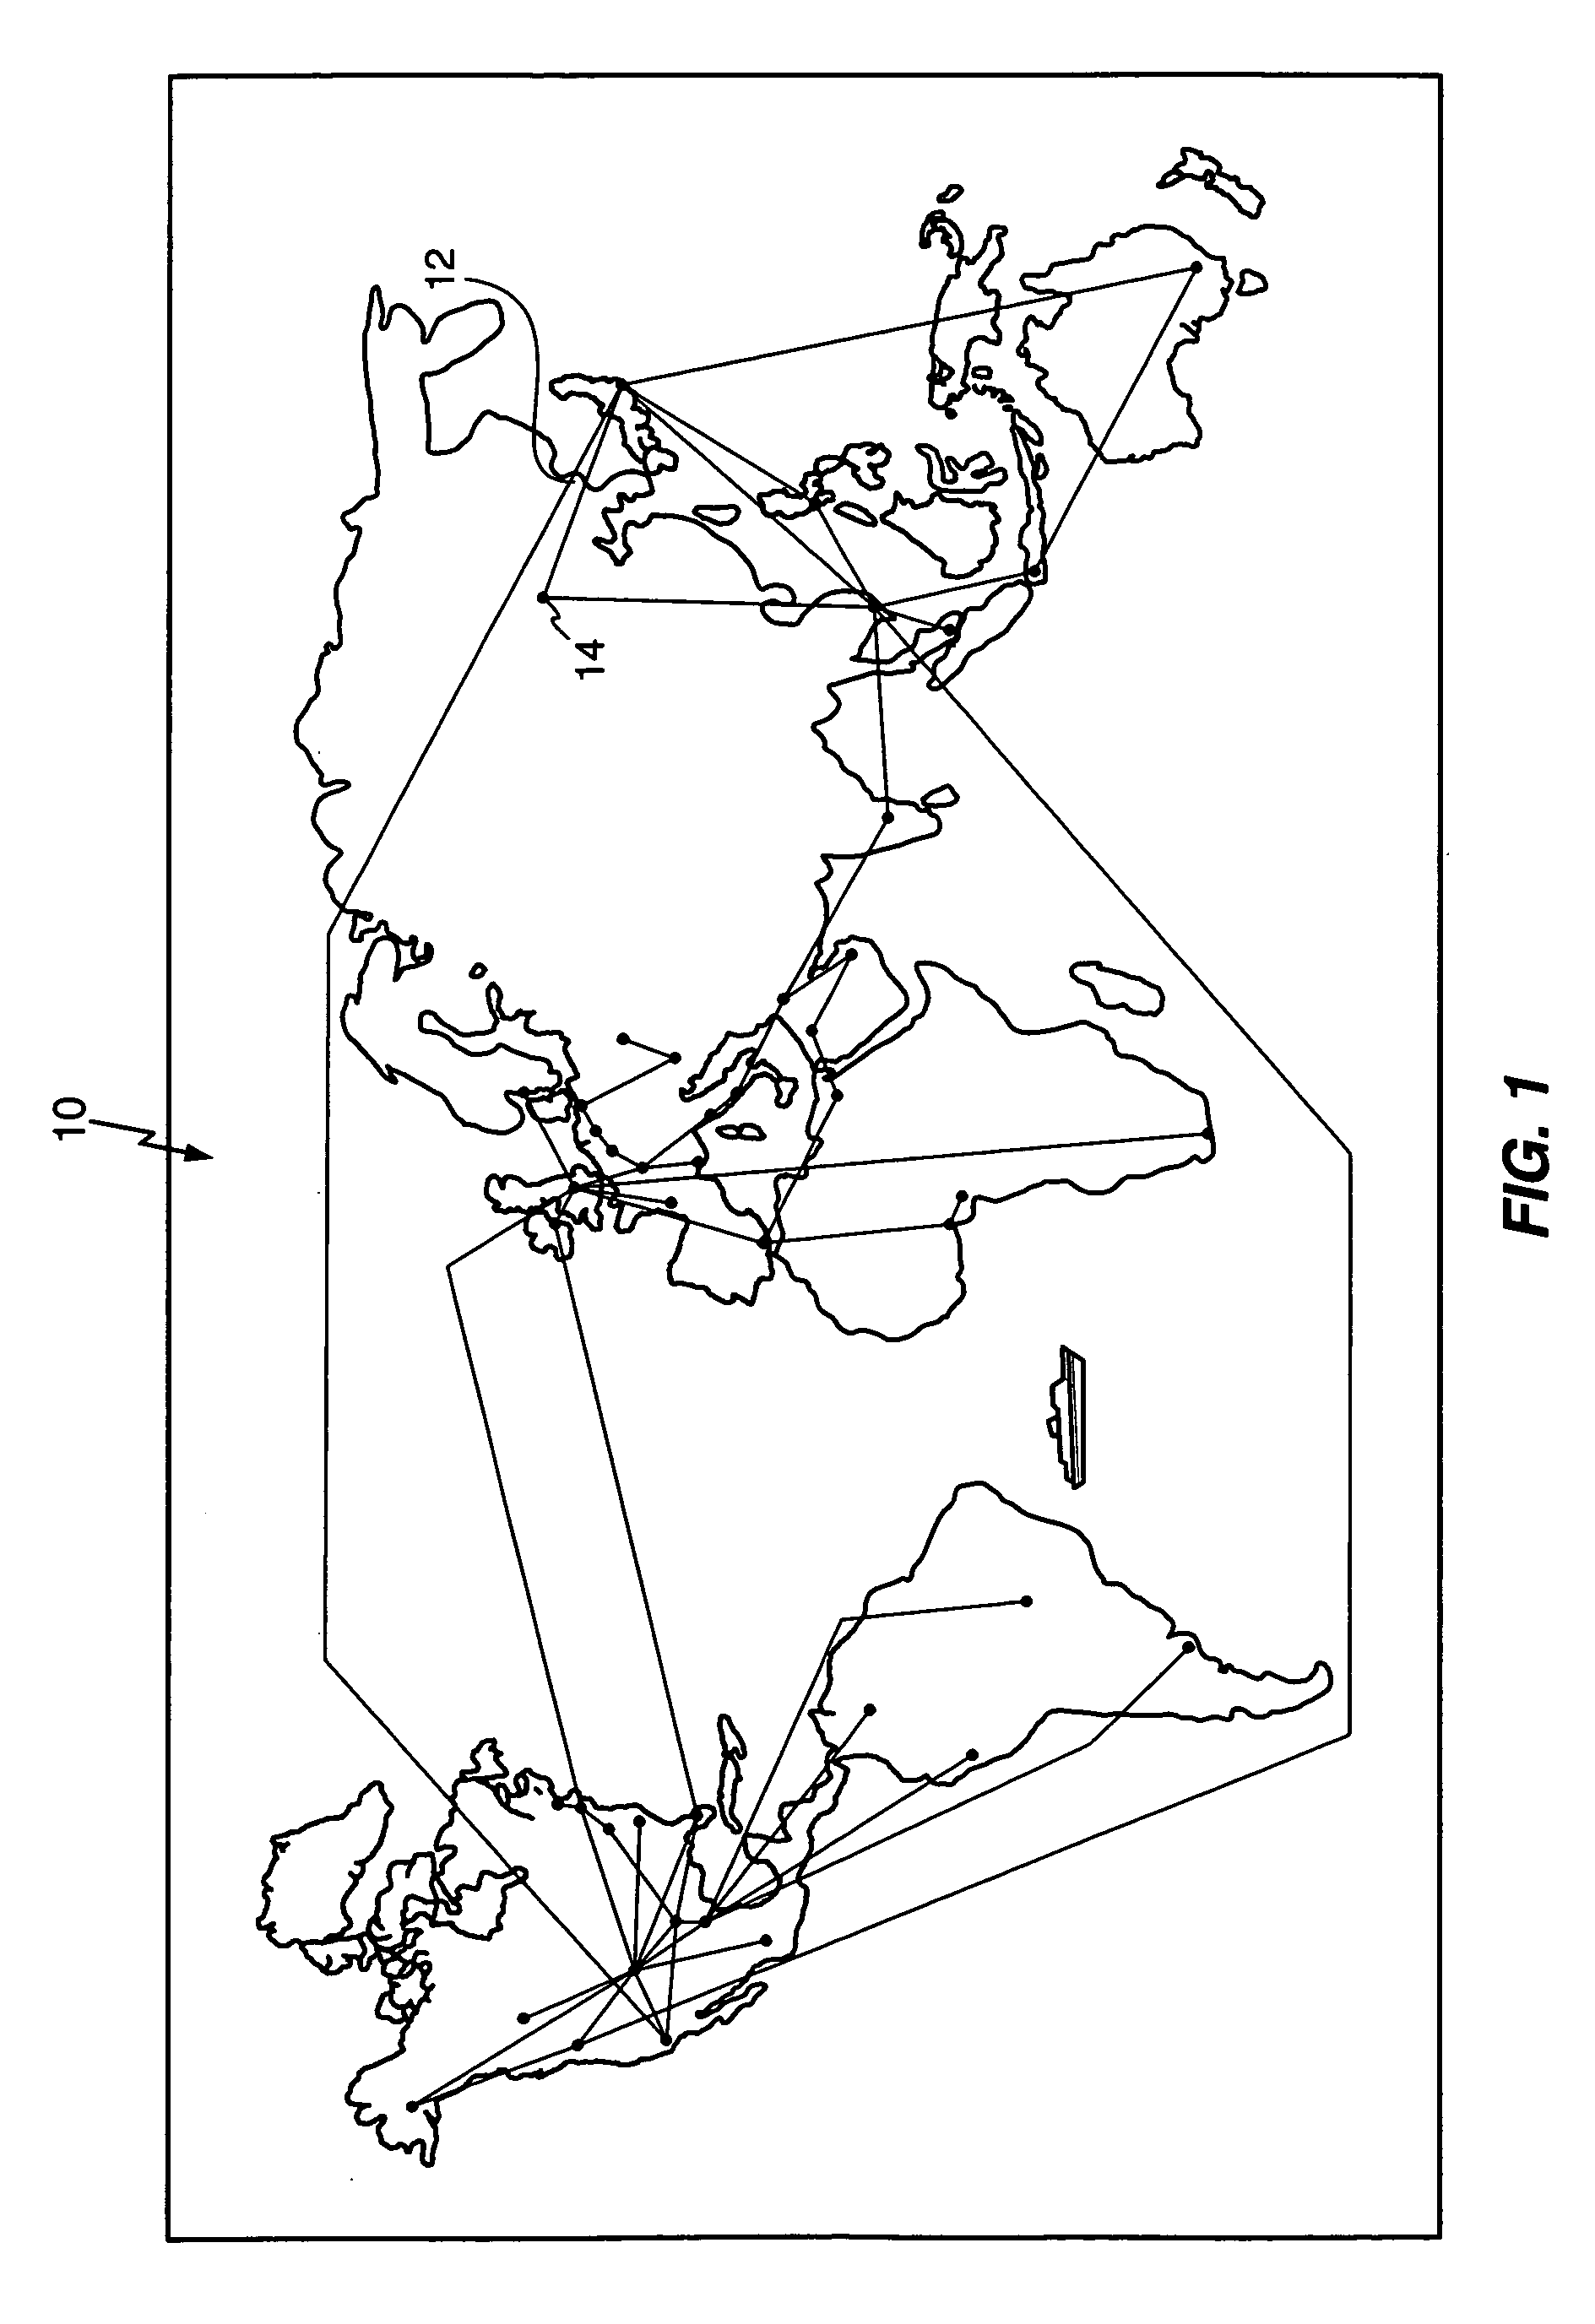
[0025]FIG. 1 shows geographically a computer network that spans the globe and to which the teachings of the disclosed subject matter may apply. Across the globe 10, a computer network 12, which may actually include an association of many networks, communicates connects different sites 14 to one another. In such a computer network, addressing performance changes arising from new application deployments, determining how best to satisfy near future network and user needs, and performing proactive and reactive trouble shooting all require network managers and technicians a variety of performance management functions. These performance management functions must resolve how network managers respond to problems as they arise.

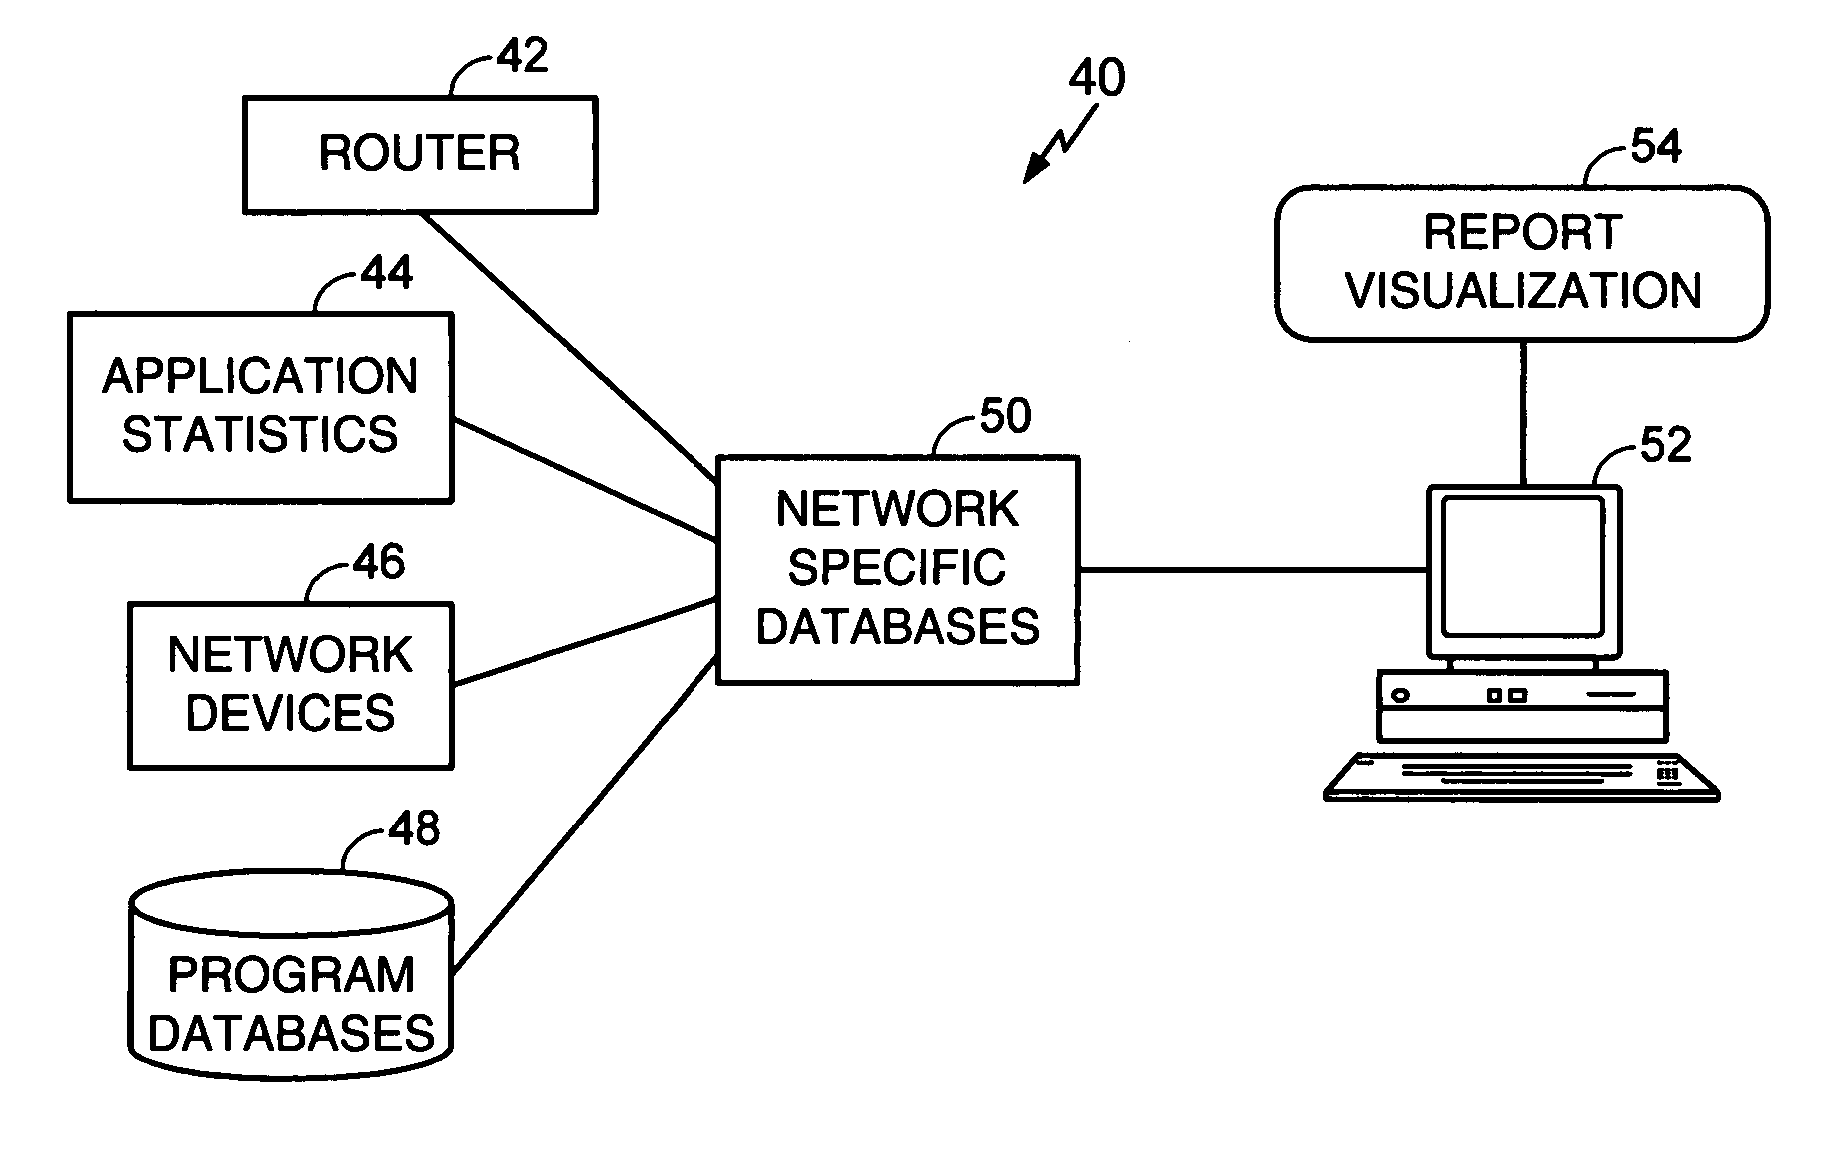
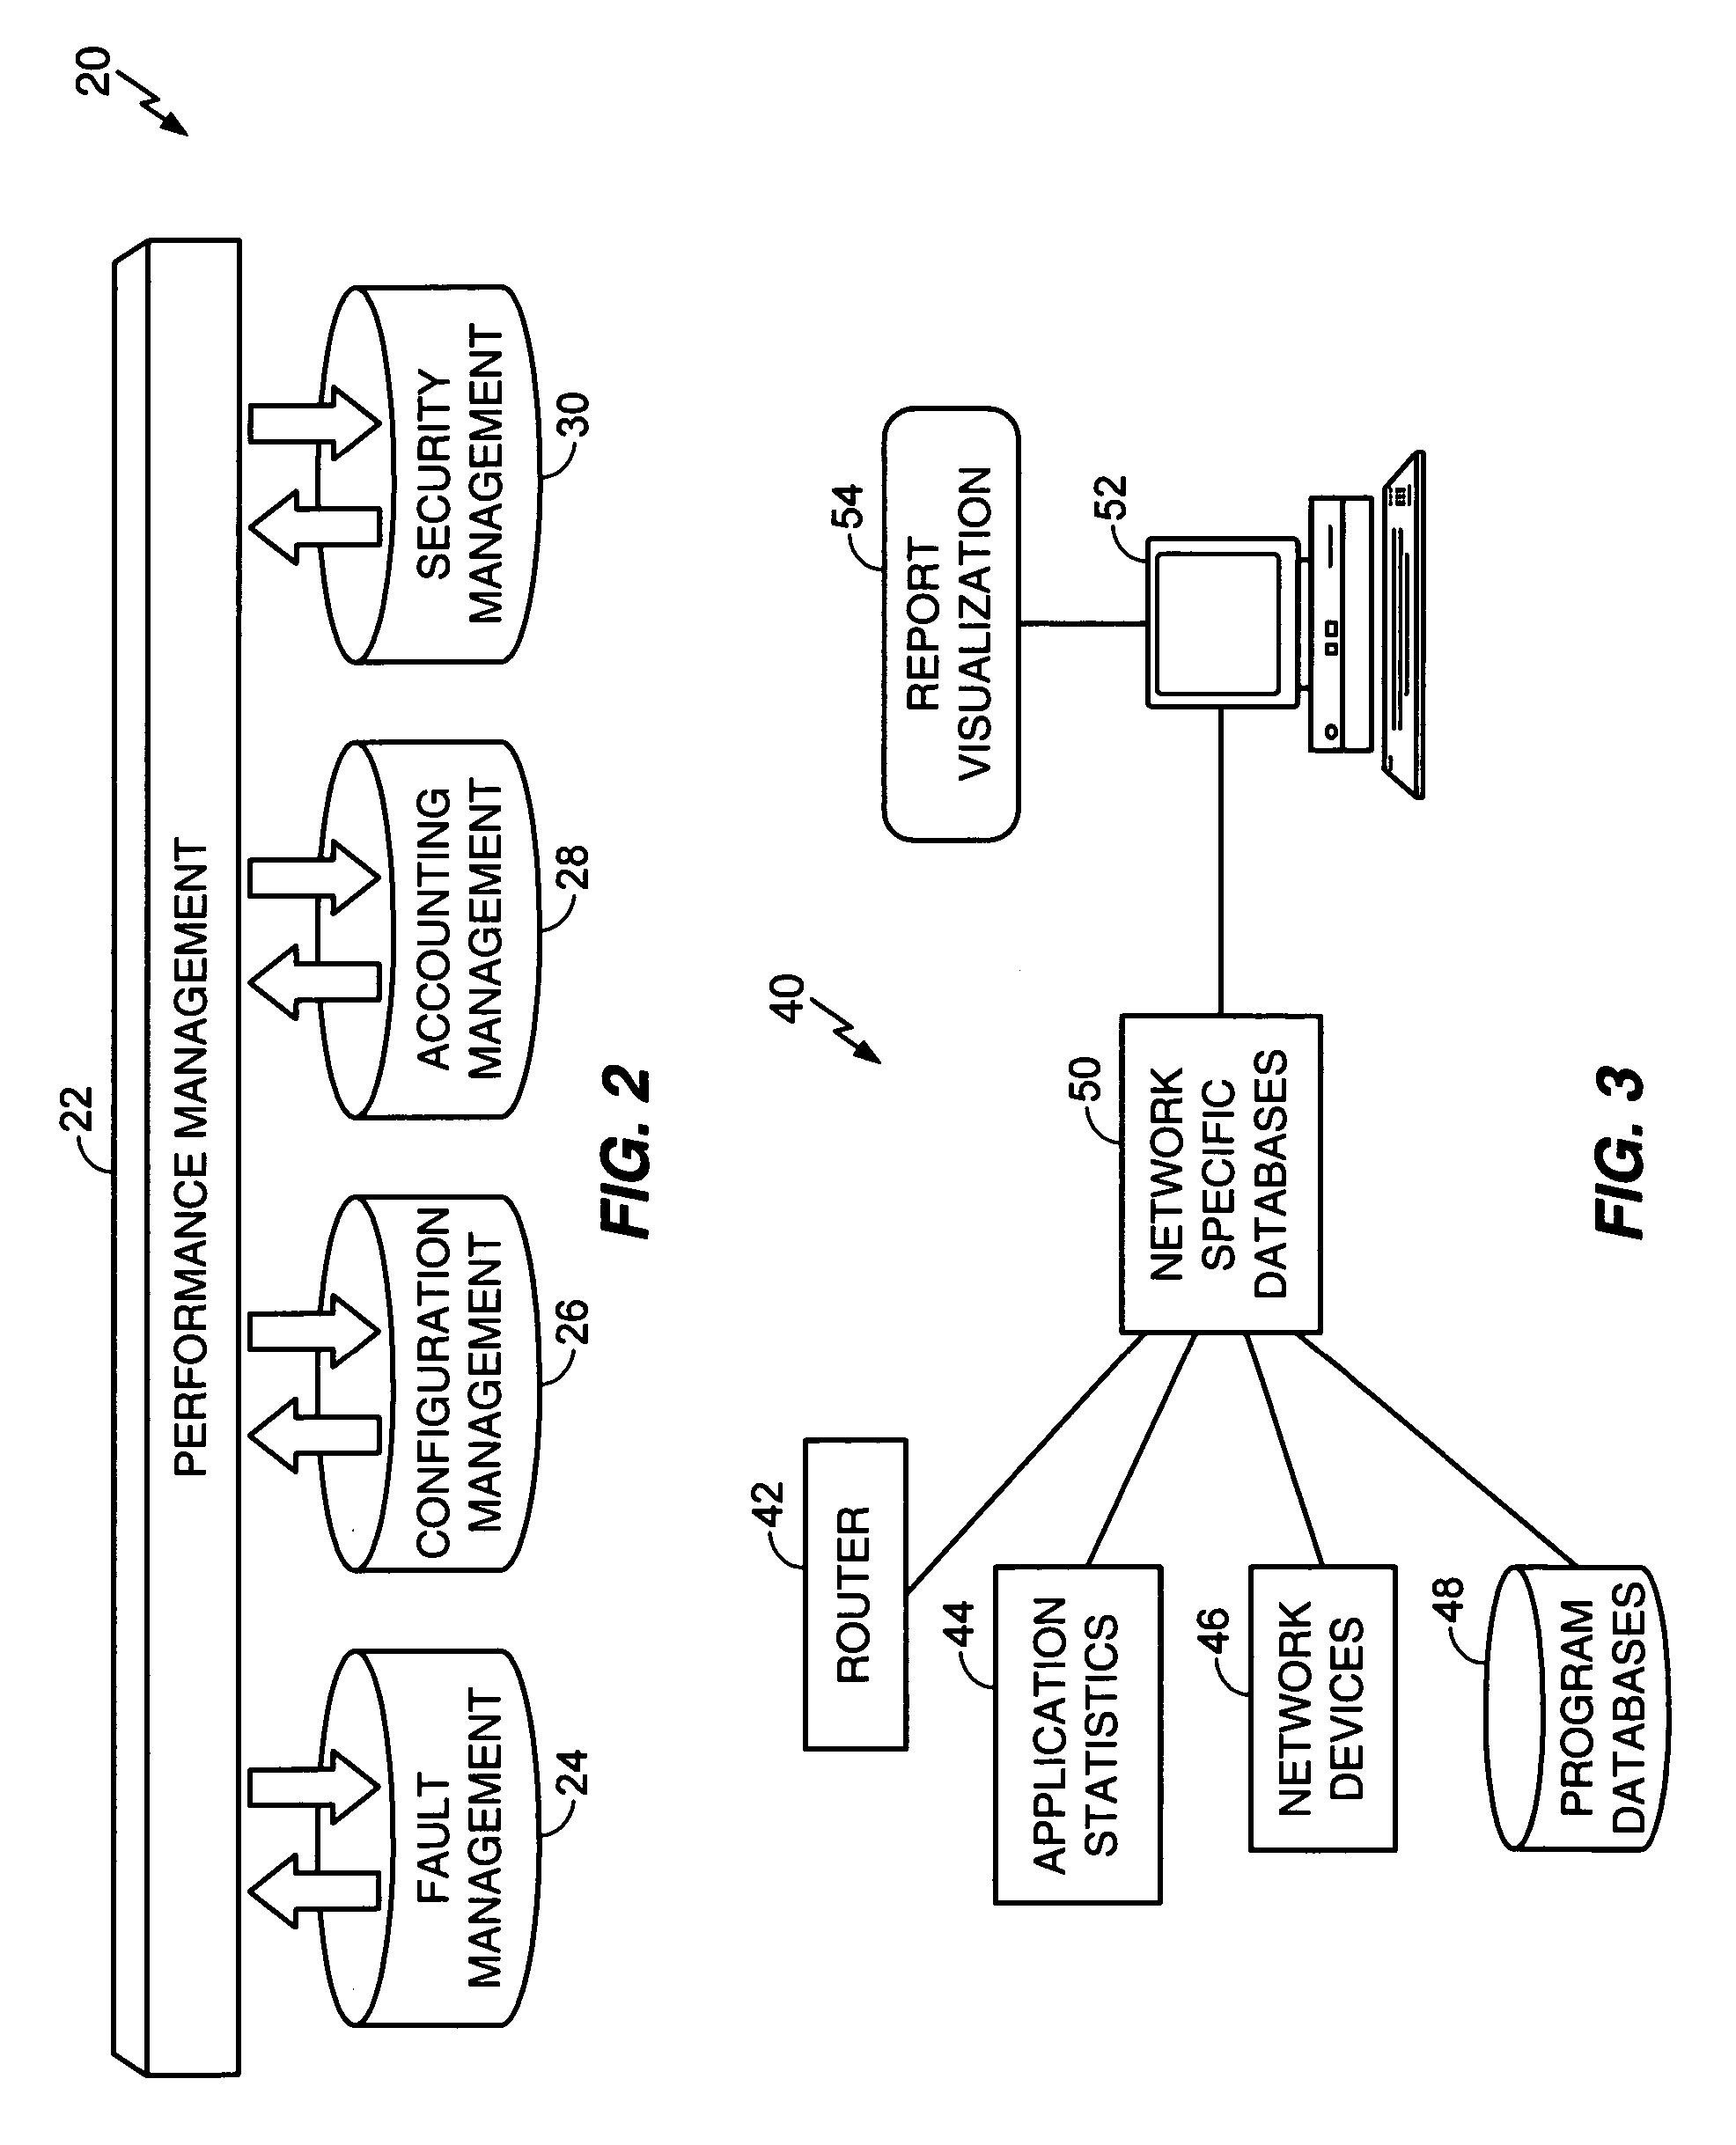
[0026]FIG. 2 shows, therefore, shows computer network performance environment 20. Computer network performance environment 20 includes performance management functions 22, which communicate and interoperate with fault management functions 24, configuration management ...


PUM


Abstract

Techniques for visualizing and monitoring the quality of service for a computer network. Herein, a method and system monitor network transactions and behaviors for the computing network, which computing network includes one or more client subnets accessing one or more servers, The monitoring may be independent of client site monitors. Statistical data is gathered for relating to at least the network, the server, and the applications for generating a plurality of measurements. The measurements assess at least one quality of service indicator associated with the performance of the computer network. The method and system graphically display the plurality of measurements of the quality of service indicator according to the date and time of gathering the statistical data and further display graphically the degree by which each of the measurements of the quality of service indicator varies from a predetermined threshold quality of service level for the computing network. Also, dynamic quality of service indicators are monitored against average quality of service indicators.

Description

FIELD [0001] The disclosed subject matter relates to computer and related electronic systems networks. More particularly, this disclosure relates to a novel and improved method and system for visualizing network performance characteristics. DESCRIPTION OF THE RELATED ART [0002] Most network engineers are very familiar with tools that report statistics on individual components such as links, routers, and servers. These infrastructure monitors have been around for a long time. Newer to the market are performance monitoring appliances that report end-to-end statistics and the end-user experience. These appliances provide a comprehensive view of the enterprise, without the need for desktop or server agents. They measure how well response time Service Level Agreements (SLAs) are being met. They also help solve a wide variety of problems with solutions that lead to significant reductions in operating costs. [0003] End-to-end performance monitoring can be extremely useful as a proactive me...

Claims


Application Information

Patent Timeline
Patent Type & Authority Applications(United States)
IPC IPC(8): G06F15/173
CPCH04L41/5003H04L41/5009H04L41/5032H04L43/16H04L43/045H04L43/067H04L41/5096
Inventor MULLARKEY, PETER
Owner COMP ASSOC THINK INC
Why Eureka
Try Eureka