
Data processing method for spectrum analyzer

Active Publication Date: 2006-12-28
TEKTRONIX INC
View PDF1 Cites 17 Cited by
  • Summary
  • Abstract
  • Description
  • Claims
  • Application Information

AI Technical Summary

Benefits of technology

[0010] Accordingly, a signal analyzer, or spectrum analyzer, using FFT calculations that is able to set an equivalent VBW to obtain a result equivalent to using the analog video filter is provided. As described, the signal analyzer does not produce noise after the spectrum is produced but the result is different depending on whether the video filter is applied to a signal under test. Therefore if the video filter characteristics are applicable to the FFT signal analyzer, such as an FFT-type spectrum analyzer, it can keep compatibility with a result measured by a swept spectrum analyzer.
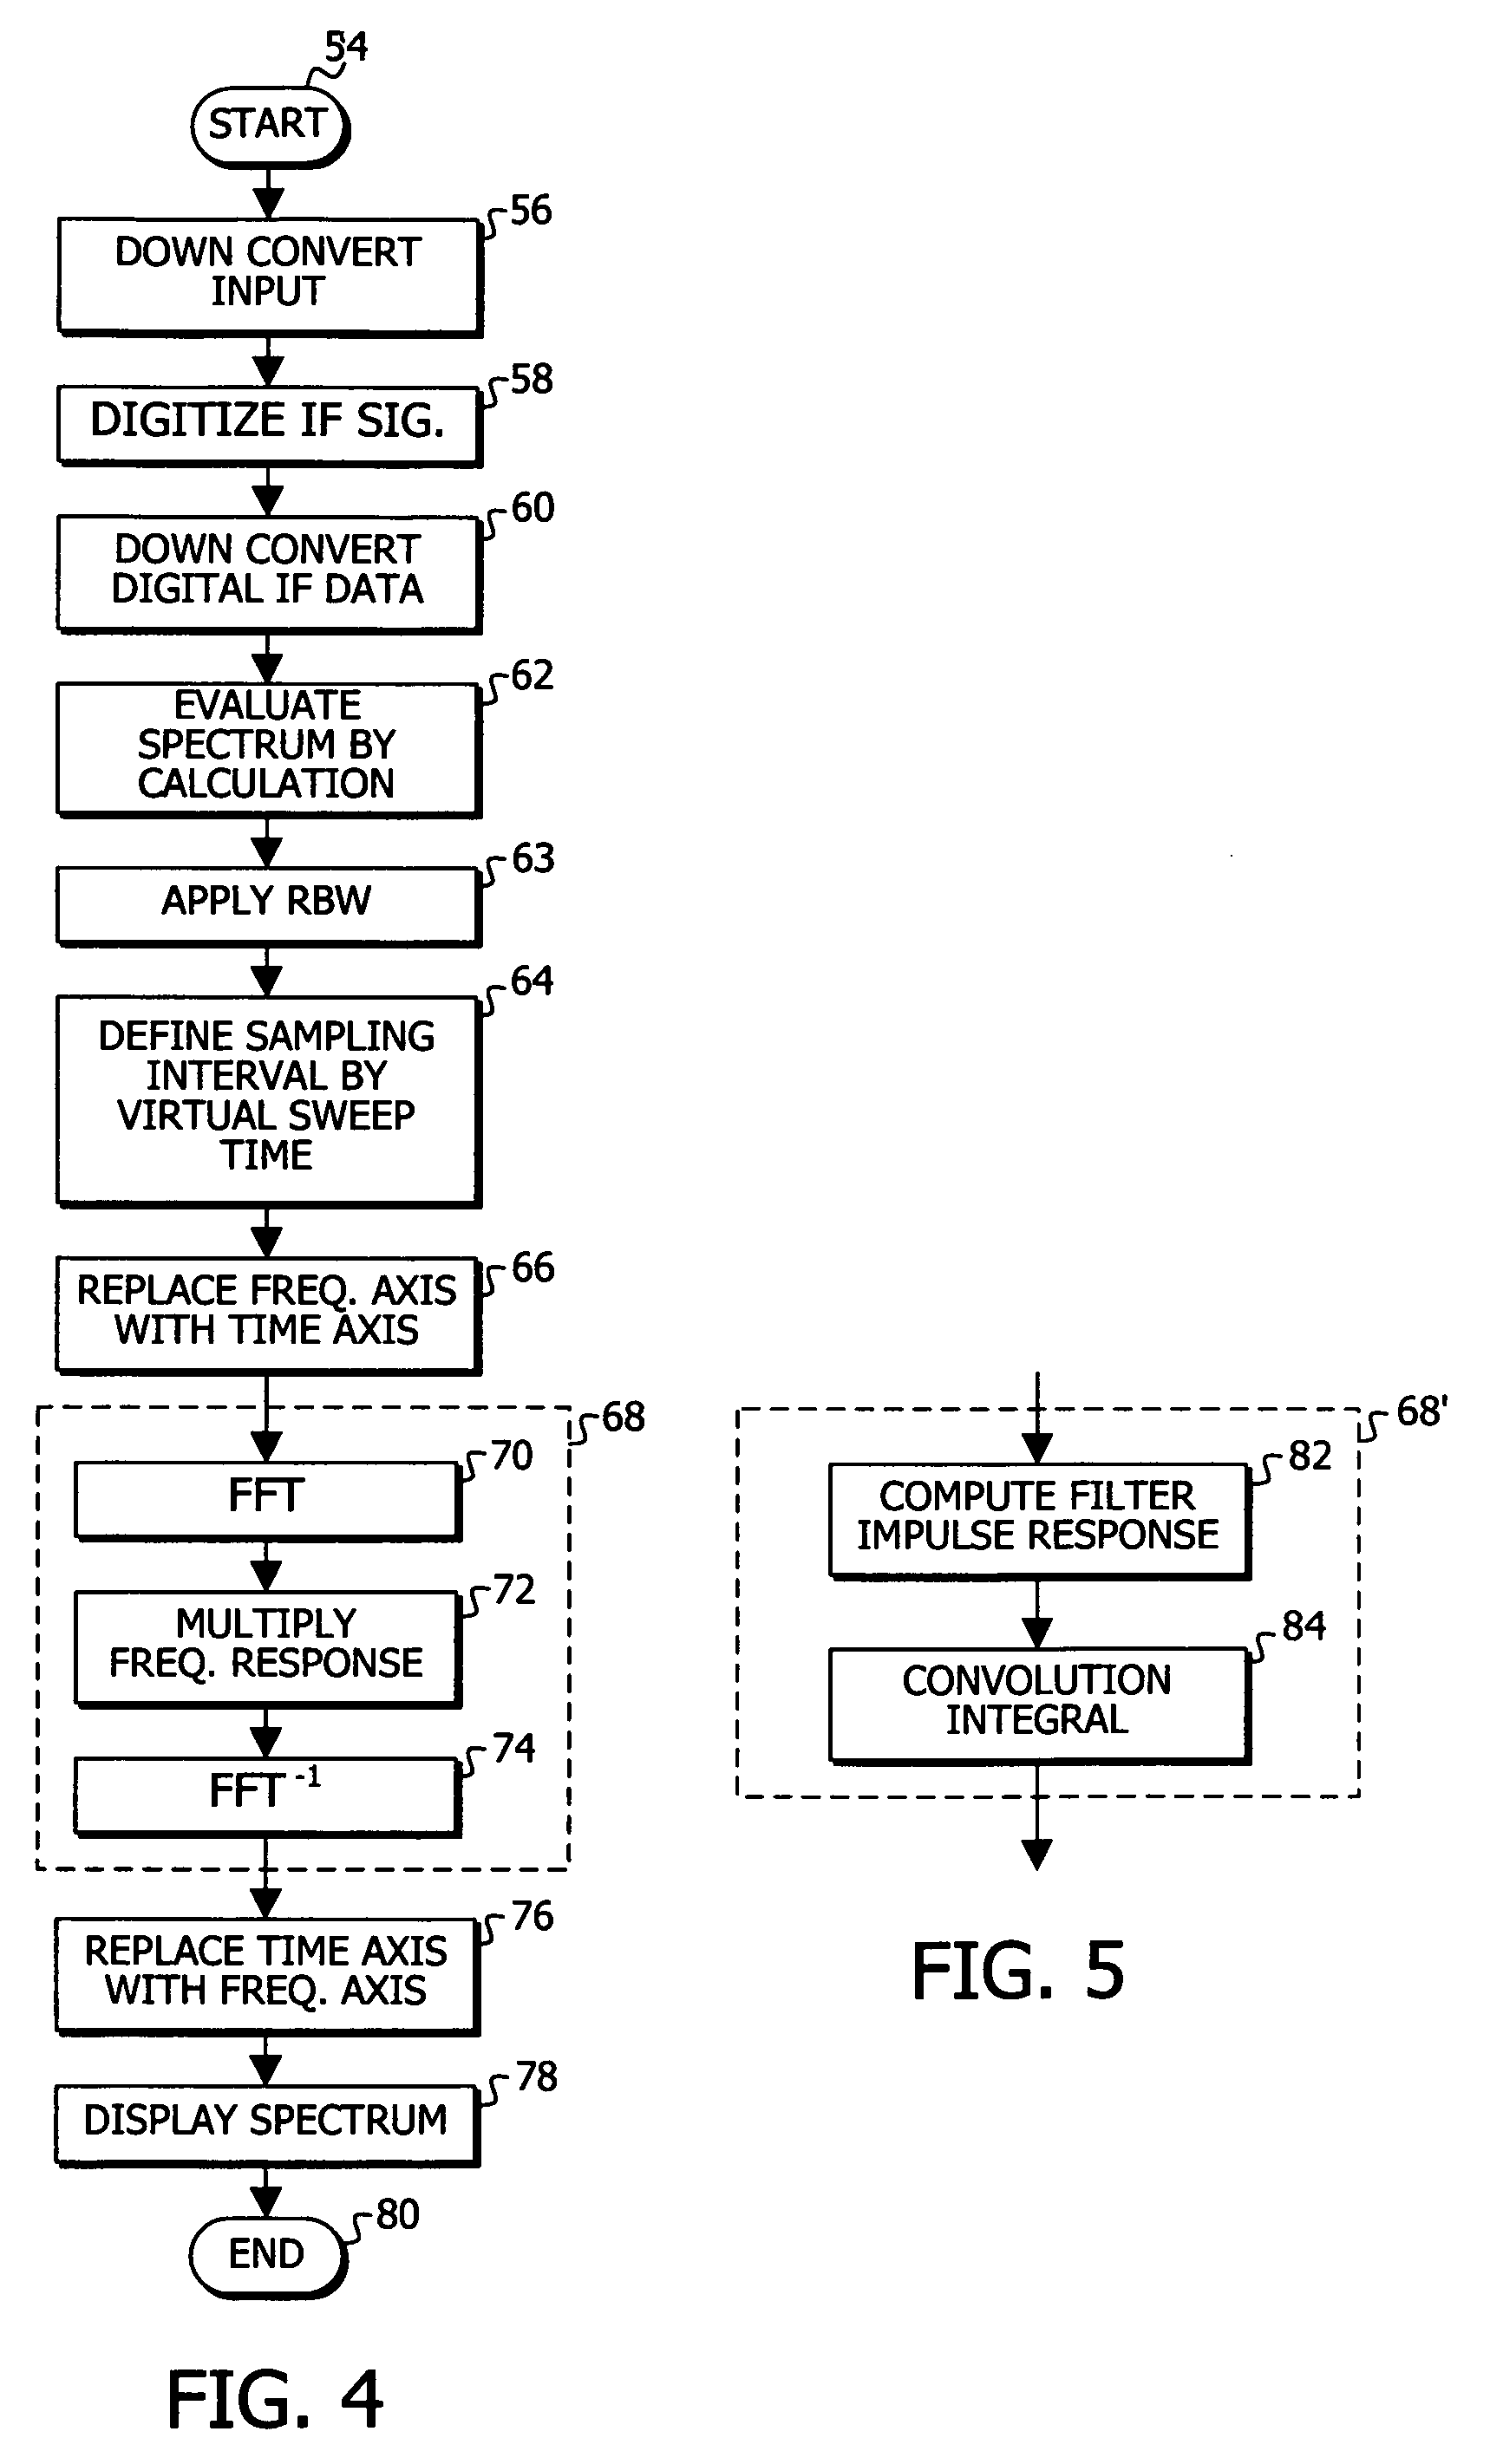
[0012] The video filter is applied to a spectrum signal that is a time function but the spectrum data that the FFT signal analyzer produces has no immediately apparent relationship between frequency and time changes, so it is necessary to define the correspondence between the frequency and time changes. Therefore the present invention replaces the frequency change of the spectrum data with the corresponding time change, and then desired filter characteristics are applied to it. In particular, a predetermined time is assigned to a frequency span to replace the frequency change of the spectrum data with the time change. The predetermined time corresponds to a sweep time as would be used in a swept spectrum analyzer and can be selected properly according to frequency span, resolution bandwidth (RBW) and video bandwidth (VBW) set by a user. A frequency span is assumed to correspond to a virtually defined sweep time and then frequency and time changes are defined to have a linear relationship so that the number N of spectrum data are deemed to be in time series. Then the spectrum data can be processed as if it were time domain data to which video filter characteristics are applied to get a result equivalent to applying the video filter.

Problems solved by technology

Under the defined measurement condition, the FFT-based spectrum analyzer, or signal analyzer, cannot replace the swept spectrum analyzer because it can not set the VBW since it has no video filter and the FFT-based analyzer cannot ensure compatibility with the swept spectrum analyzer.

Method used


Image

  • Data processing method for spectrum analyzer
  • Data processing method for spectrum analyzer
  • Data processing method for spectrum analyzer

Examples


Embodiment Construction

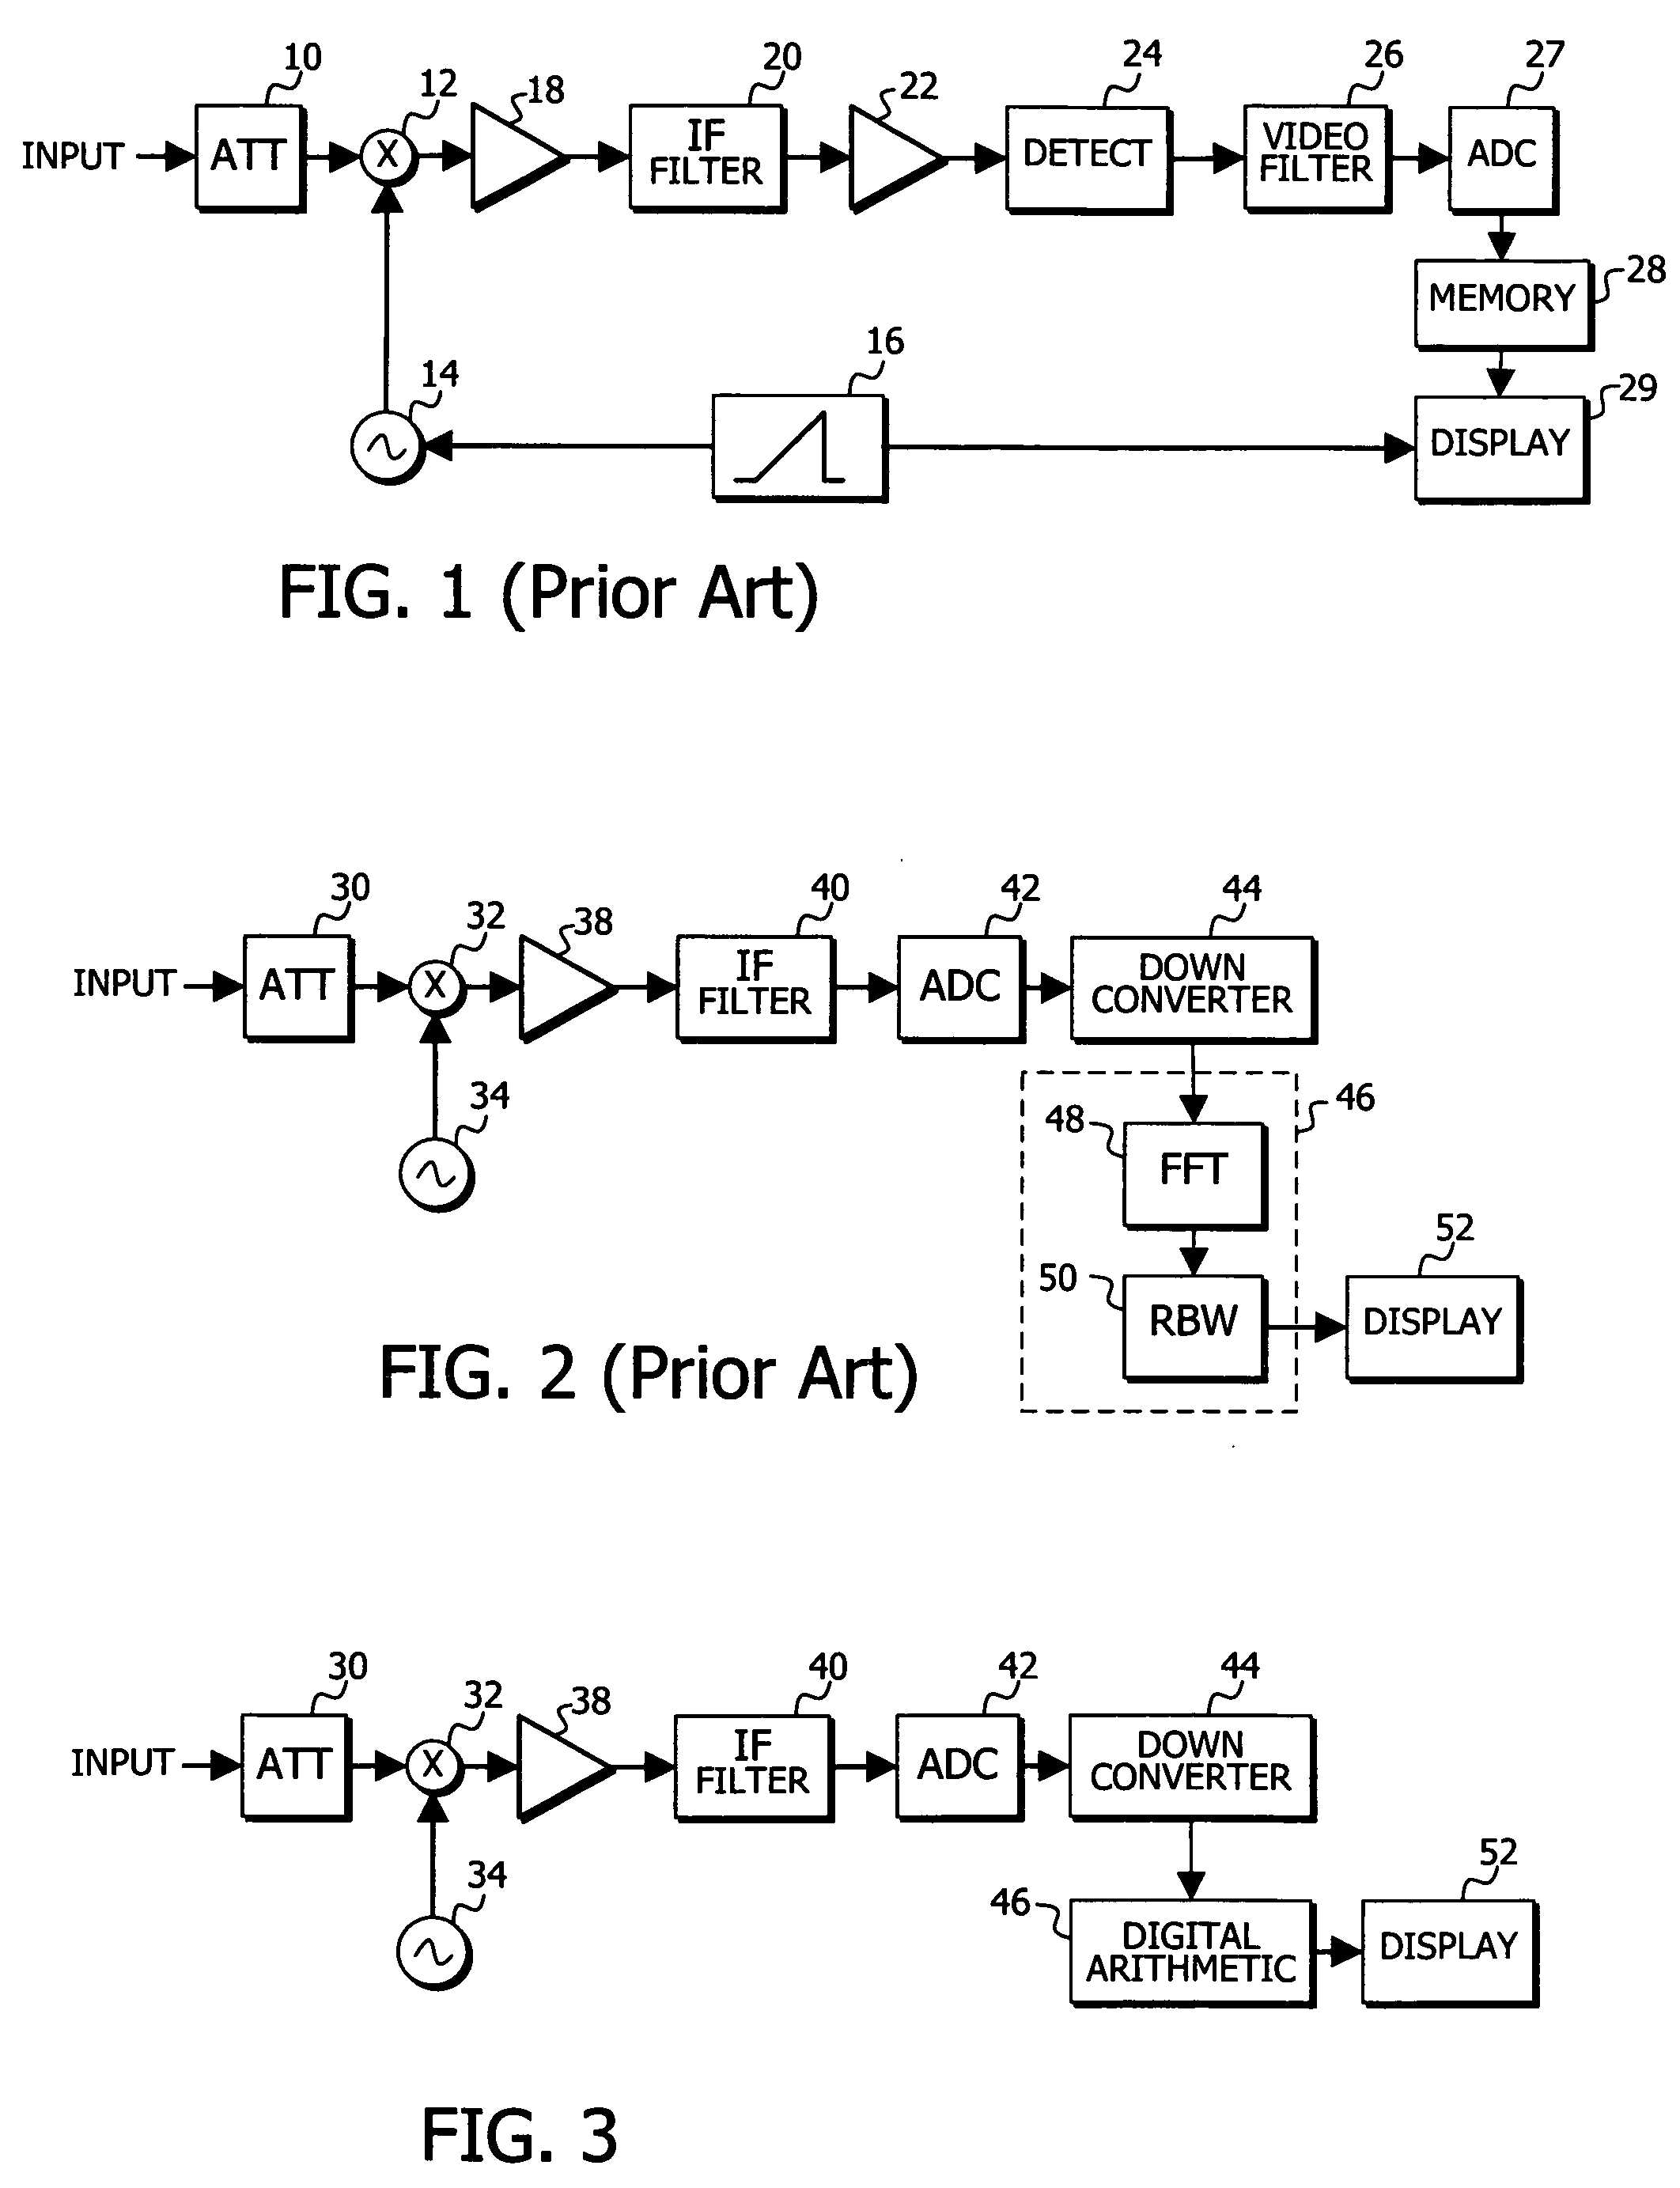
[0020]FIG. 3 is a functional block diagram of a signal analyzer according to the present invention wherein blocks corresponding to those of the conventional example are indicated by the same numbers. A control means including microprocessor, memory, hard disk drive, etc. controls operation of each block according to settings through an operation panel by a user. Program for controlling the circuit operation may be previously stored in a memory means such as the hard disk drive, etc.

[0021] The signal analyzer according to the present invention is different in the data processing by a digital arithmetic block 46 relative to the conventional one shown in FIG. 2. Referring to FIGS. 3 and 4, which show a signal analyzer similar to the a the FFT-type signal analyzer shown in FIG. 2, an input variable attenuation circuit 30 adjusts the level of an input signal under test and it is provided to a mixer 32 and mixed with a local signal from a local oscillator 34. The output of the mixer 32 p...


PUM


Abstract

A data processing method is provided to enable a calculation based signal analyzer, such as an FFT based spectrum analyzer, to produce results corresponding to a swept spectrum analyzer employing a video bandwidth (VBW) filter. Once a spectrum is produced the frequency axis is replace by a corresponding time axis, so that a time domain filter, such as a video bandwidth (VBW) filter can be applied. In a first example, the filter characteristics are applied by performing an FFT on display spectrum data, which has had its frequency axis replaced by a corresponding time axis, produce frequency domain data, multiplying by the frequency response to produce a filtered version, performing an inverse FFT and replacing the time axis with the original frequency axis to produce a filtered version of the display spectrum data. In another example, a filter impulse response is computed based upon the desired filter characteristics, a convolution integral of the display spectrum data, which has had its frequency axis replaced by a corresponding time axis, and the filter impulse response is conducted, and the time axis is replace by the original frequency axis to produce filtered display spectrum data.

Description

BACKGROUND OF THE INVENTION [0001] The present invention relates to data processing for a signal analyzer using FFT calculation, especially to data processing for a signal analyzer for simulating results that a swept spectrum analyzer using a video filter would provide. [0002]FIG. 1 is a block diagram of an example of a swept spectrum analyzer. A control means (not shown) including microprocessor, memory, and hard disk drive, etc. controls block operations according to settings by a user through an operation panel as is well known in the art. An input variable attenuator 10 adjusts the level of an input signal under test and a mixer 12 mixes it with a local signal from a sweep frequency oscillator 14. The frequency of the local signal changes according to a sweep signal (ramp waveform) from a sweep signal generator 16. This processing leads to a linear relationship between frequency and time changes on a resultant spectrum signal. The time for one frequency sweep is the sweep time. ...

Claims


Application Information

Patent Timeline
Patent Type & Authority Applications(United States)
IPC IPC(8): H04M1/64
CPCG01R23/16
Inventor HOSOI, OSAMUNARA, AKIRA
Owner TEKTRONIX INC
Learn More