

Femtosecond spectroscopy using minimum phase functions
a femtosecond spectroscopy and function technology, applied in the direction of instruments, digital computer details, pulse characteristics measurements, etc., can solve the problem of difficult task of direct phase measuremen
- Summary
- Abstract
- Description
- Claims
- Application Information
AI Technical Summary
Problems solved by technology
Method used
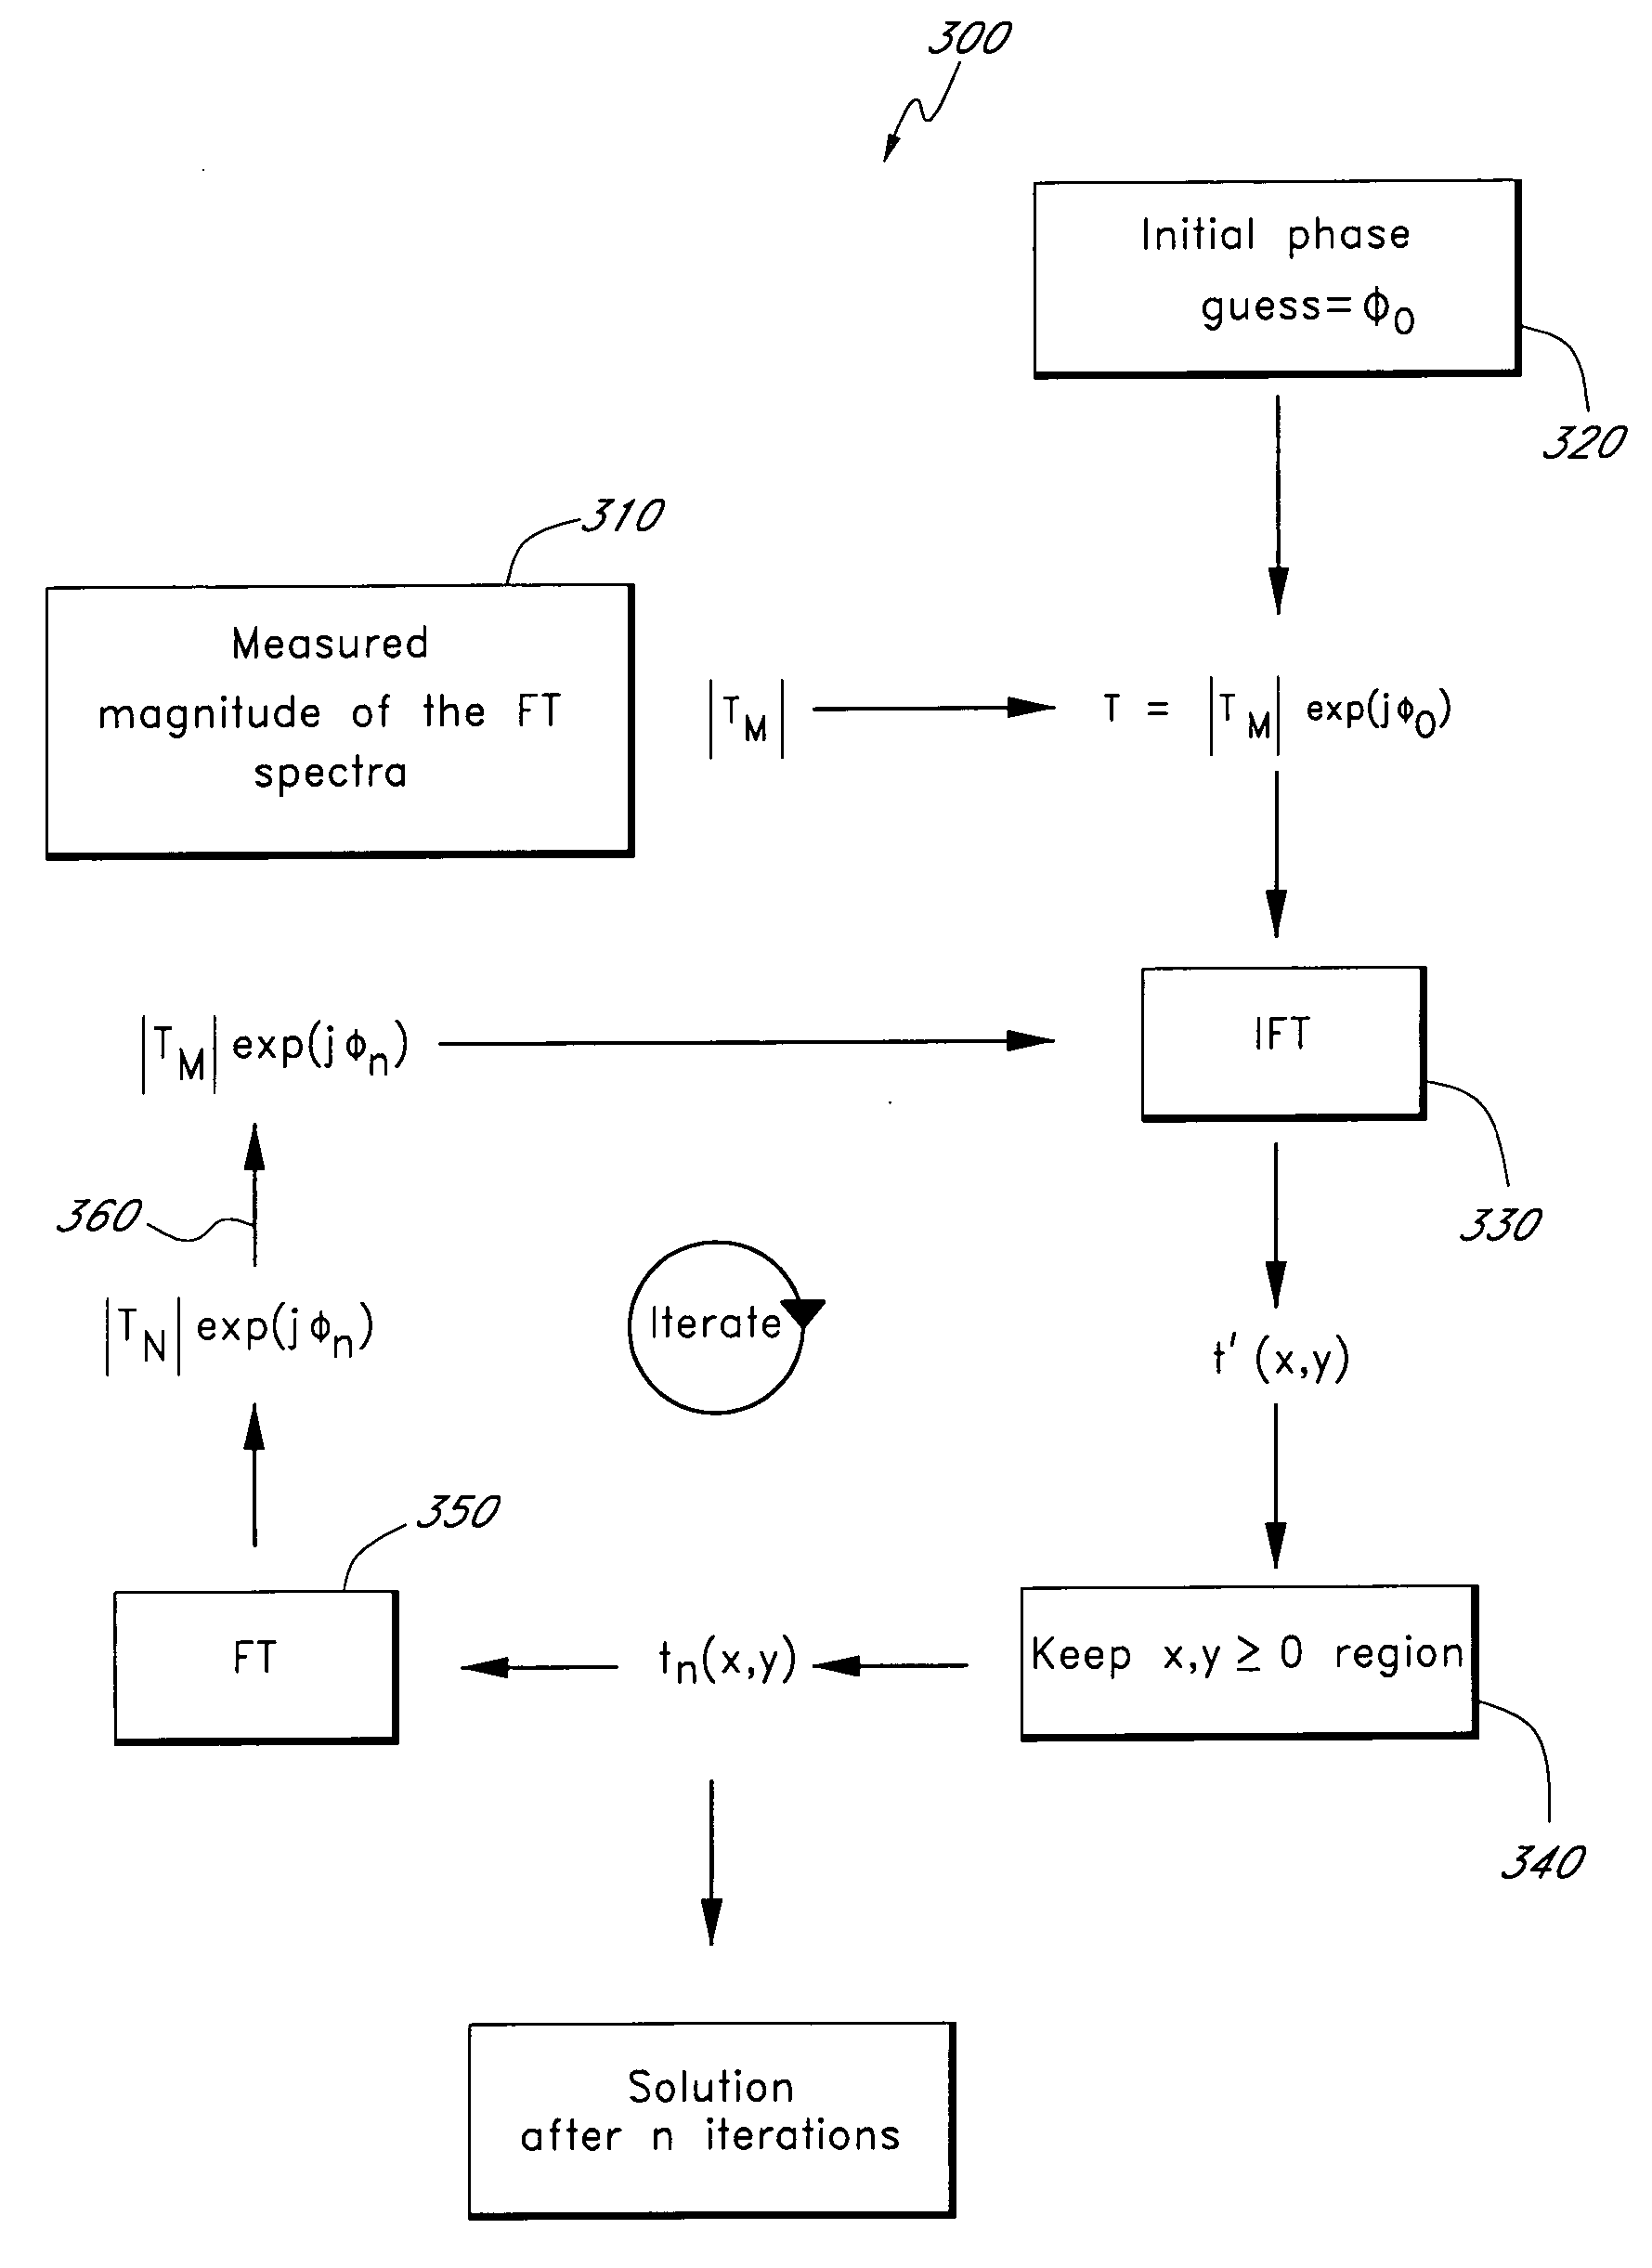
Image

Examples
example 1
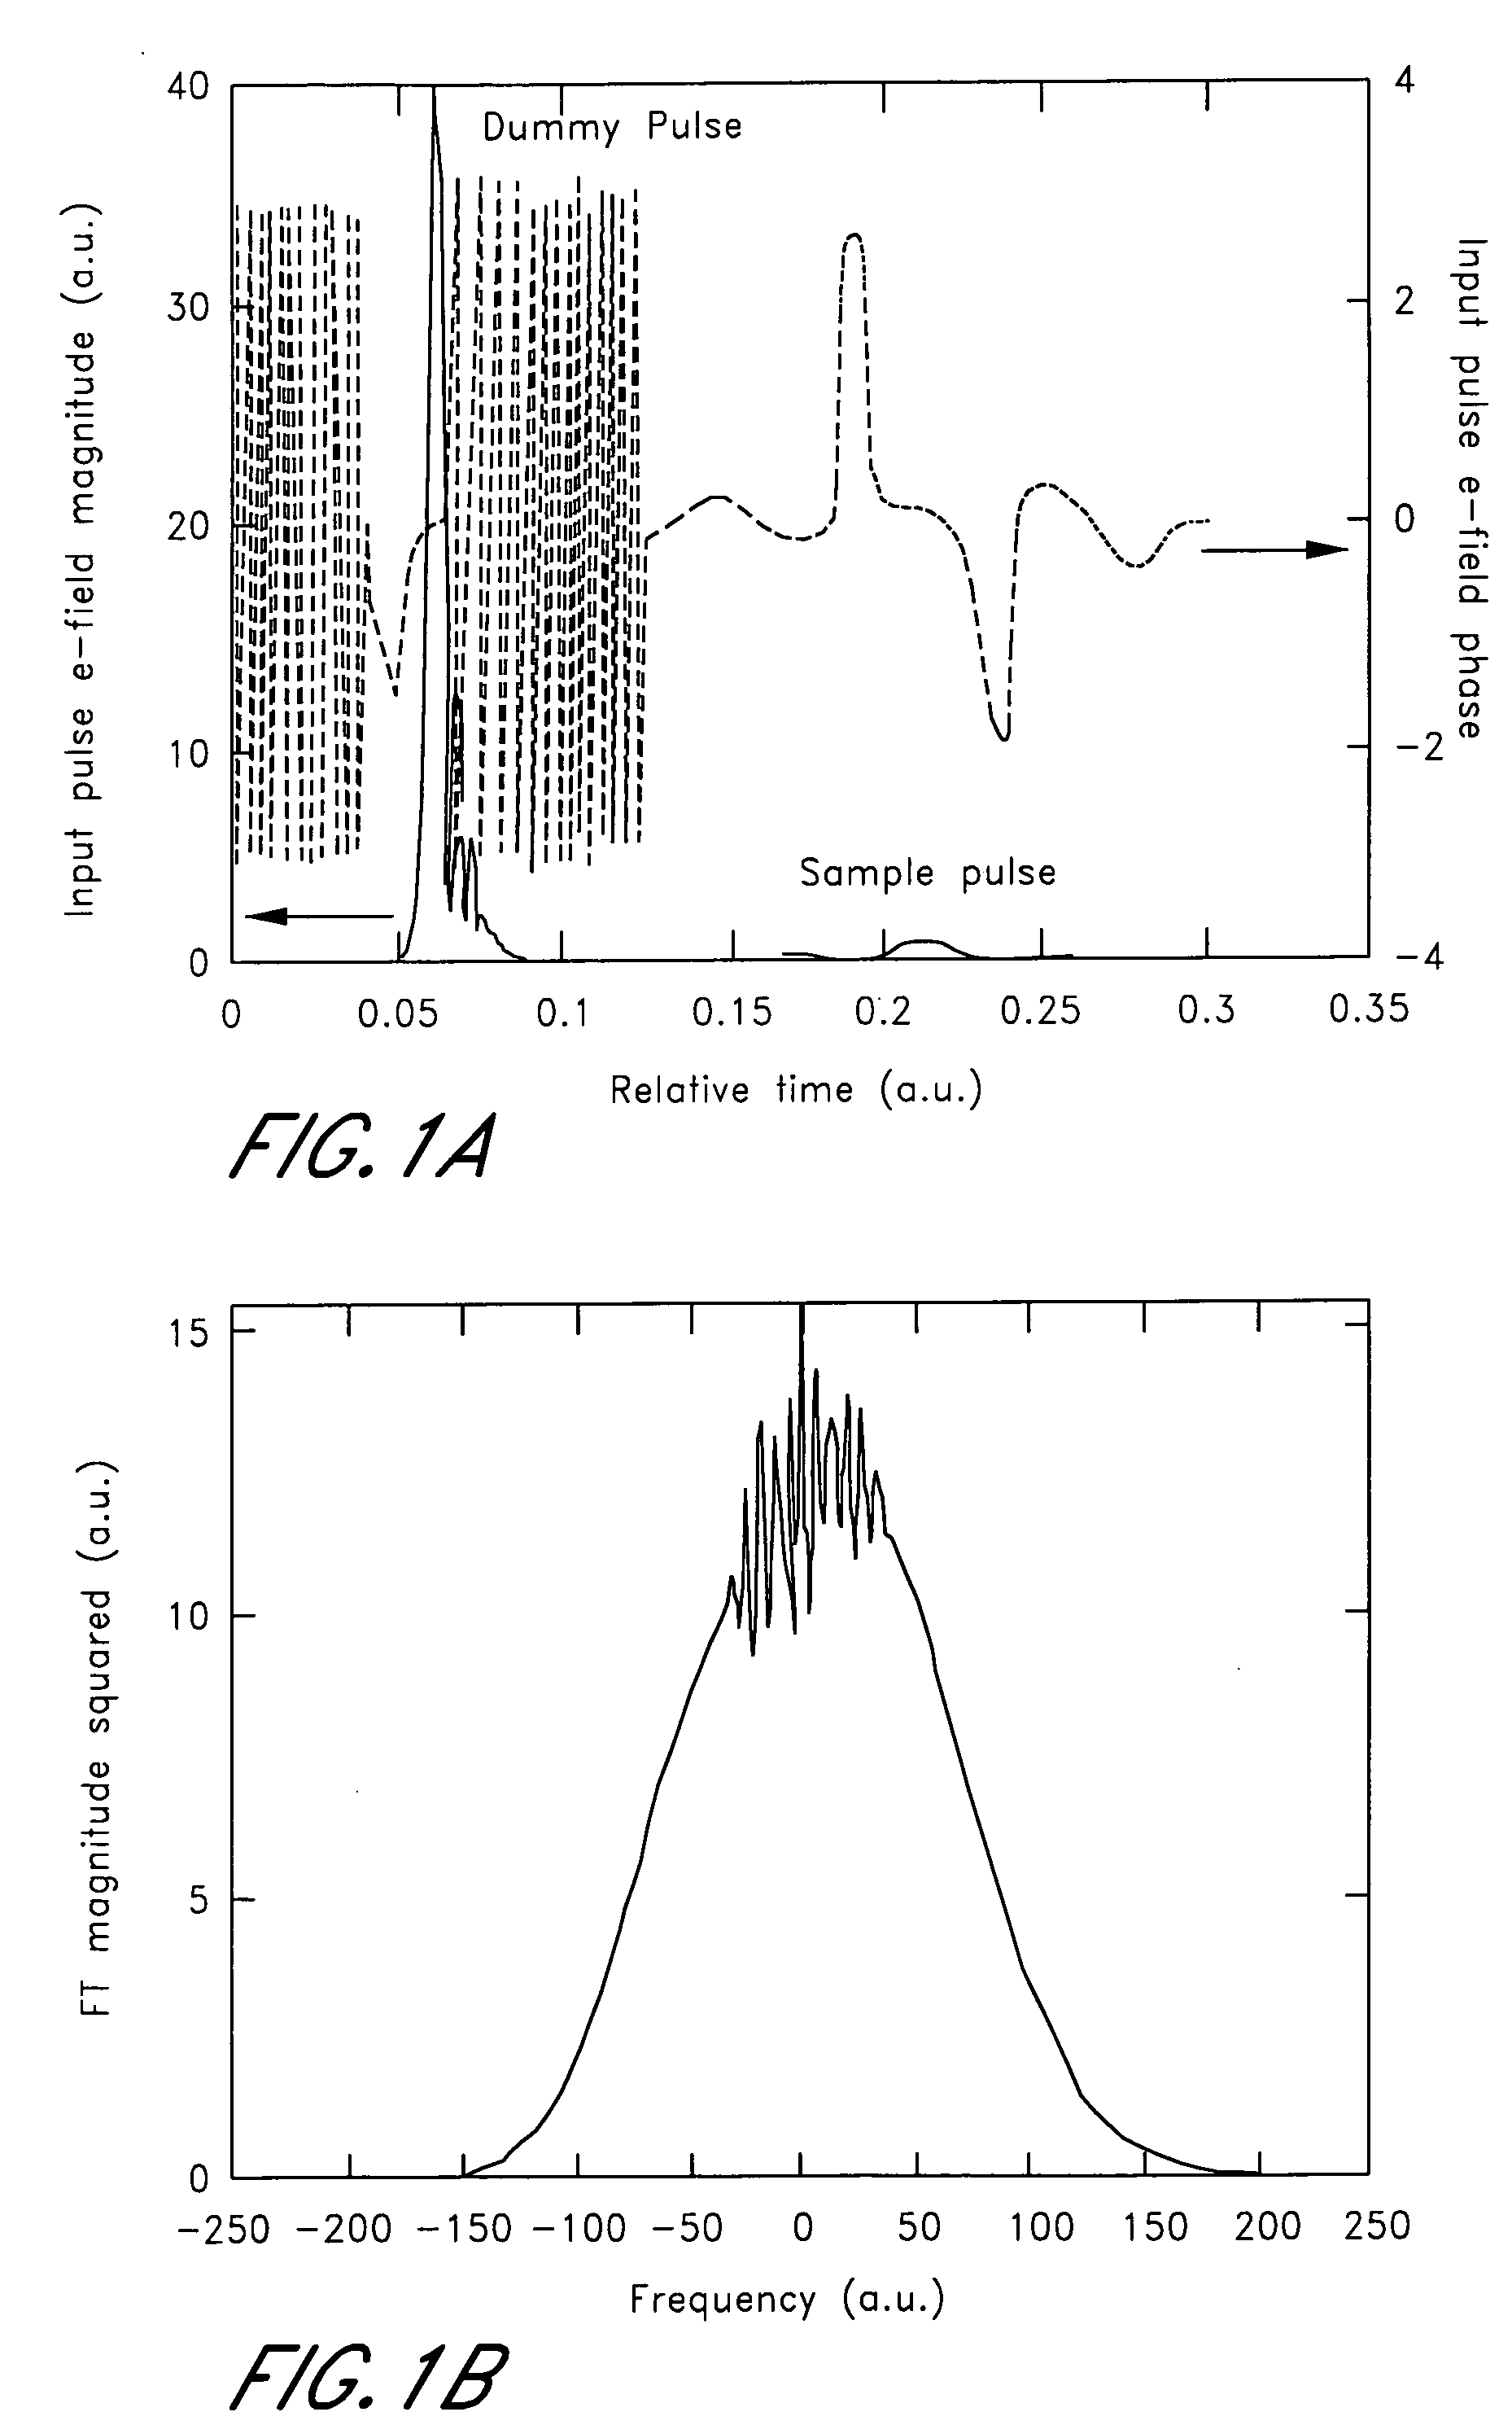
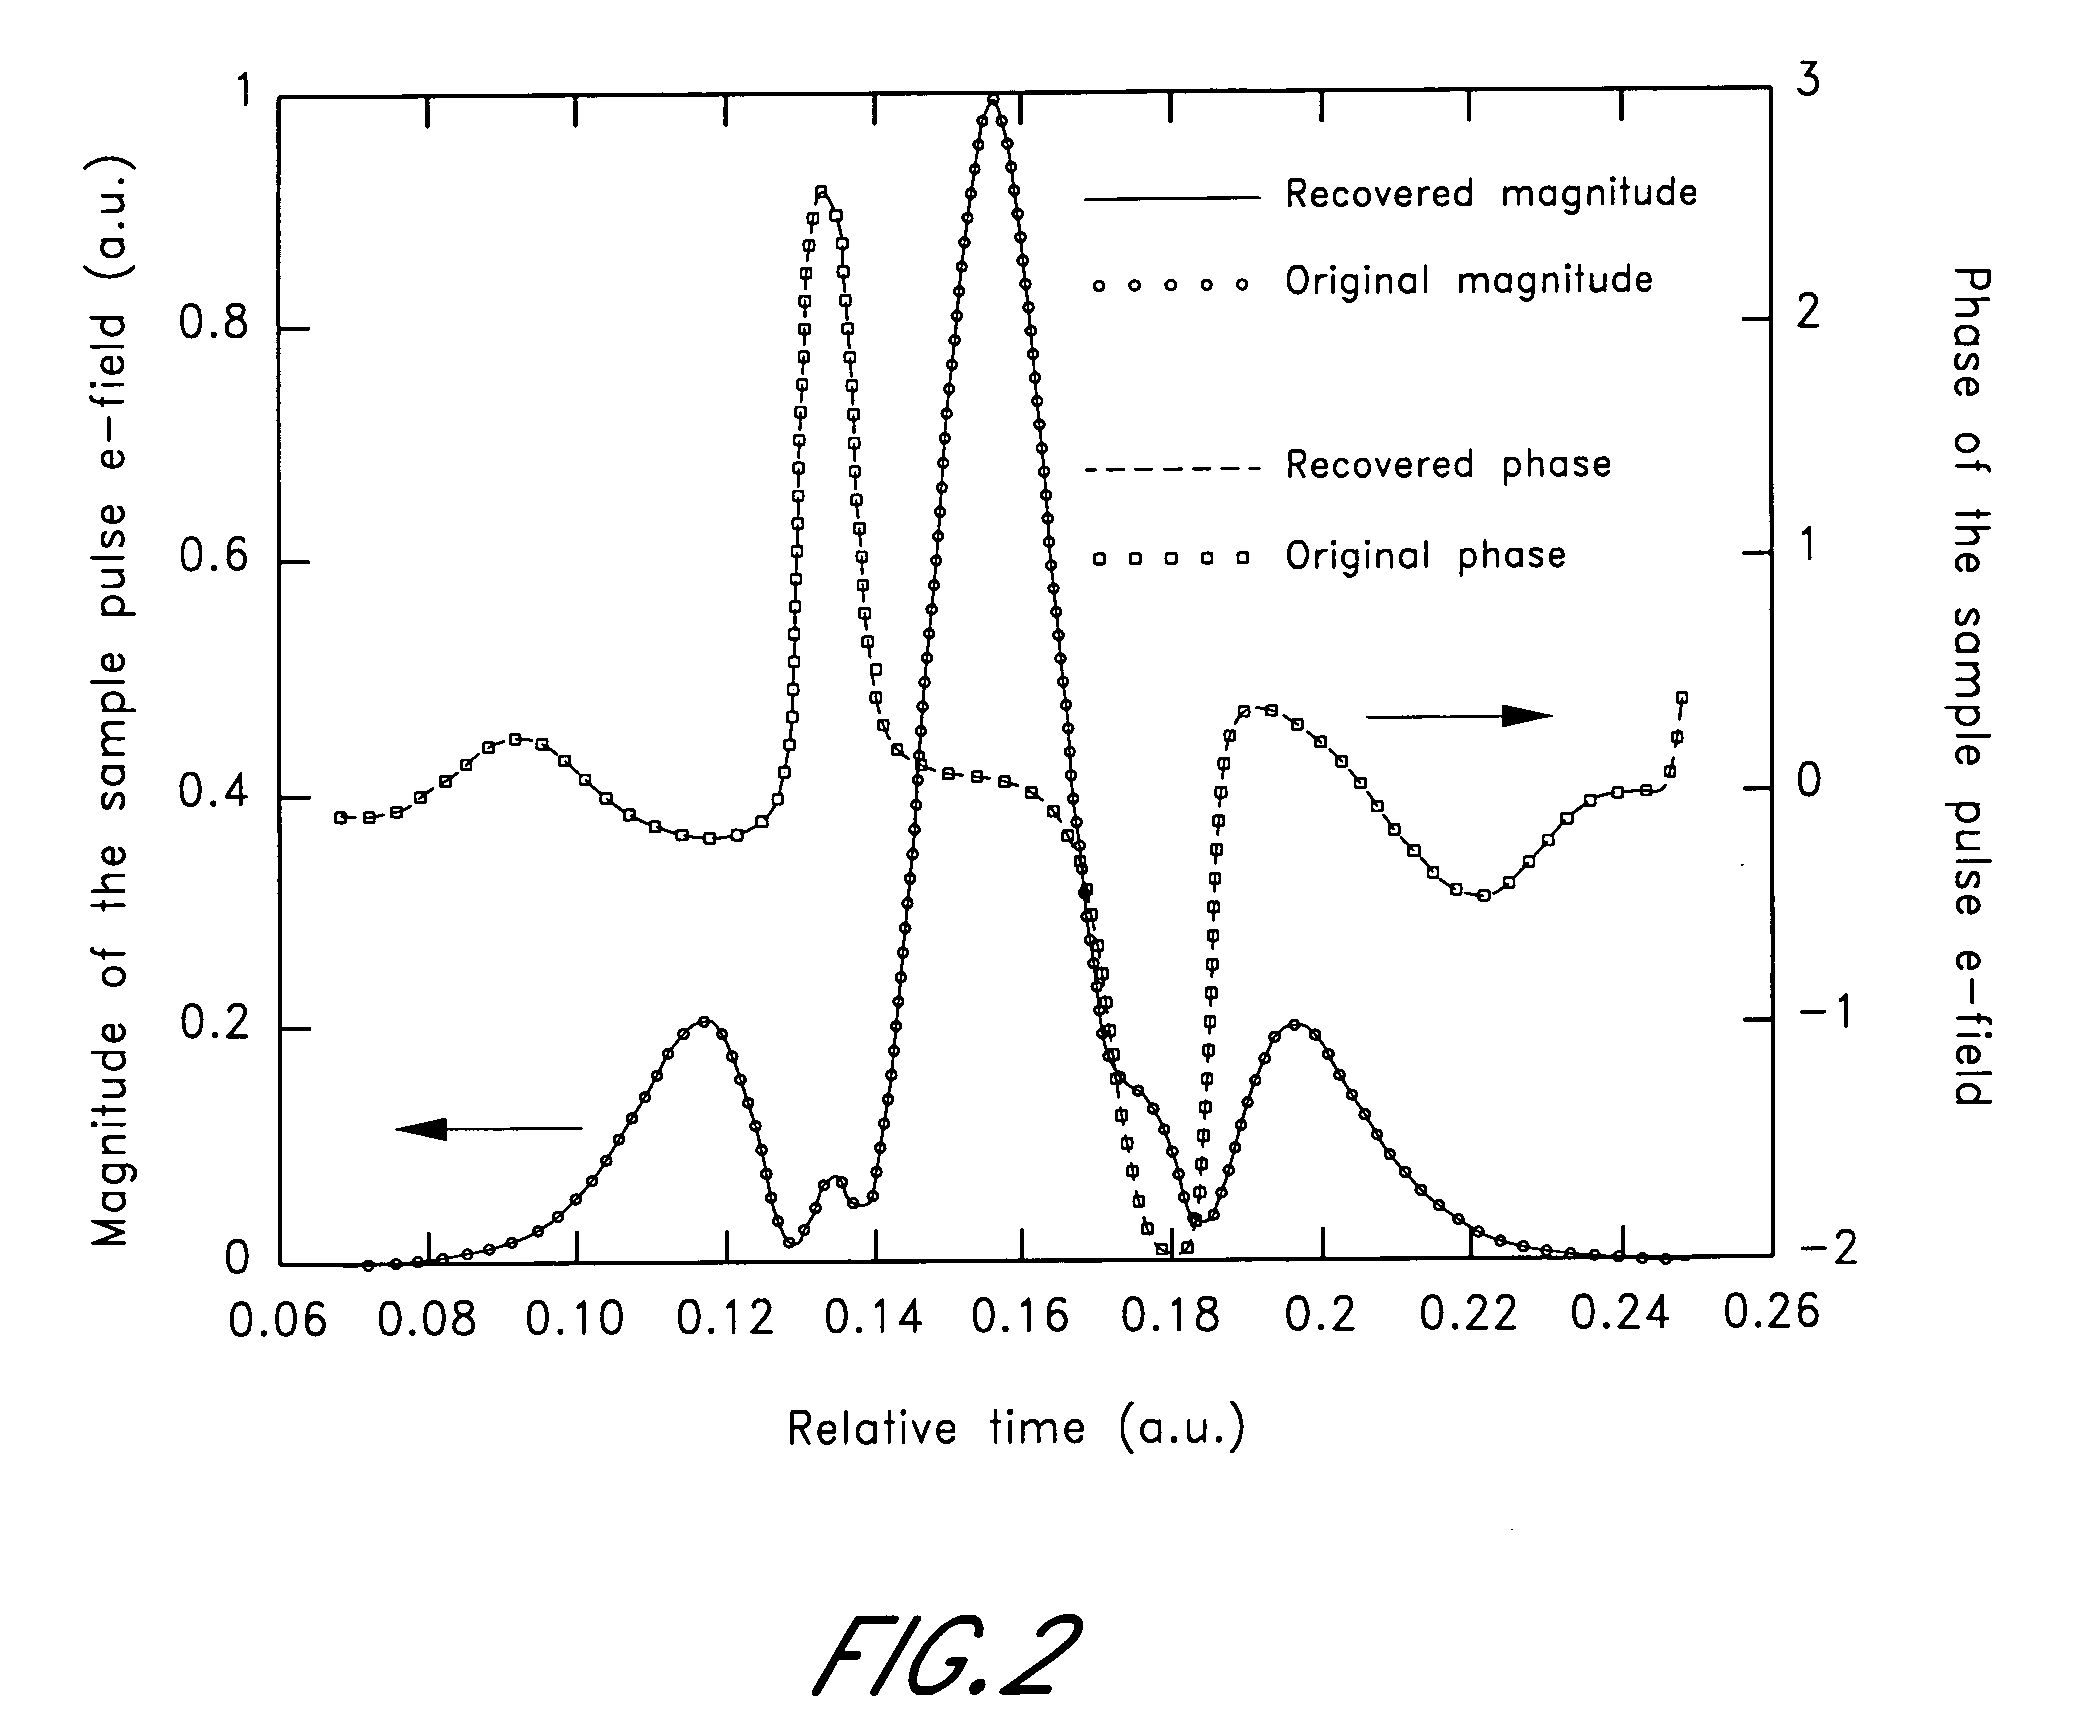
[0102] In the first example, the optical system 250 of interest comprised a slab of fused silica approximately 16 centimeters long. Thus, the measurement of this first example can be considered to be a material characterization measurement. The input pulse 240 had a full-width-at-half-maximum width of approximately 145 femtoseconds, and was generated from a Ti:sapphire oscillator that ran at approximately 859 nanometers with a repetition rate of approximately 96 MHz. The peak powers of the dummy pulse 224 and the sample pulse 202 were approximately 2.61 microwatts and 168 nanowatts, respectively, which corresponds to a maximum field ratio of approximately 4.
[0103]FIG. 22 is a graph of the measured power spectrum of the pulse sequence 222 formed by delaying the dummy pulse 224 with respect to the sample pulse 202. Because fused silica has a large transparency window with χ(2)≈0, the bandwidth of the sample pulse 202 roughly matches that of the dummy pulse 224. Thus, the interference...
example 2
[0105] In this example, the optical system 250 of interest comprises a thin film bandpass filter, having a FWHM of approximately 10 nanometers, that significantly filters the frequency bandwidth of the dummy pulse 224. This spectral filtering resulted in a temporally wider sample pulse, while the dummy pulse 224 had a FWHM of about 30 femtoseconds. To test the repeatability of the SIMBA technique, using the measurement configuration of FIG. 21, two successive measurements were made with slightly different delay values between the sample pulse 202 and the dummy pulse 224. FIGS. 24A and 24B show recorded charge-coupled-device (CCD) images at the optical spectrum analyzer 232 for these two successive measurements. The resolution of the optical spectrum analyzer was about 54 picometers. For the measurement of FIG. 24A, a maximum field ratio between the dummy pulse 224 and the sample pulse 202 of about 4.40 was used and for the measurement of FIG. 24B, a maximum field ratio between the d...
PUM
 Abstract
Description
Claims
Application Information