
Graph generating method, graph generating program and data mining system

a graph and graph technology, applied in the field of graph generating methods, graph generating programs and data mining systems, can solve the problems of inability to obtain computations to be interrupted or aborted without being completed, and the divisors in the computation process will become extremely small, so as to increase the reliability of the resulting independent directed acyclic graphs and achieve high success ra

Inactive Publication Date: 2007-08-30
INFOCOM
View PDF2 Cites 16 Cited by
  • Summary
  • Abstract
  • Description
  • Claims
  • Application Information

AI Technical Summary

Benefits of technology

[0039]The present invention was made to overcome the above problems, and has the purpose of offering a graph generating method and graph generating program capable of obtaining independent directed acyclic graphs at a high rate of success. It has the additional purpose of offering a graph generating method and graph generating program capable of increasing the reliability of the resulting independent directed acyclic graphs. It has the further purpose of offering a data mining system that operates based on the graph generating program described above, capable of obtaining highly reliable independent directed acyclic graphs.
[0047]According to the present invention, the structure is such that an inverse matrix of a correlation coefficient matrix is calculated for a variable sequence consisting of the first variable and the second variable which are the subject of the conditional independence determination and the partial set used in the conditional independence determination, and the operation of determining the conditional independence of the first variable and the second variable is skipped when the diagonal element relating to the first variable in the inverse matrix is greater than a predetermined threshold value or the diagonal element relating to the second variable in the inverse matrix is greater than the predetermined threshold value, as a result of which it is possible to avoid interruptions and abortions of operations due to errors caused by high degrees of multicolinearity, thus enabling graphs showing the relationships between variables indicating the states of observed items to be obtained at a high rate of success.
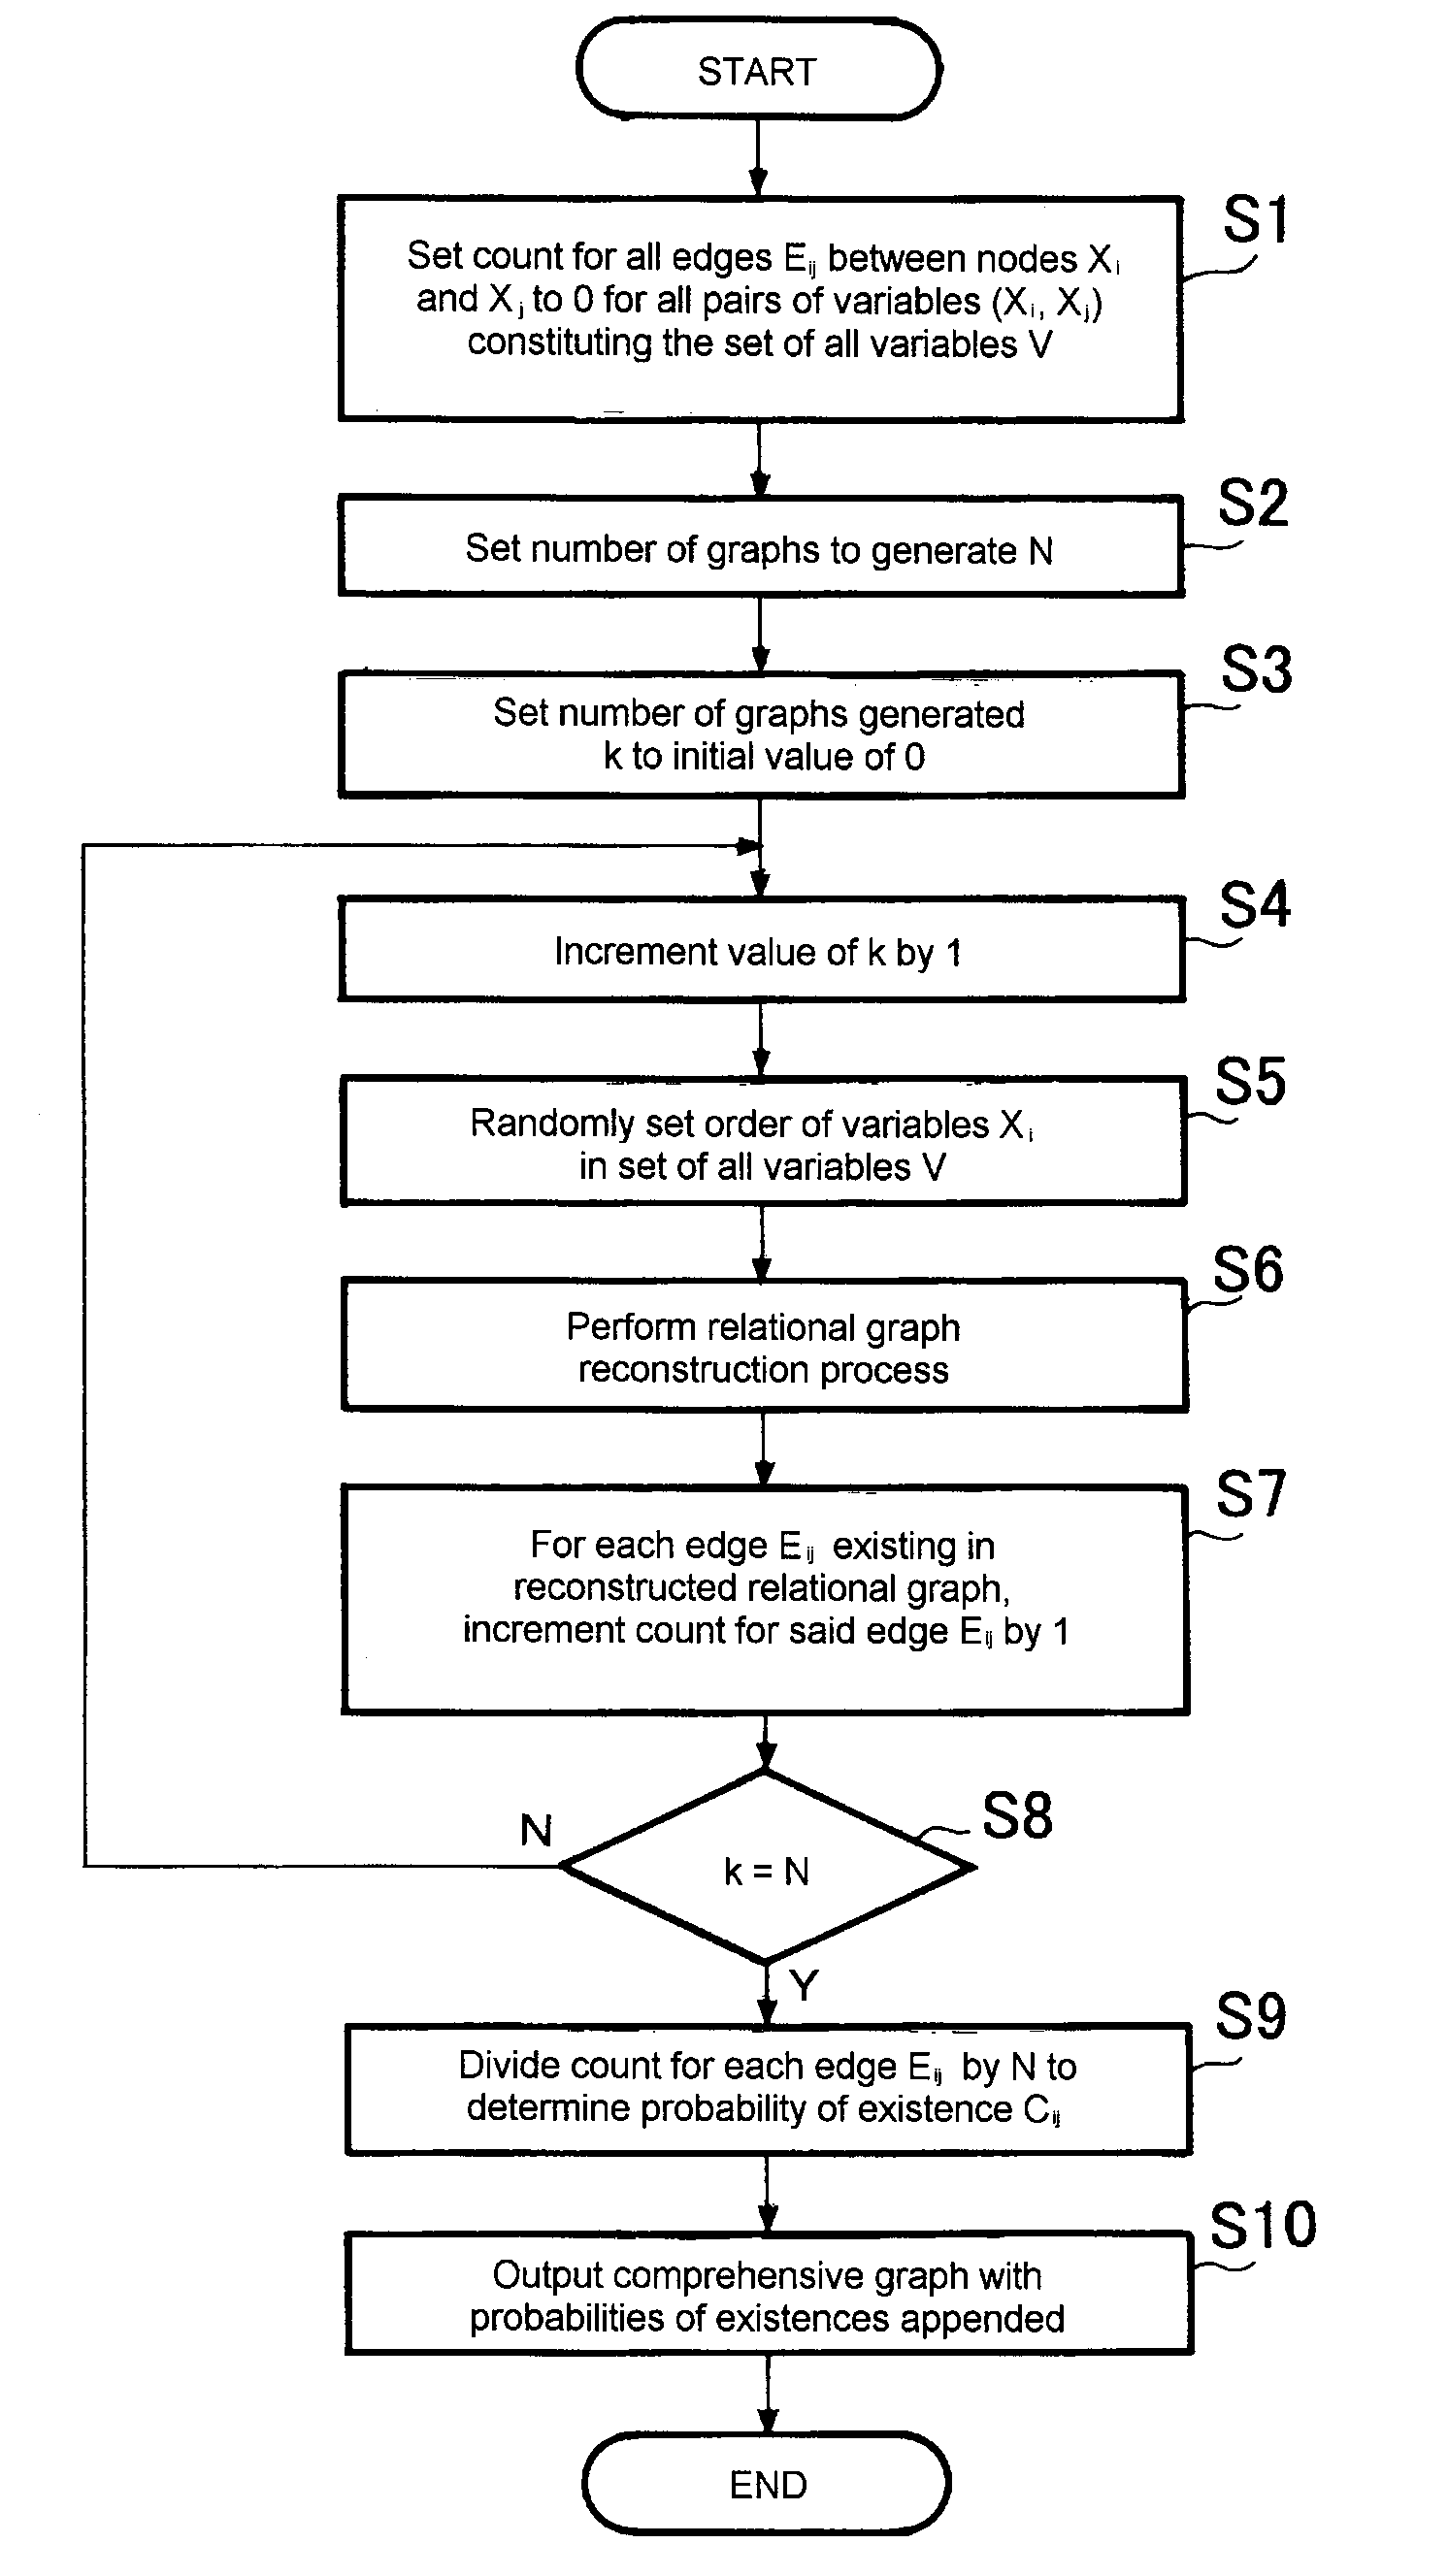
[0048]The present invention comprises a step of establishing a number of graphs to be generated; a step of randomly establishing the order of variables forming a given set of all variables each time a graph is generated; a step of generating a graph for the set of all variables consisting of the randomly established variables; and a step of outputting a comprehensive graph including all edges present on any of the graphs generated to express the relationships between variables for each graph generated, so that it is possible to obtain a graph comprehensively expressing graphs generated a number of times even in cases where a graph showing the relationship between variables cannot be specified in a single pattern due to noise occurring during data observation or insufficient data samples, thus preventing erroneous interpretations of relationships between variables from being taken by users.
[0049]The present invention comprises a step of calculating a probability of existence obtained by dividing the cumulative number of times each edge exists in a graph by the predetermined number of times in which the set of graphs are generated; wherein the probability of existence corresponding to each existing edge is shown on the outputted comprehensive graph, thus enabling the relationships between variables to be accurately understood.
[0051]The present invention is such that probabilities of existence are appended to all edges in the comprehensive graph showing the relationships between variables are displayed on the display means, so that a comprehensive graph including even edges with a low probability of existence is shown to the user, thus preventing users from making erroneous interpretations of the relationships between variables.
[0052]The present invention is such that the edges are displayed with the probabilities of existence on the display means, thus enabling the user performing the data mining to readily and accurately understand the relationships between variables

Problems solved by technology

However, when there is a high level of multicolinearity between Xi, Xj and S, in other words, when there is a strong linear relationship between Xi, Xj and S, the divisors in the computation process will become extremely small.
As a result, computational errors can occur as a result of overflow, causing computations to be interrupted or aborted without being completed, and causing the problem of not being able to obtain an independent directed acyclic graph.
Additionally, even if an independent directed acyclic graph is obtained, insufficient numbers of data samples or noise occurring during data observation can cause the outputted independent directed acyclic graphs to differ depending on the order of the variables X forming the set of all variables V.

Method used


Image

  • Graph generating method, graph generating program and data mining system
  • Graph generating method, graph generating program and data mining system
  • Graph generating method, graph generating program and data mining system

Examples


Embodiment Construction

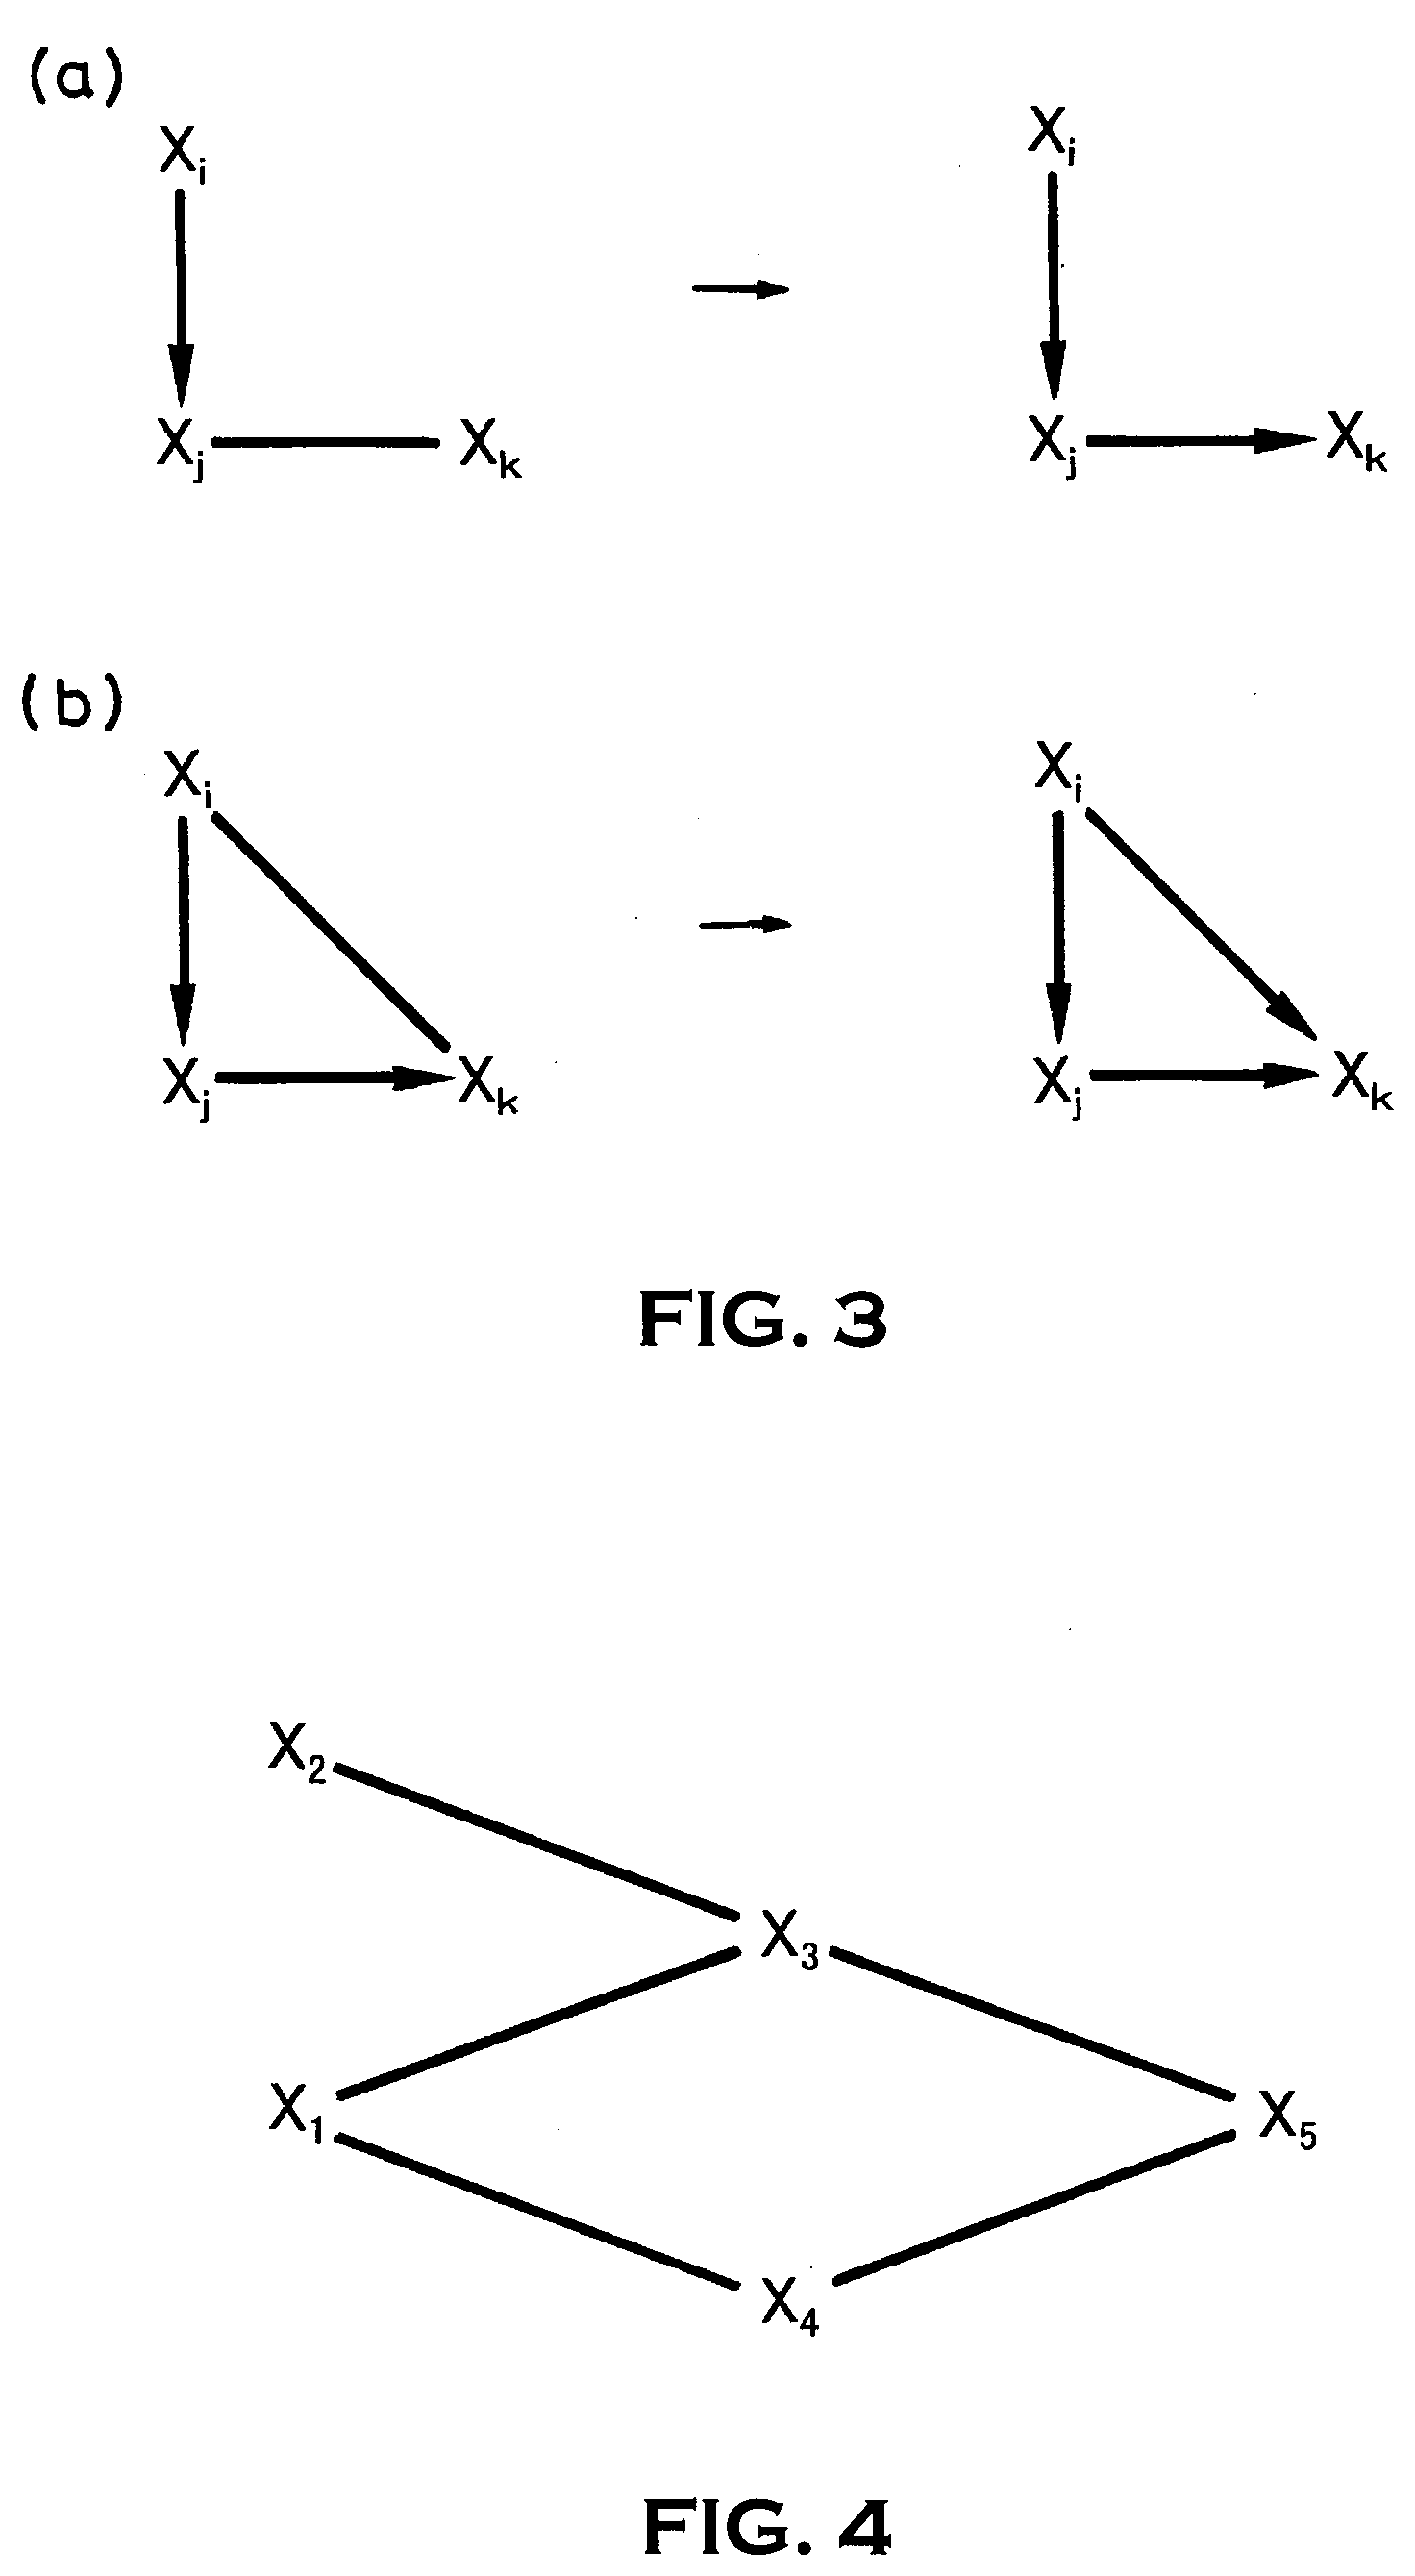
[0066]FIG. 6 is a flow chart showing the algorithm for a graph generating method according to Embodiment 1 of the present invention. In the present invention, a technique of reconstructing independent directed acyclic graphs is used to generate graphs representing the relationship between variables indicating the states of observed items. As shown in FIG. 5, a graph representing the relationships between variables may also ultimately be a partially undirected graph. Therefore, in the following description, a graph that has been finally obtained using a technique for reconstructing independent directed acyclic graphs and representing the relationships between variables shall be referred to as a relational graph. It should be obvious that such relational graphs will include independent directed acyclic graphs and partially undirected graphs. The graph generating method shown in FIG. 6 is one in which a predetermined number N (set by the user) of graphs are generated, the probability o...


PUM


Abstract

The invention has the object of obtaining, at a high rate of success, graphs indicating the relationships between variables indicating the states of observed items which are the subjects of data mining, and improving the reliability of the outputted graphs. A method for generating a graph showing the relationships between variables comprises a step S2 of establishing a number of graphs to be generated, a step S5 of randomly establishing an order of variables X forming the set of all variables V, a step S6 of performing a process of reconstructing a graph showing the relationships between variables, and a step S10 of outputting a comprehensive graph including all edges existing in any of the graphs generated with each graph generation. In the graph reconstruction process, an inverse matrix of the correlation coefficient matrix is calculated, and the operation of determining the conditional independence relating to two variables which are the subject of the conditional independence determination is skipped if any of the diagonal elements relating to the two variables is greater than a predetermined threshold value.

Description

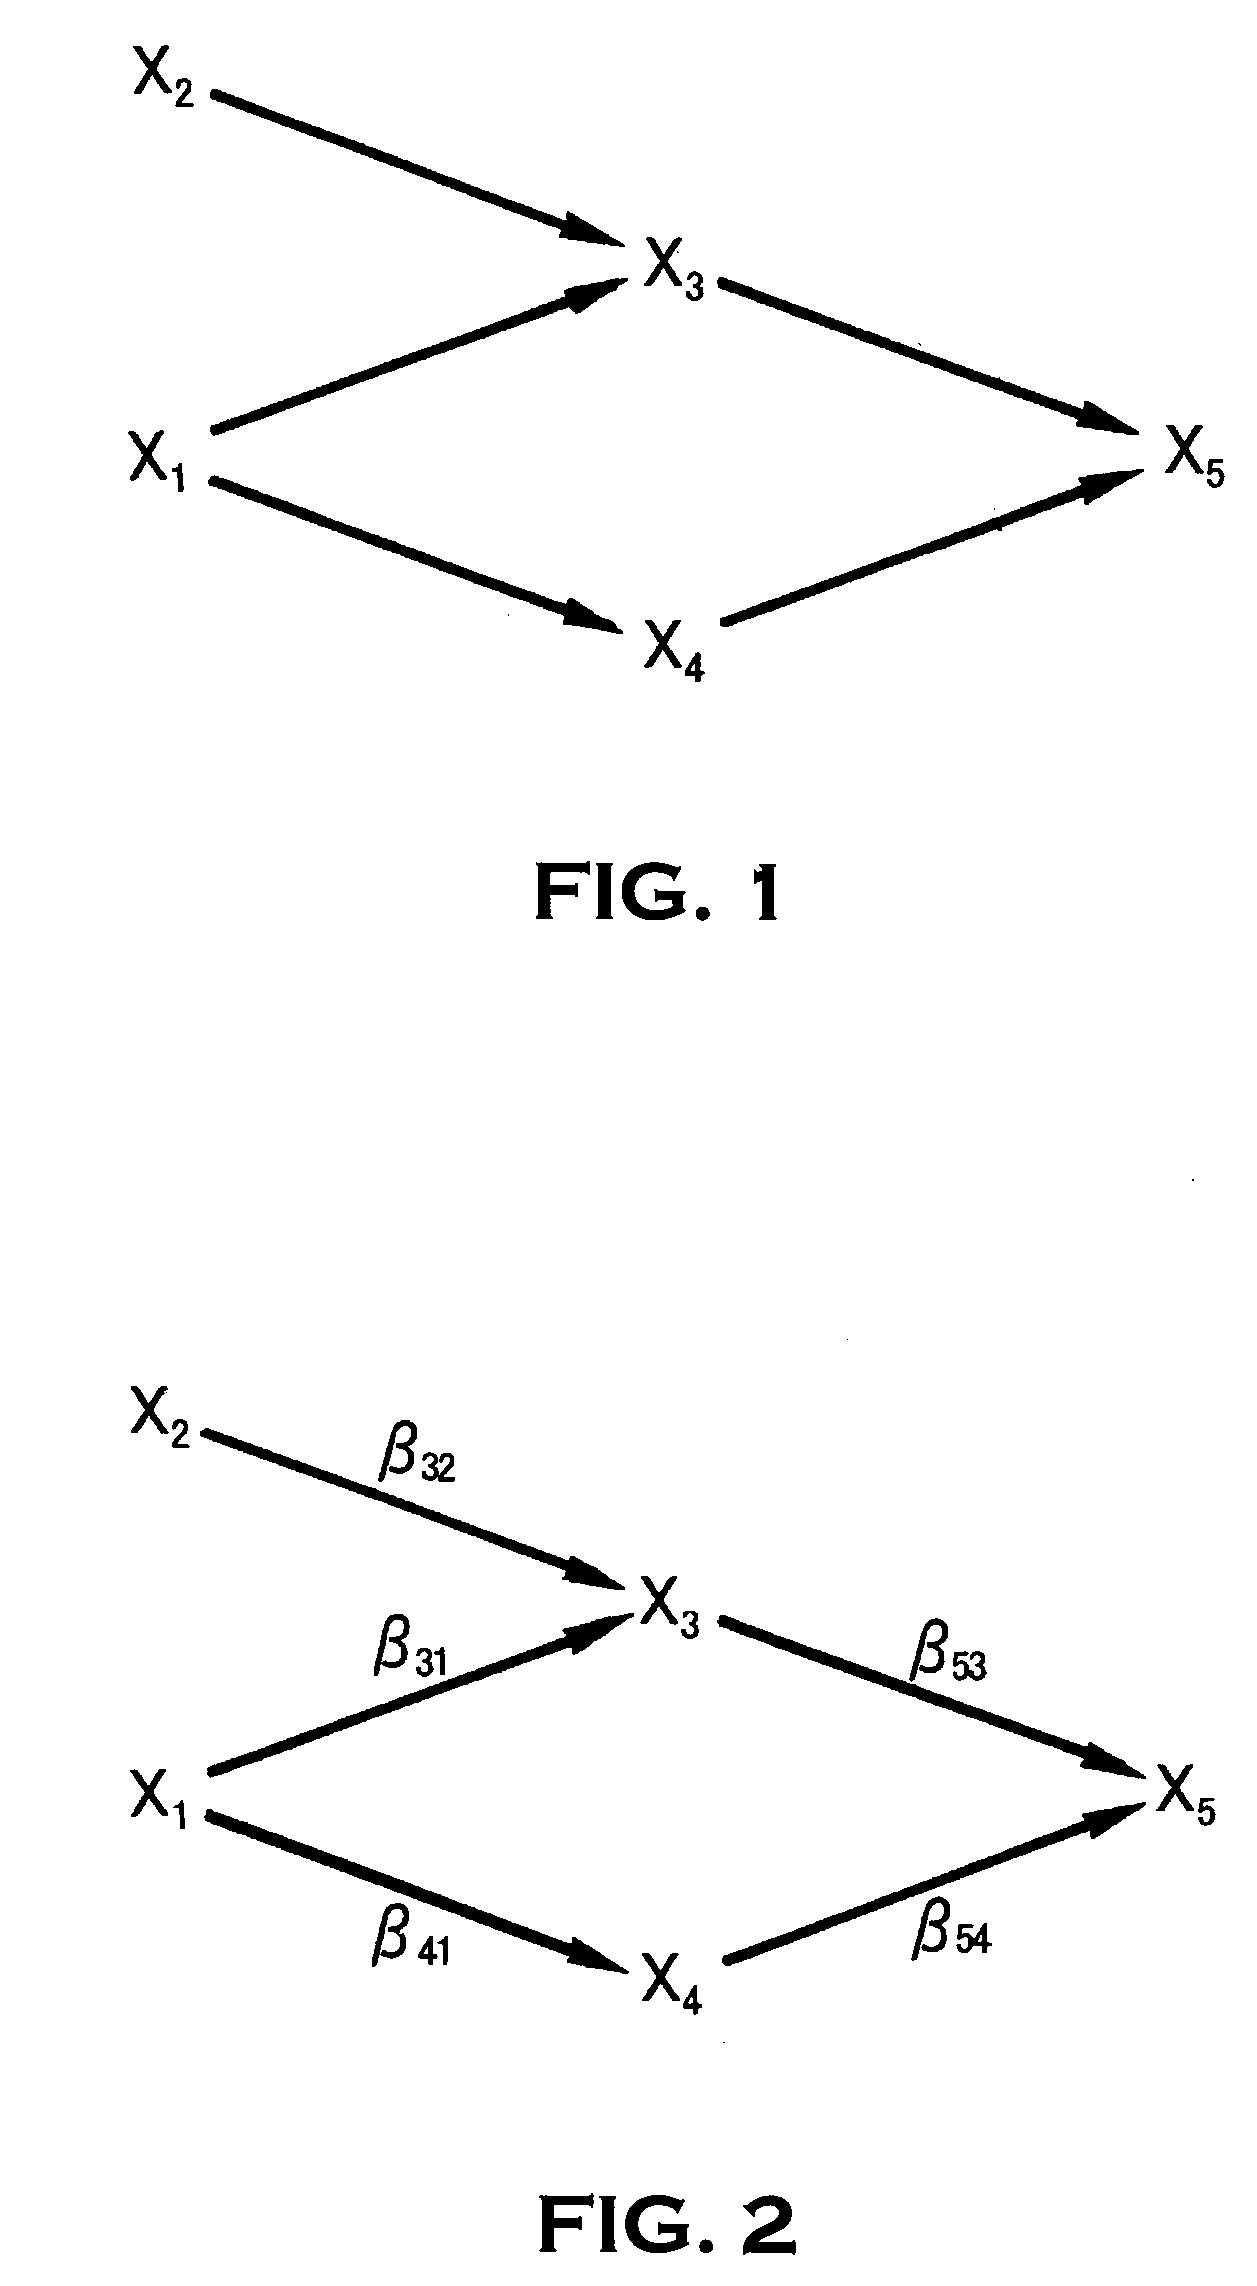
BACKGROUND OF THE INVENTION[0001](1) Field of the Invention[0002]The present invention relates to a graph generating method, a graph generating program and a data mining system, and relates in particular to a graph generating method and graph generating program that use a process of reconstructing independent directed acyclic graphs to generate, from a set of observed data, a graph representing the relationships between variables indicating the states of observed items, and a data mining system displaying said graph to a user.[0003]“Independent directed acyclic graph” is graph terminology. Acyclic refers to a graph without a cyclic closed path. Directed graphs are graphs in which all edges (paths) connecting nodes (vertices) are arrows having an arrowhead on one or both sides. Additionally, when a directed acyclic graph is such that the simultaneous probability density function of a set of variables consisting of variables each represented as a node can be defined in the form of a s...

Claims


Application Information

Patent Timeline
Patent Type & Authority Applications(United States)
IPC IPC(8): G06N7/02
CPCG06F17/10
Inventor SAITO, SHIGERU
Owner INFOCOM
Learn More