
System and method for visualizing sound source energy distribution

a technology of energy distribution and sound source, applied in the field of visualizing sound source energy distribution, can solve the problems of ineffective identification of unstable-state sound sources, inability to identify nearfield acoustic holography, and inability to identify farfield acoustic fields

Inactive Publication Date: 2007-09-27
NAT CHIAO TUNG UNIV +1
View PDF11 Cites 17 Cited by
  • Summary
  • Abstract
  • Description
  • Claims
  • Application Information

AI Technical Summary

Benefits of technology

The present invention provides a system and method for visualizing sound source energy distribution using an inverse-operation technology. The system can obtain the energy distributions of nearfield / farfield stable-state / unstable-state sound sources or the sound source energy distribution of an arbitrary frequency band. The method utilizes a smaller number of in-array microphones and is advantaged by wide identifiable frequency band, no reference signal, less spatial aliasing, allowance of an irregular microphone array, the capability of instant calculation, and the capability of synchronically obtaining the energy distributions of the sound sources of different coordinate systems. The system can also utilize the propagation matrix and window matrix to obtain the sound source energy distribution reconstructor and to transform the sound source signals into the time domain to obtain the sound source energy distribution on the retreated focus point surface. The technical effects of the present invention include improved accuracy and efficiency in sound source energy distribution visualization.

Problems solved by technology

However, the living environment is full of the noise induced by structural vibration, which may cause physiological and psychological problems.
However, the nearfield acoustical holography can only identify the distribution of the acoustic field on a nearfield plane.
Further, the calculation thereof needs to perform coordinate transformation several times, which is apt to cause a spatial aliasing.
Besides, such a technology is also disadvantaged by needing a multitude of microphones.
However, the beam forming array technology can only identify a farfield acoustic field and is not so effective in identifying an unstable-state sound source.
Besides, such a technology is also disadvantaged by that it cannot perform calculation instantly, that it cannot synchronically identify the acoustic fields of different coordinate systems, and that it needs to modify the configuration of the microphone array to avoid a spatial aliasing.

Method used


Image

  • System and method for visualizing sound source energy distribution
  • System and method for visualizing sound source energy distribution
  • System and method for visualizing sound source energy distribution

Examples


Embodiment Construction

[0031] The present invention proposes a system for visualizing sound source energy distribution and a method thereof, which utilizes an inverse-operation technology to establish a sound source energy distribution reconstructor and obtain the energy distributions of sound sources.

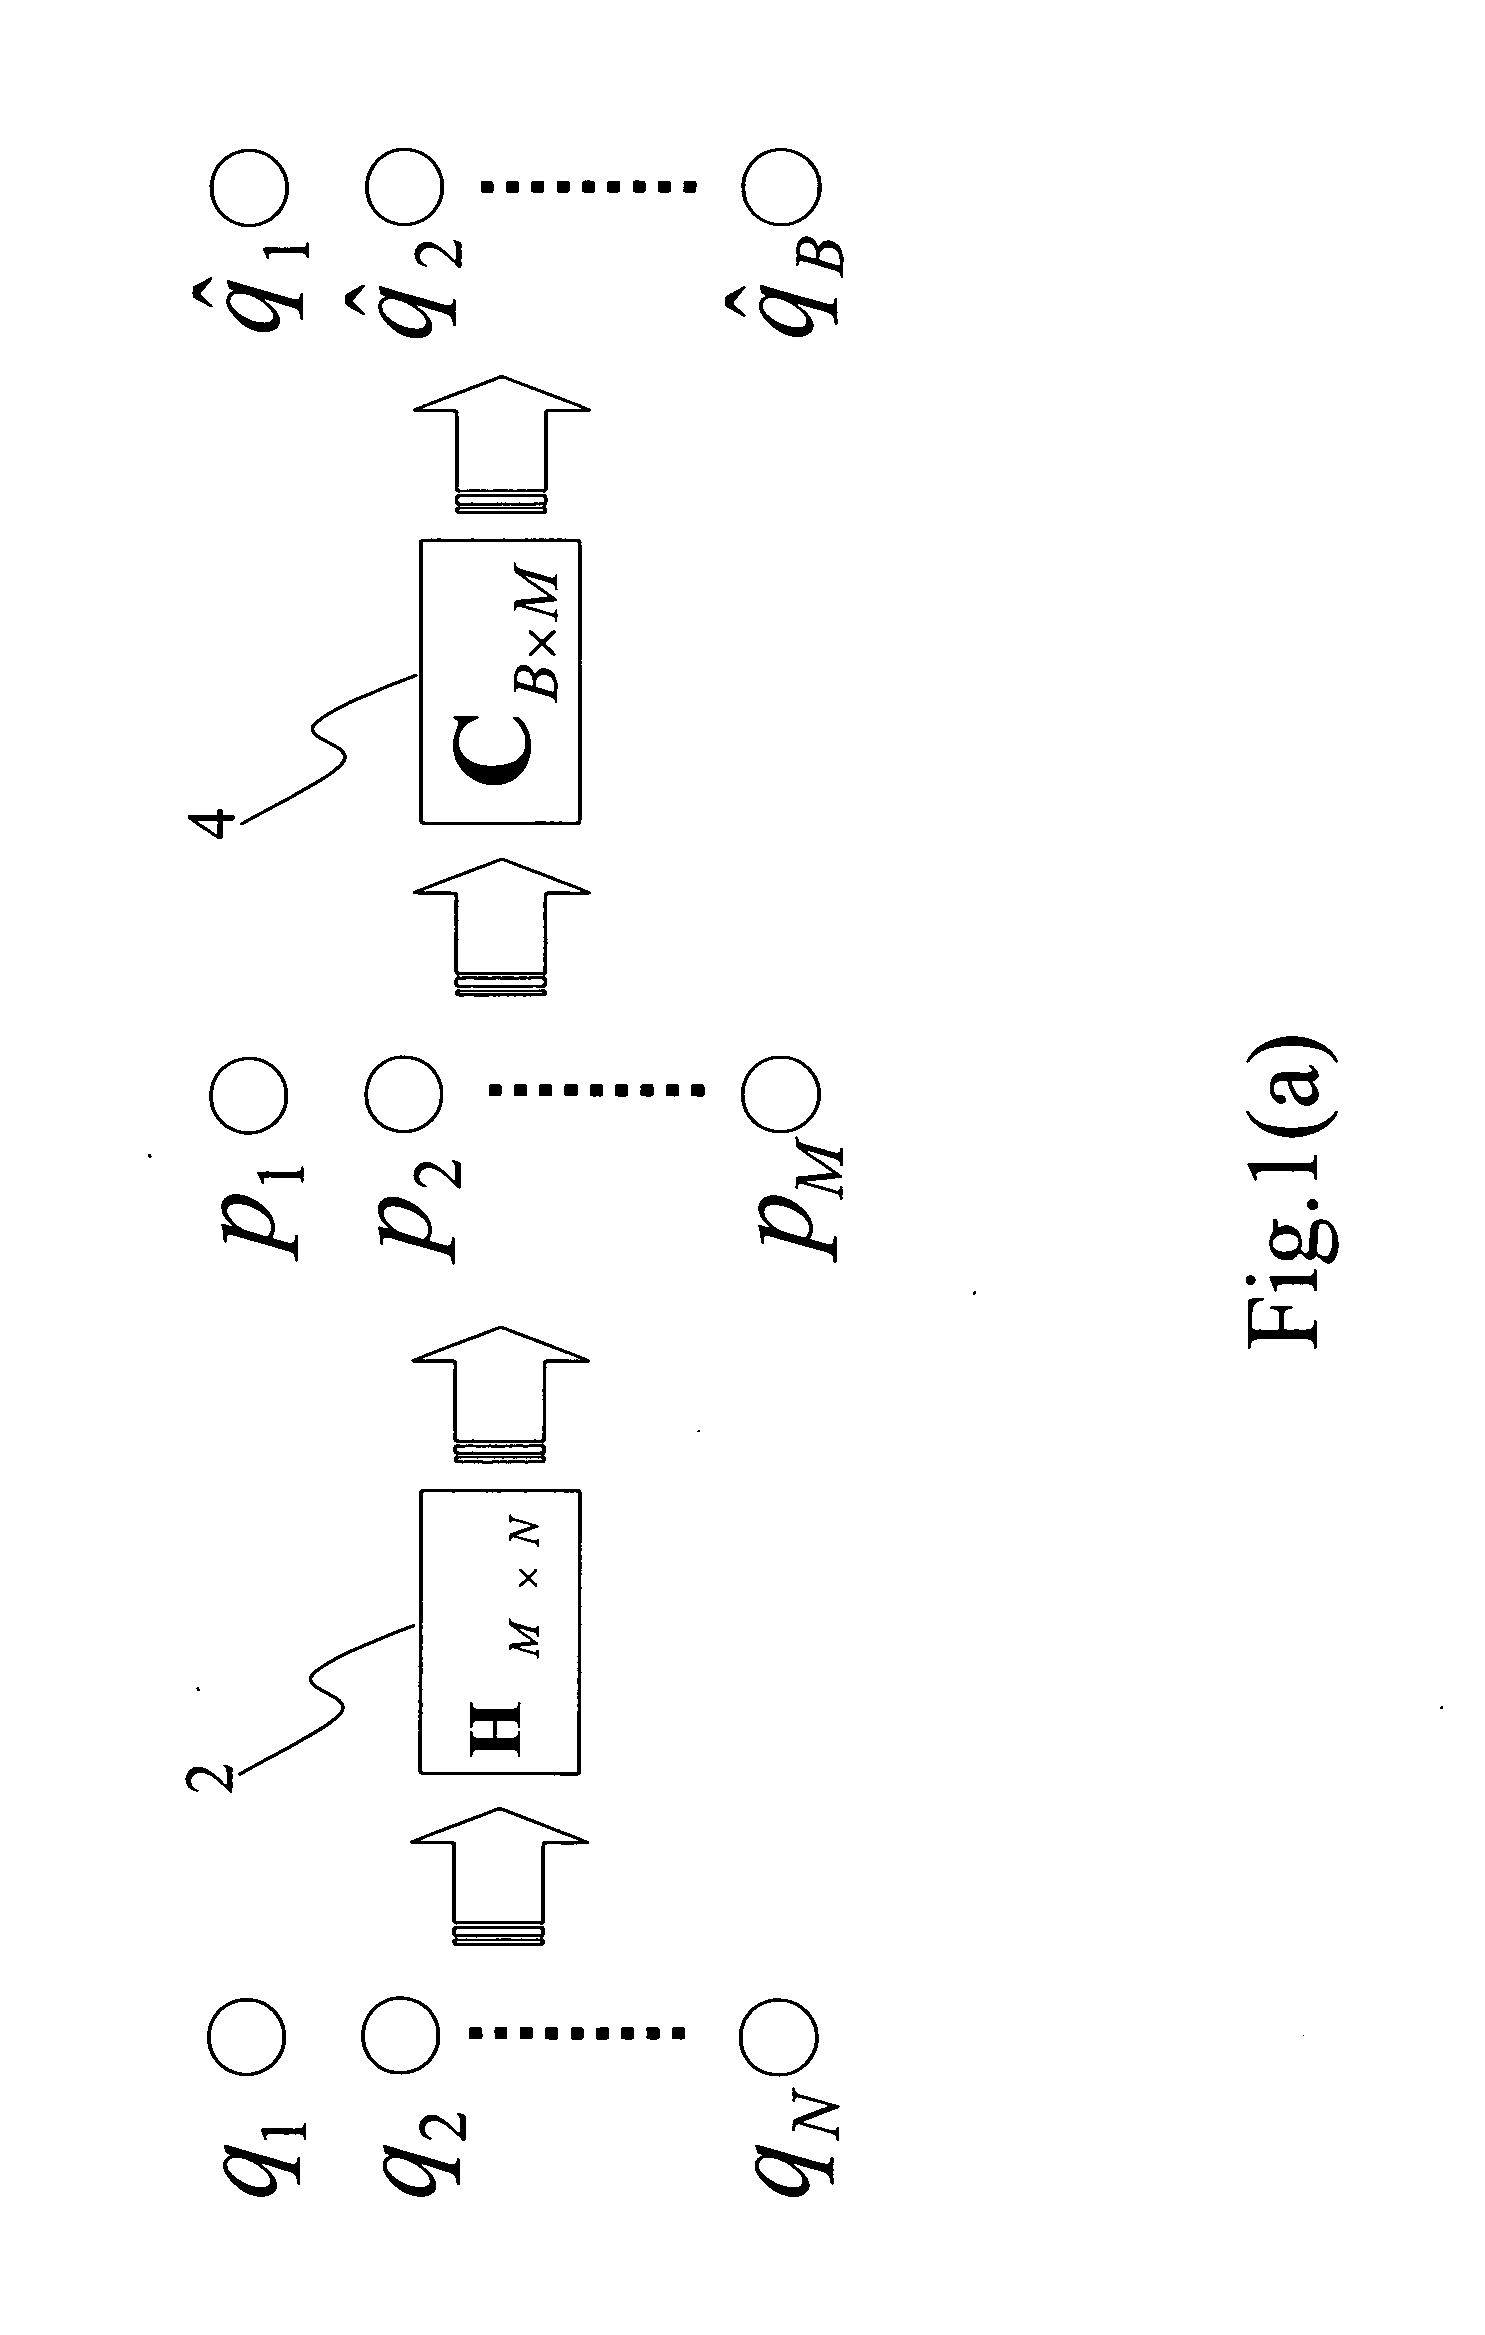
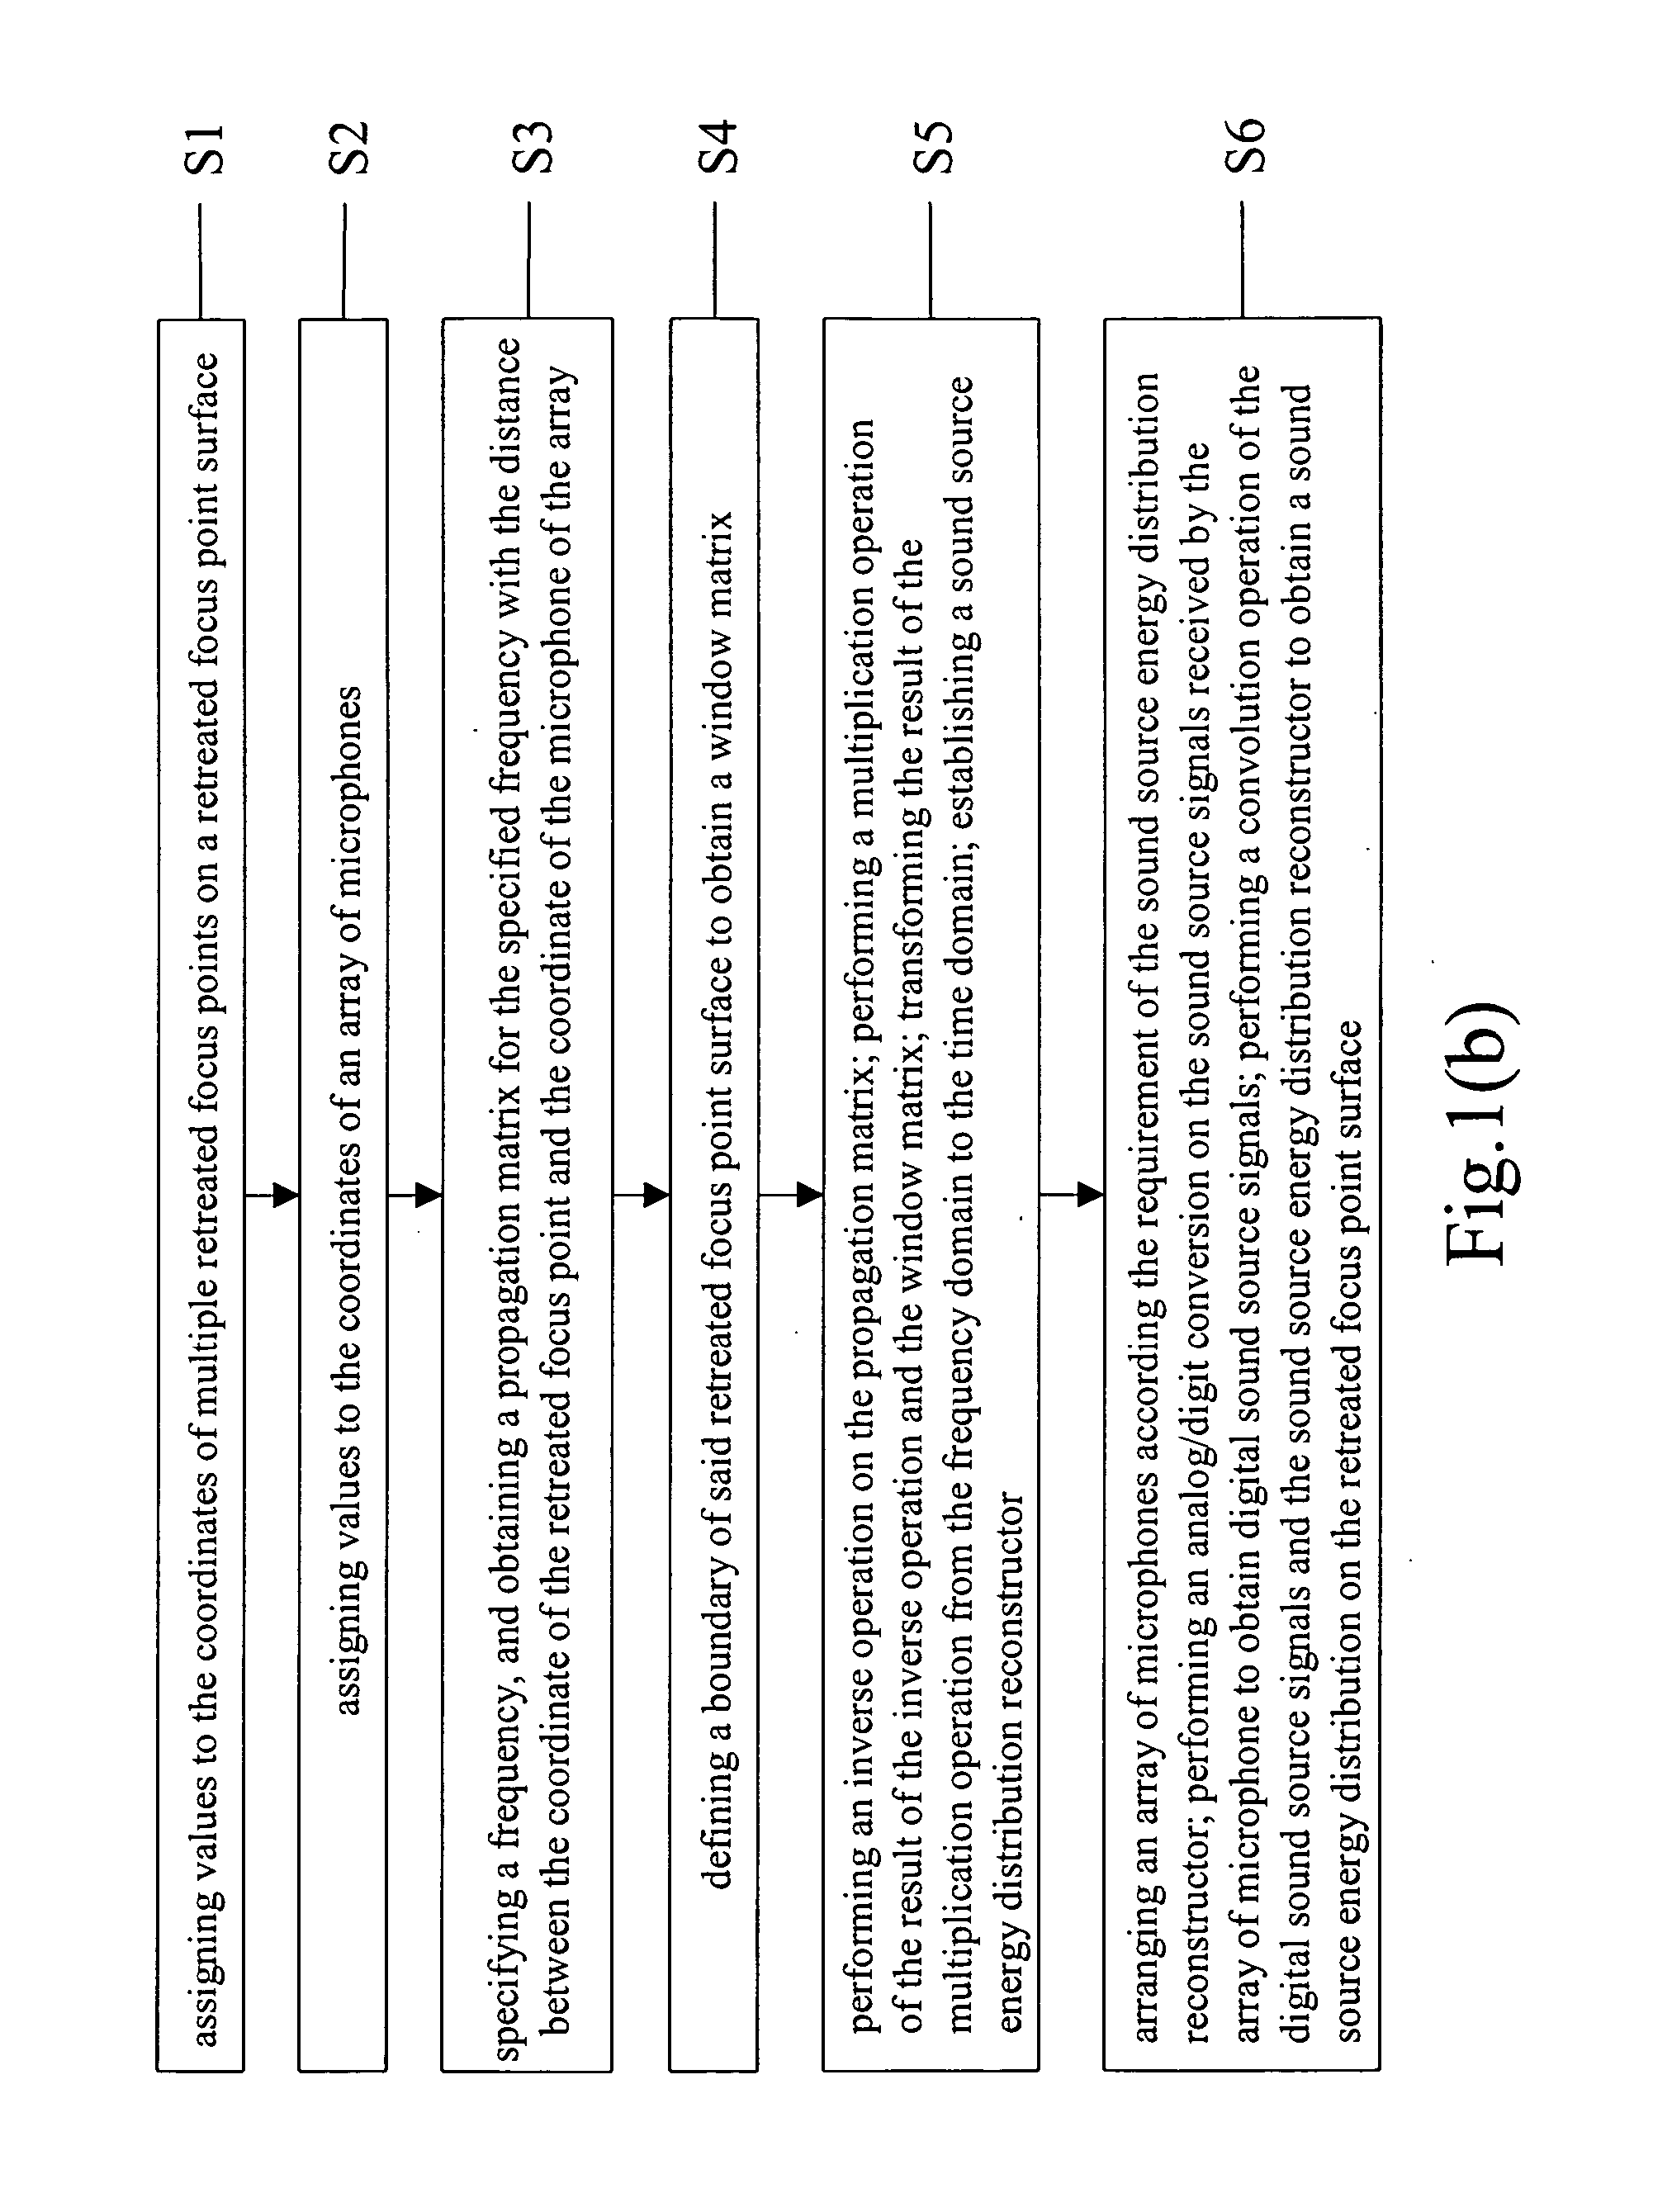
[0032] Firstly, the principle and steps of establishing a sound source energy distribution reconstructor will be described below. Refer to FIG. 1(a) and FIG. 1(b). In Step S1, values are assigned to the coordinates q1, q2 . . . qN of the retreated focus points on the retreated focus point surface, and it is supposed that multiple point sources are located at the retreated focus points. In Step S2, values are assigned to the coordinates p1, p2 . . . pM of the arrayed microphones. In Step 3, Formula (1): ⅇ-j⁢ ⁢krMNrMN(1)

is used to work out a propagation matrix (2), wherein rMN is the distance between the coordinate of the Nth retreated focus point and the coordinate of Mth in-array microphone, and k is the ...


PUM


Abstract

The present invention discloses a system for visualizing sound source energy distribution and a method thereof, wherein a propagation matrix and a window matrix are obtained firstly; next, an inverse operation of the propagation matrix is performed; next, a multiplication operation of the result of the inverse operation and the window matrix is performed; next, the result of the multiplication operation is transformed from the time domain to the frequency domain; thus, a sound source energy distribution reconstructor is established; then, an array of microphones is used to receive the sound source signals; next, a multi-channel capture device transforms the received sound source signals into digital sound source signals; lastly, a convolution operation is performed on the digital sound source signals and the sound source energy distribution reconstructor to obtain a visualized sound source energy distribution. Therefore, the present invention can provide the energy distributions of nearfield / farfield stable-state / unstable-state sound sources.

Description

BACKGROUND OF THE INVENTION [0001] 1. Field of the Invention [0002] The present invention relates to a technology for visualizing sound source energy distribution, particularly to a system utilizing an inverse operation technology to visualize sound source energy distribution and a method thereof. [0003] 2. Description of the Related Art [0004] With the advance of science and technology, people demand higher and higher living-environment quality. However, the living environment is full of the noise induced by structural vibration, which may cause physiological and psychological problems. [0005] The effect of noise control correlates closely with the correctness of positioning and identifying noise sources. Therefore, it is essential for noise control to accurately trace and correctly identify the sources of noise. Only after the position, source strength distribution, particle velocity distribution, and intensity distribution of a structural-vibration-induced noise have been obtaine...

Claims


Application Information

Patent Timeline
Patent Type & Authority Applications(United States)
IPC IPC(8): H04R29/00H03G3/00G06F17/00
CPCG01H3/125H04R1/406H04R2201/403H04R2201/401H04R29/005
Inventor BAI, MINGSIAN R.LIN, JIA-HONGNING, YU-WEI
Owner NAT CHIAO TUNG UNIV
Learn More