Over time, the efficiency of the transit network can begin to suffer if the elements of the network are not properly optimized, in particular the determination of transit routes and allocation of drivers and vehicles to these routes.
Particularly in North America, the
population continues to rely heavily on individual automobiles for transportation, and the change to widespread use of public (
mass) transit has been slow in coming.
As a result, major metropolitan areas, such as Los Angeles, Calif. and Toronto, Ontario, find themselves dealing with a serious two-pronged issue of
pollution and
traffic congestion before even considering the socio-economic
impact of institutionalized automobile use.
The continued reliance on individual automobiles has hindered progress in addressing the environmental issues created by these vehicles.
Currently, the vast majority of automobiles operate on
gasoline-powered internal
combustion engines, which produce measurable amounts of airborne pollutants while operating.
In addition,
spillage and leakage of the fuels and lubricants used in these engines leads to soil and
water pollution.
In addition to environmental issues raised by the use of individual automobiles, there are also socio-economic issues.
The cost of even a single automobile becomes a substantial financial burden when the totals costs of financing, fuel, insurance, maintenance, repair and parking are factored in.
Also, the costs of maintaining the road and highway infrastructure to meet the demands of the volume of automobile traffic using these roads and highways represent a major public expense, whose cost is passed on to individuals in the form of taxes and tolls.
As another result of the widespread use of individual automobiles, the development of infrastructure necessary for a successful public
transit system is inhibited.
The parking requirements for users of retail and commercial building space often limit
accessibility by public transit.
In
low density urban and suburban areas where individual automobiles are most common, this problem is greater, making public transit less efficient and useful in those areas where it would be of the greatest benefit.
Rail systems often have a large ridership in areas with a
high population density, however, the costs of
purchasing land and constructing tracks tend to prohibit expansion of these systems on a wider scale.
In addition, rail systems that service areas of lower
population density, such as suburban-downtown commuter trains, are incomplete solutions as the users are still required to travel to and from the rail stations to their final destinations.
Unfortunately, buses suffer from the limitation of operating on the same roads and highways that are used by individual automobiles, making scheduling and adhering to schedules very difficult.
Also, buses contribute somewhat to existing traffic problems when operating in high-traffic areas due to their size and operating characteristics.
Another problem in areas with a low
population density is that stop locations are often widely spaced and may not be conveniently accessed by all potential users.
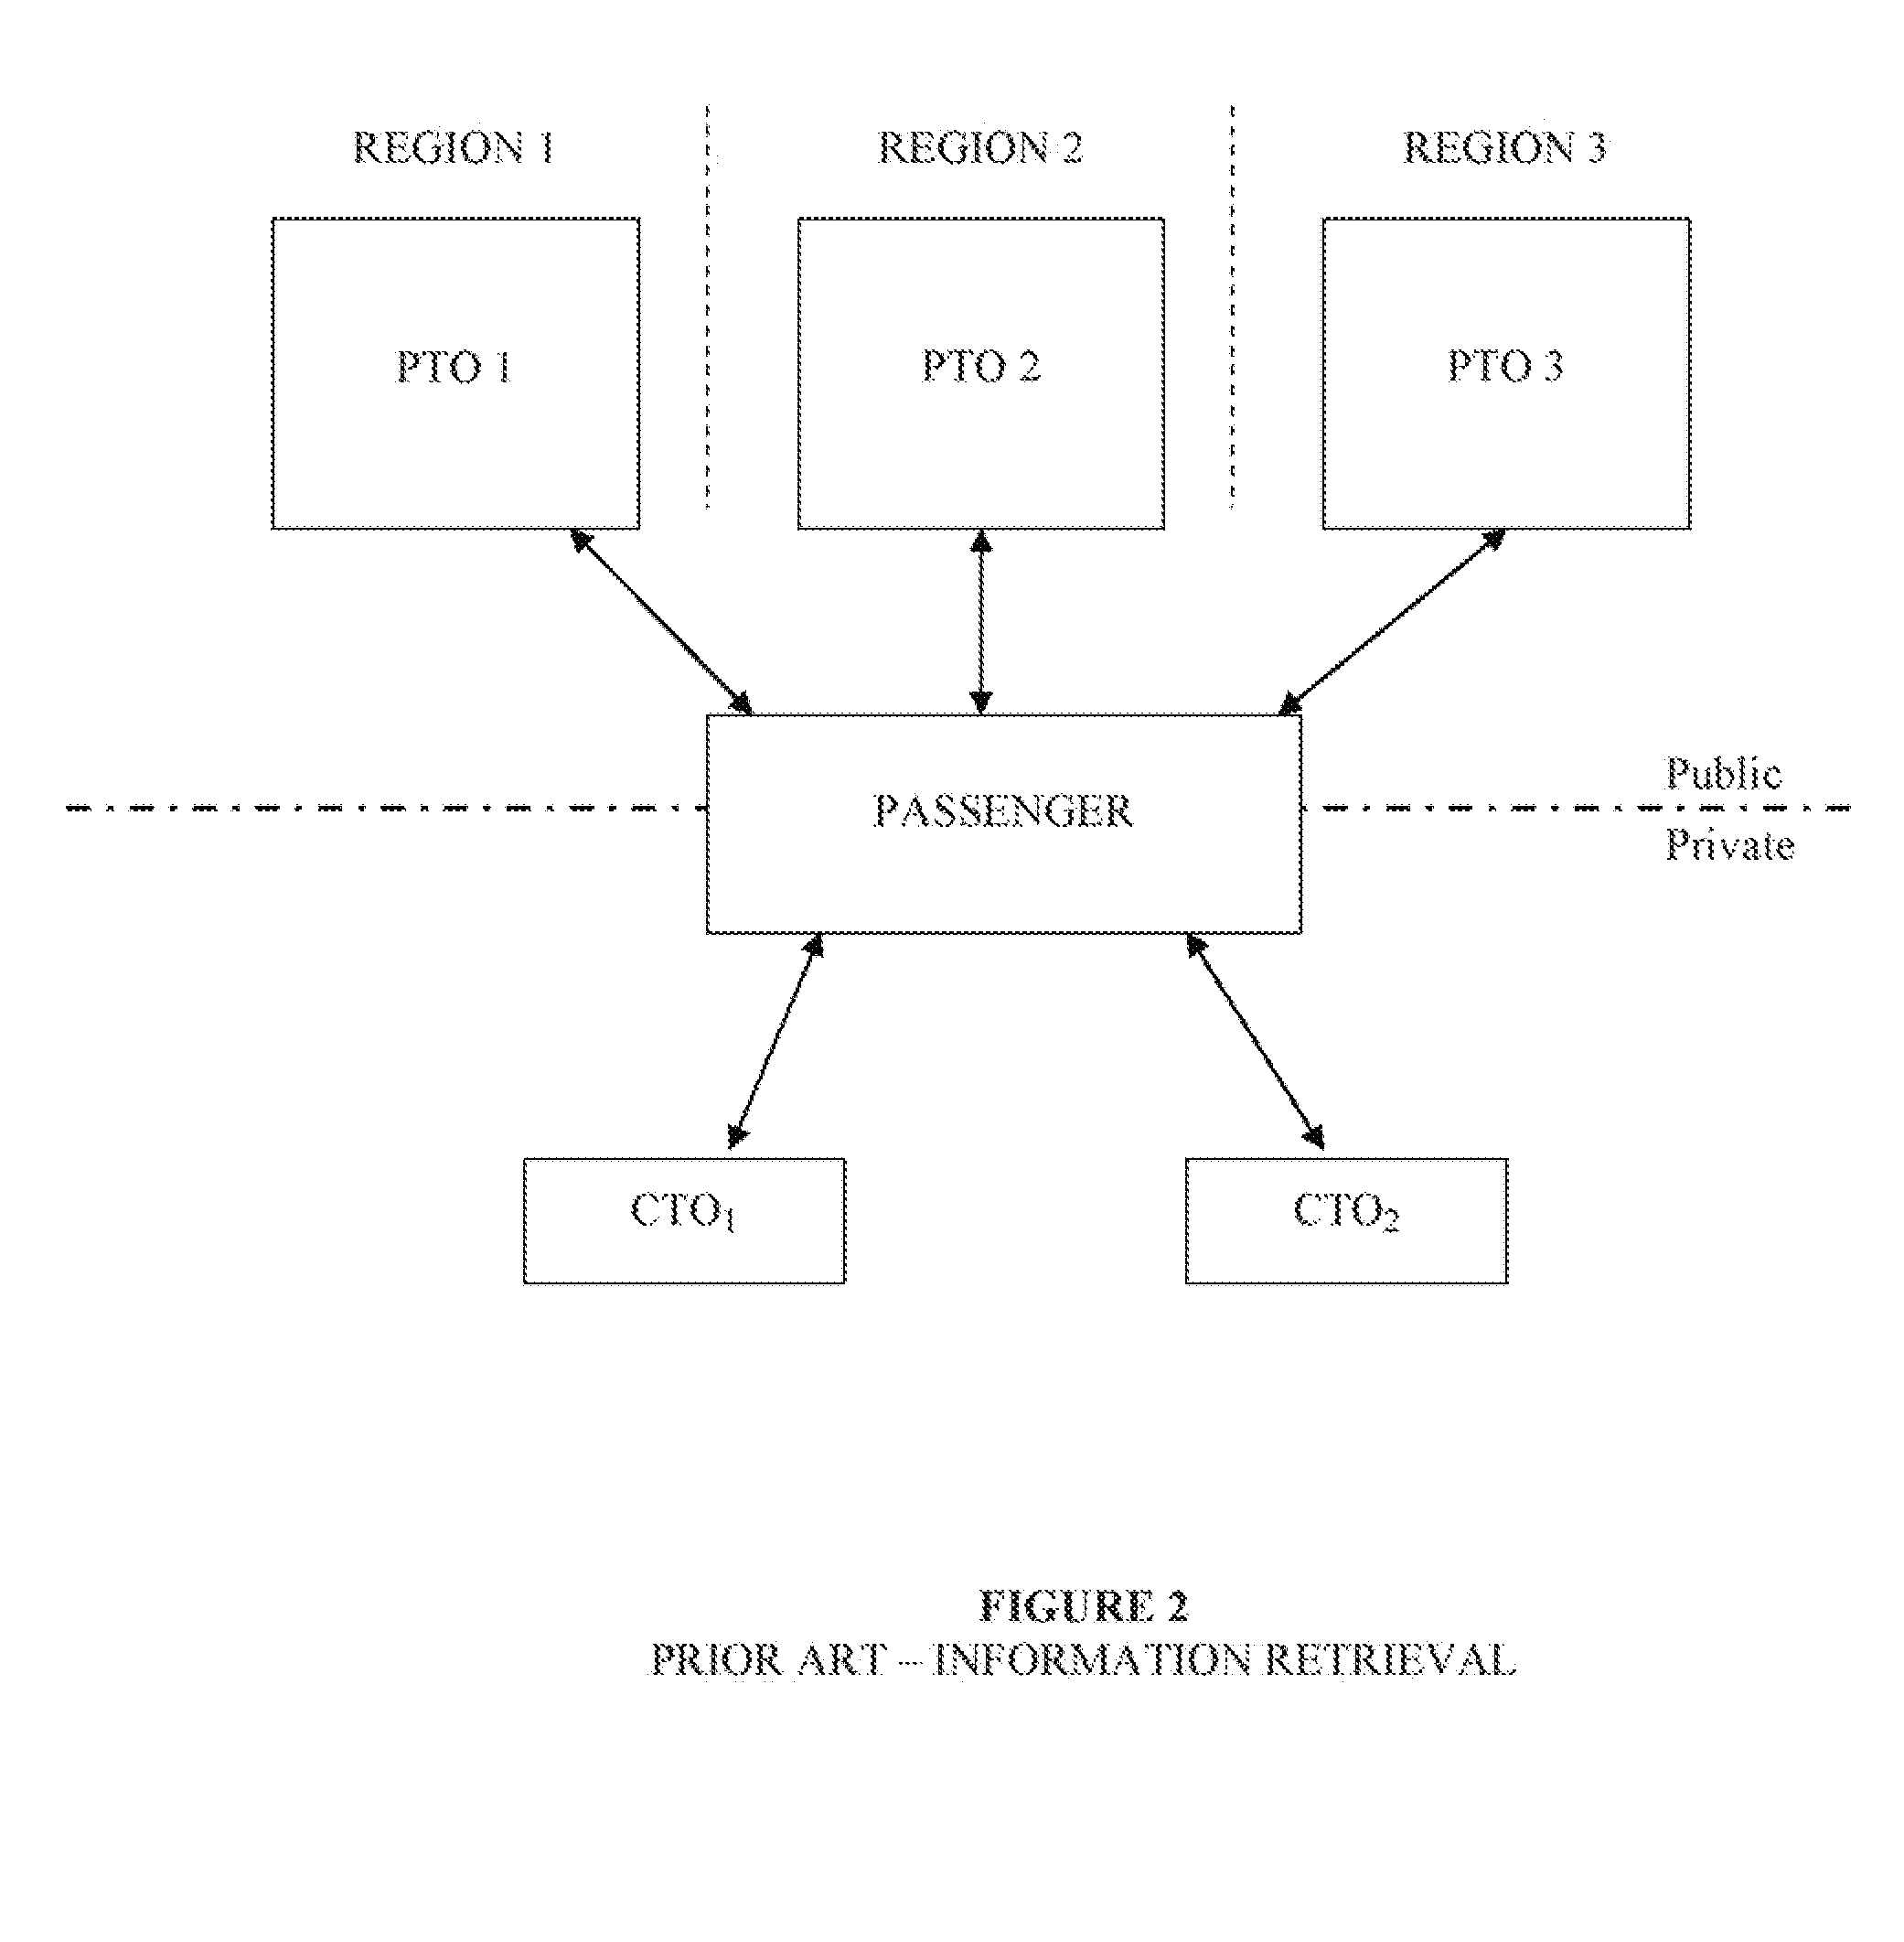
Coordinating transfers, especially where the user is changing between vehicles operated by different transit operators, is another problem.
The result is that currently the majority of the population do not use public transit as it does not present an efficient solution to their transportation needs.
Although public transit is less expensive, sometimes substantially, than an automobile, the inconveniences and inefficiencies in access and scheduling prevent many potential users from considering public transit as an option.
In the face of shrinking budgets and growing demand for public transportation, transit agencies are struggling to find every possible efficiency and incremental productivity increase to stretch their resources.
GIS requires a high level of technical knowledge that may not be available to many agencies.
Another problem is that for true optimization of a transit network all the potential network considerations must be factored in.
To date, optimization methods have focused on one particular consideration or another, deeming the whole to be too complex or contain unnecessary considerations.
Many transit planning departments are well-equipped to gather data for these considerations; however, very few have the tools needed to analyze the data so as to optimize their operations.
What is much harder to do is to apply this information to the task of transporting people.
The problem with many GIS tools, particularly for smaller agencies, is that they require advanced spatial and
statistical analysis skills that may not be available or affordable.
There are, of course, data that cannot be analyzed spatially, including
temporal information such as schedules, work and pay rules and budgets.
Despite this progress, studies have shown that the perceived or actual difficulty of obtaining information remains a key impediment to wider use of transit services.
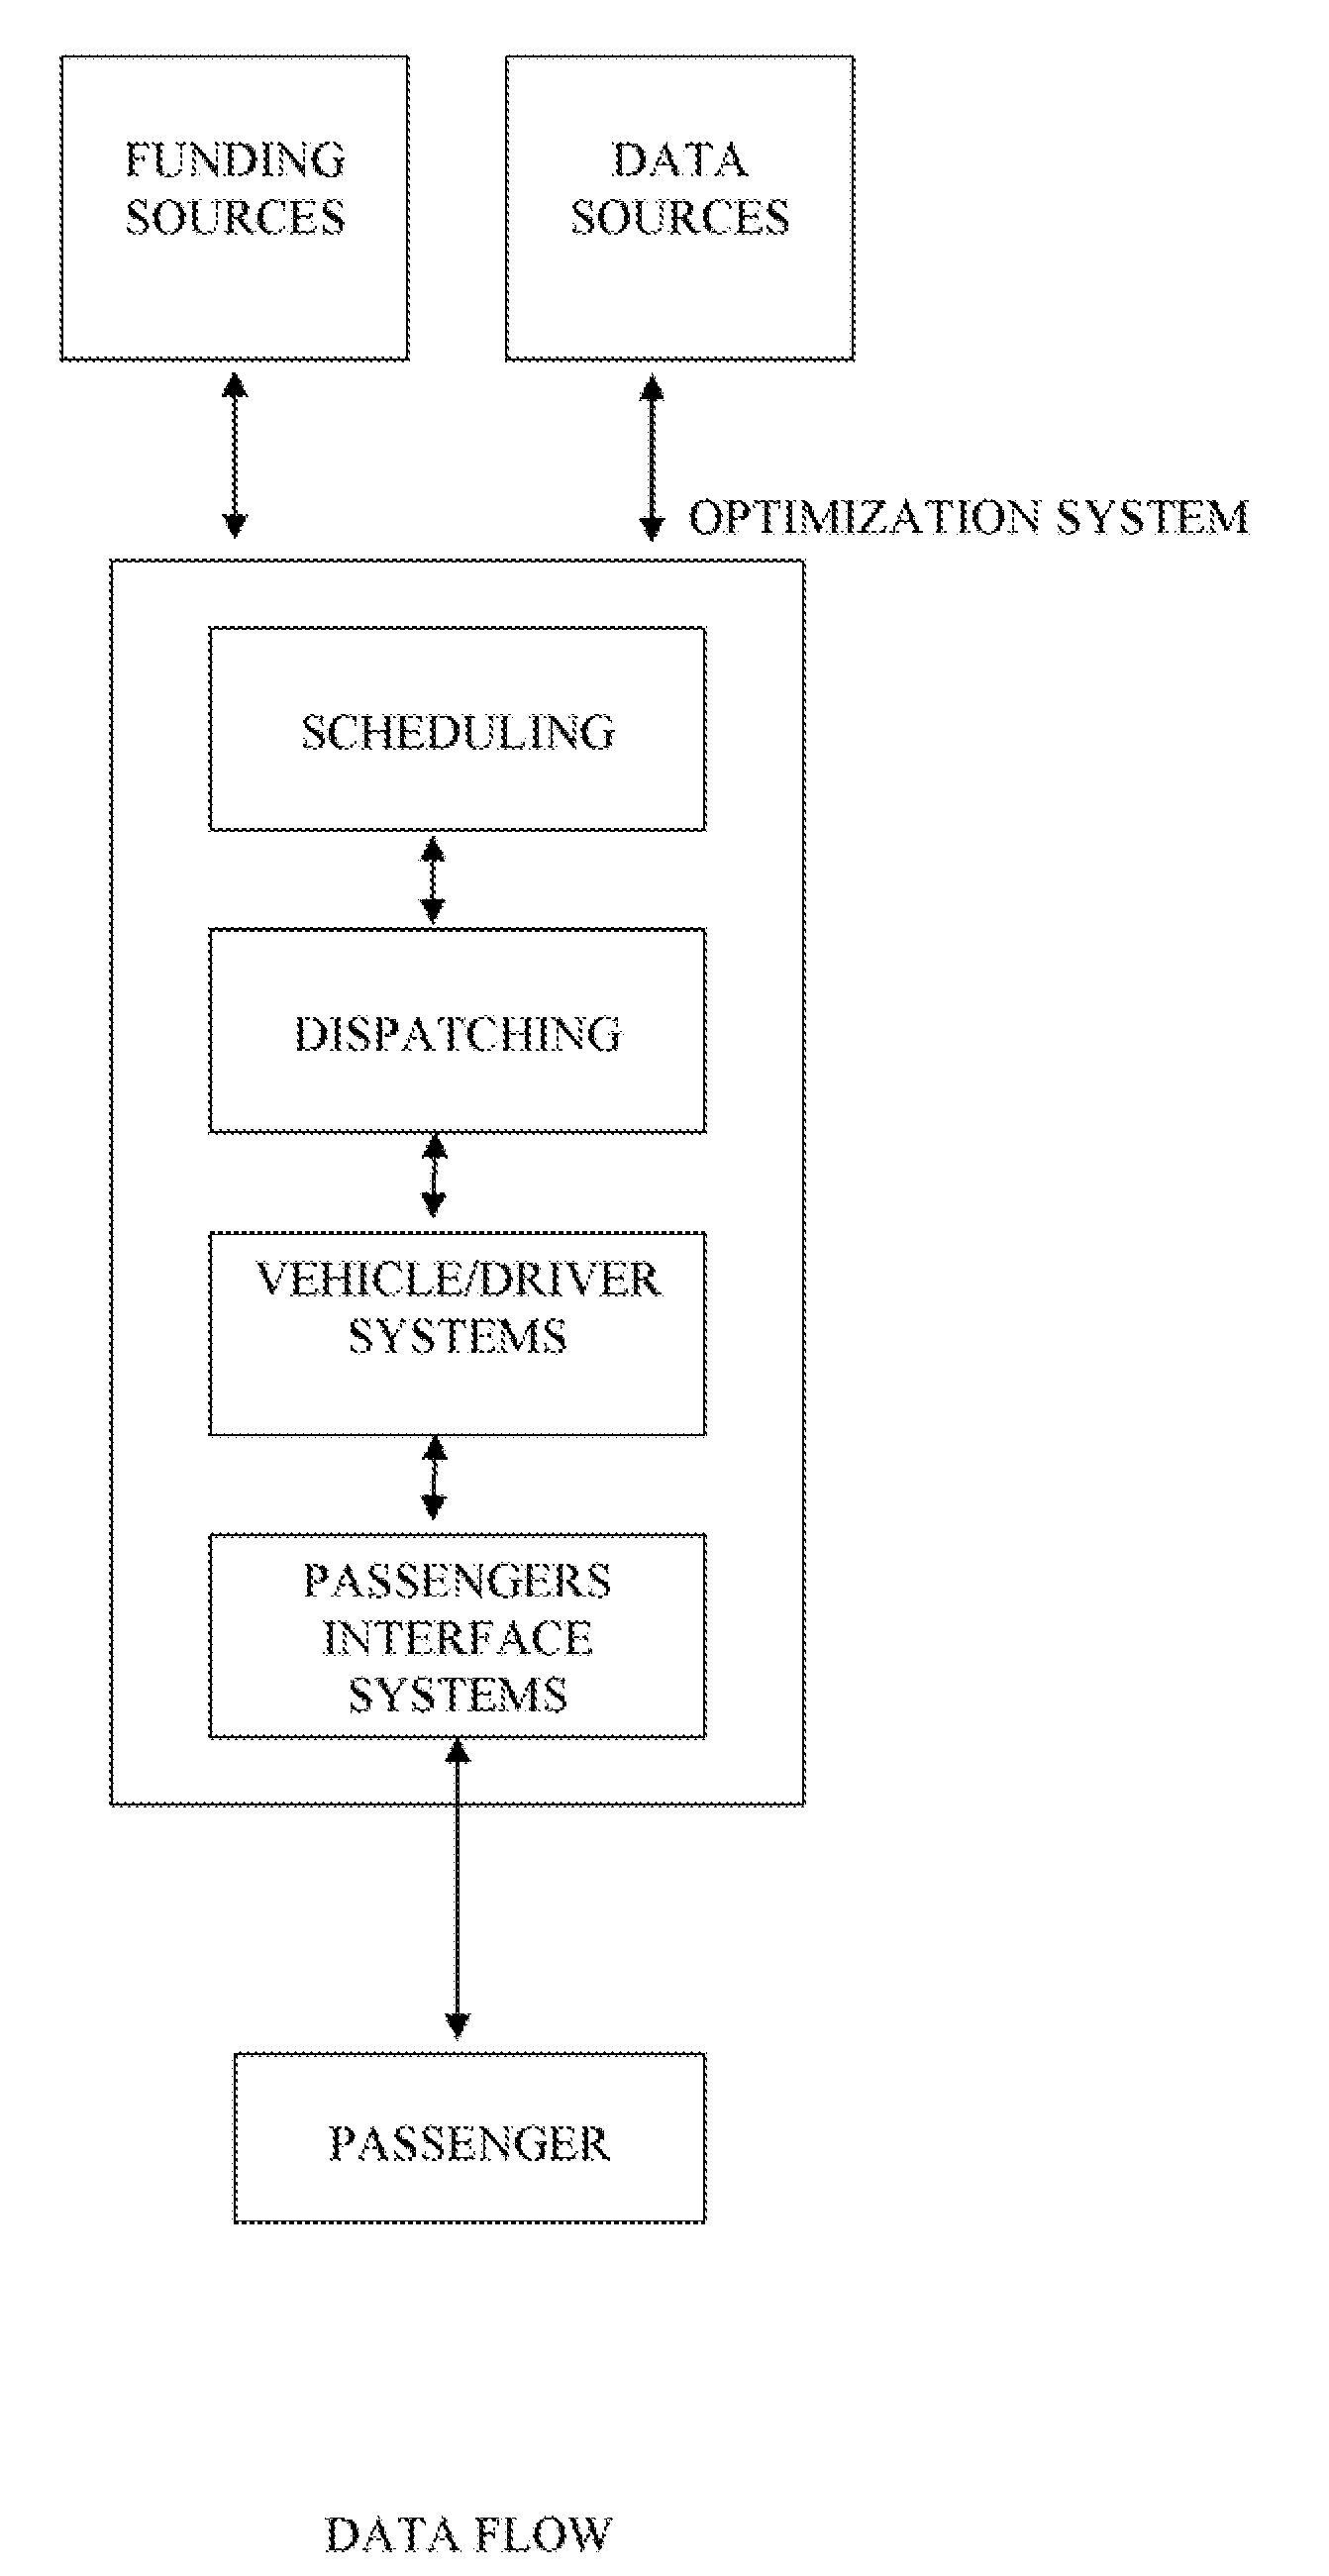
Technological challenges arise out of the need to build an integrated solution from disparate parts.
To further complicate matters, while many larger operators maintain detailed information about the vehicles, routes, and
bus stops, smaller operators may have this data only on paper, if at all.
An
information system must be designed to accommodate many disparate operational and technological environments; the
software cannot impose a single solution on agencies with different characteristics, nor should it matter what kind of scheduling and mapping
software the data come from.
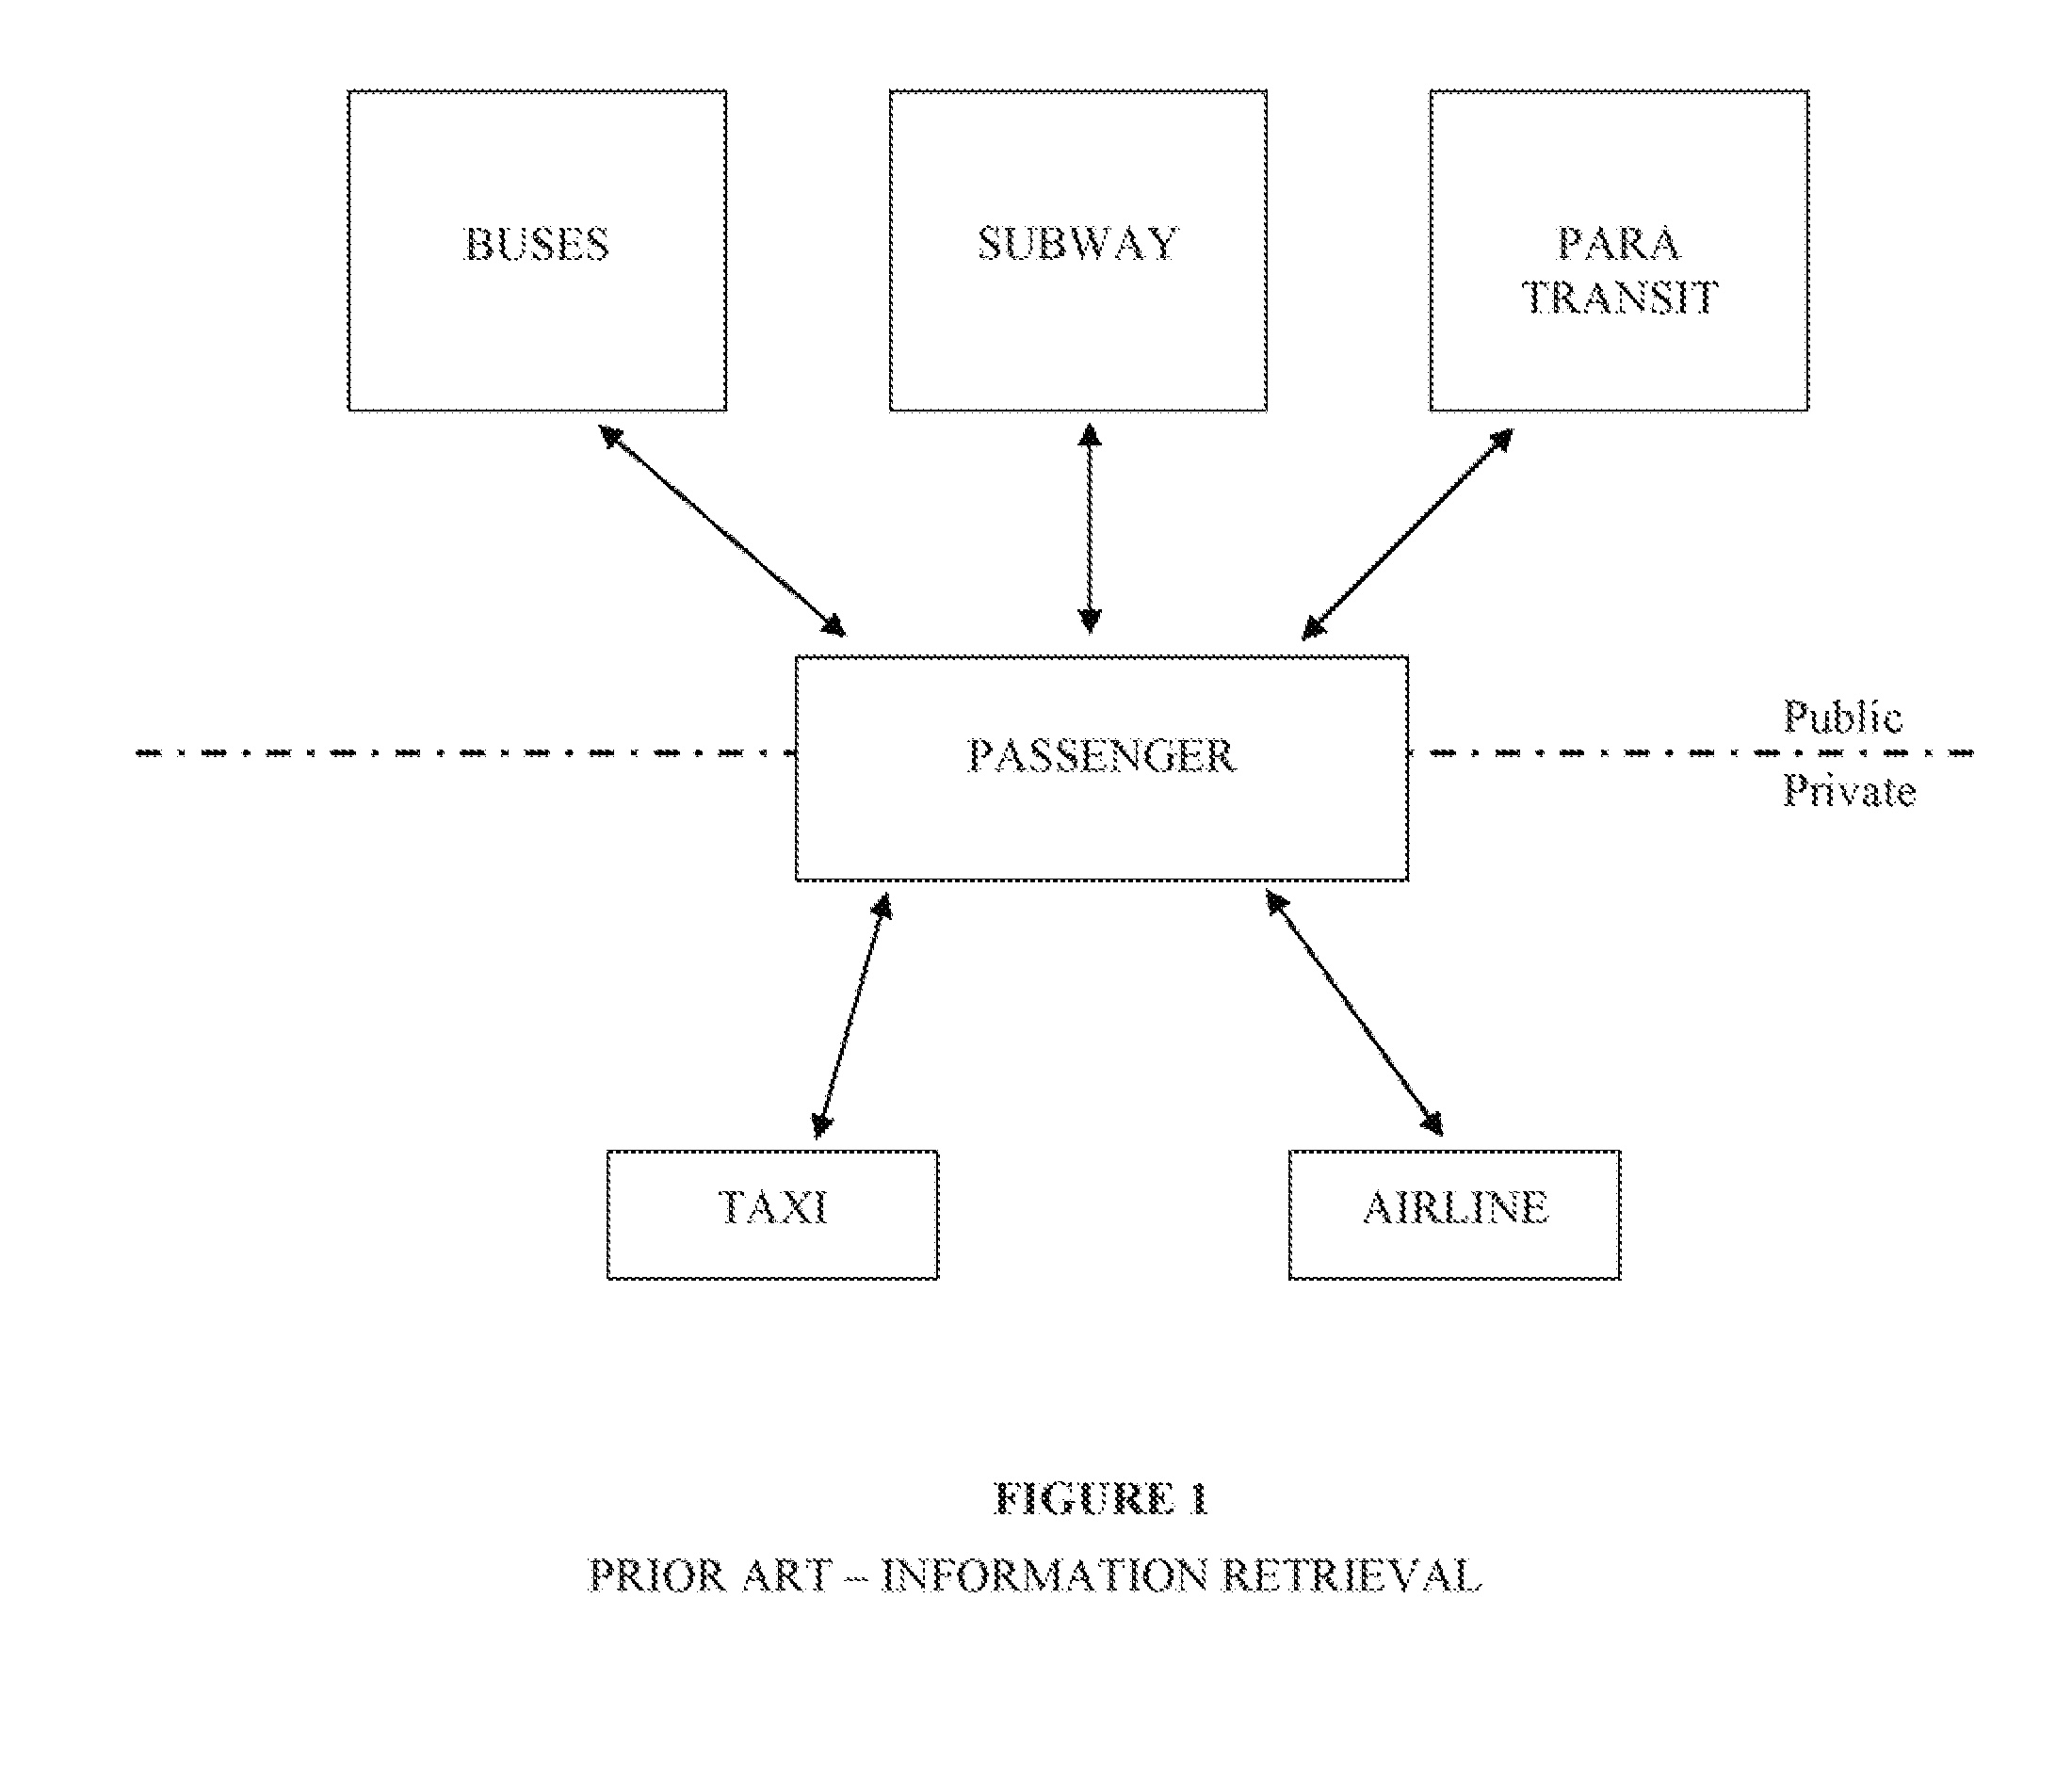
However, with no integration of data and services, these systems do not “talk” to one another, and it falls to the passenger to determine how the services connect and when and where transfers between the services take place.
Furthermore, PTOs miss out on the opportunity to participate in a regional transportation network, and smaller services may lack the resources to extend their delivery beyond a basic call center.

