
Method of physiological data analysis and measurement quality check using principal component analysis

a technology of physiological data and principal component analysis, applied in the field of physiological data analysis, can solve the problems of daunting task, complicated measurement of q-t interval and calculation of q

Active Publication Date: 2008-06-05
GENERAL ELECTRIC CO
View PDF7 Cites 49 Cited by
  • Summary
  • Abstract
  • Description
  • Claims
  • Application Information

AI Technical Summary

Benefits of technology

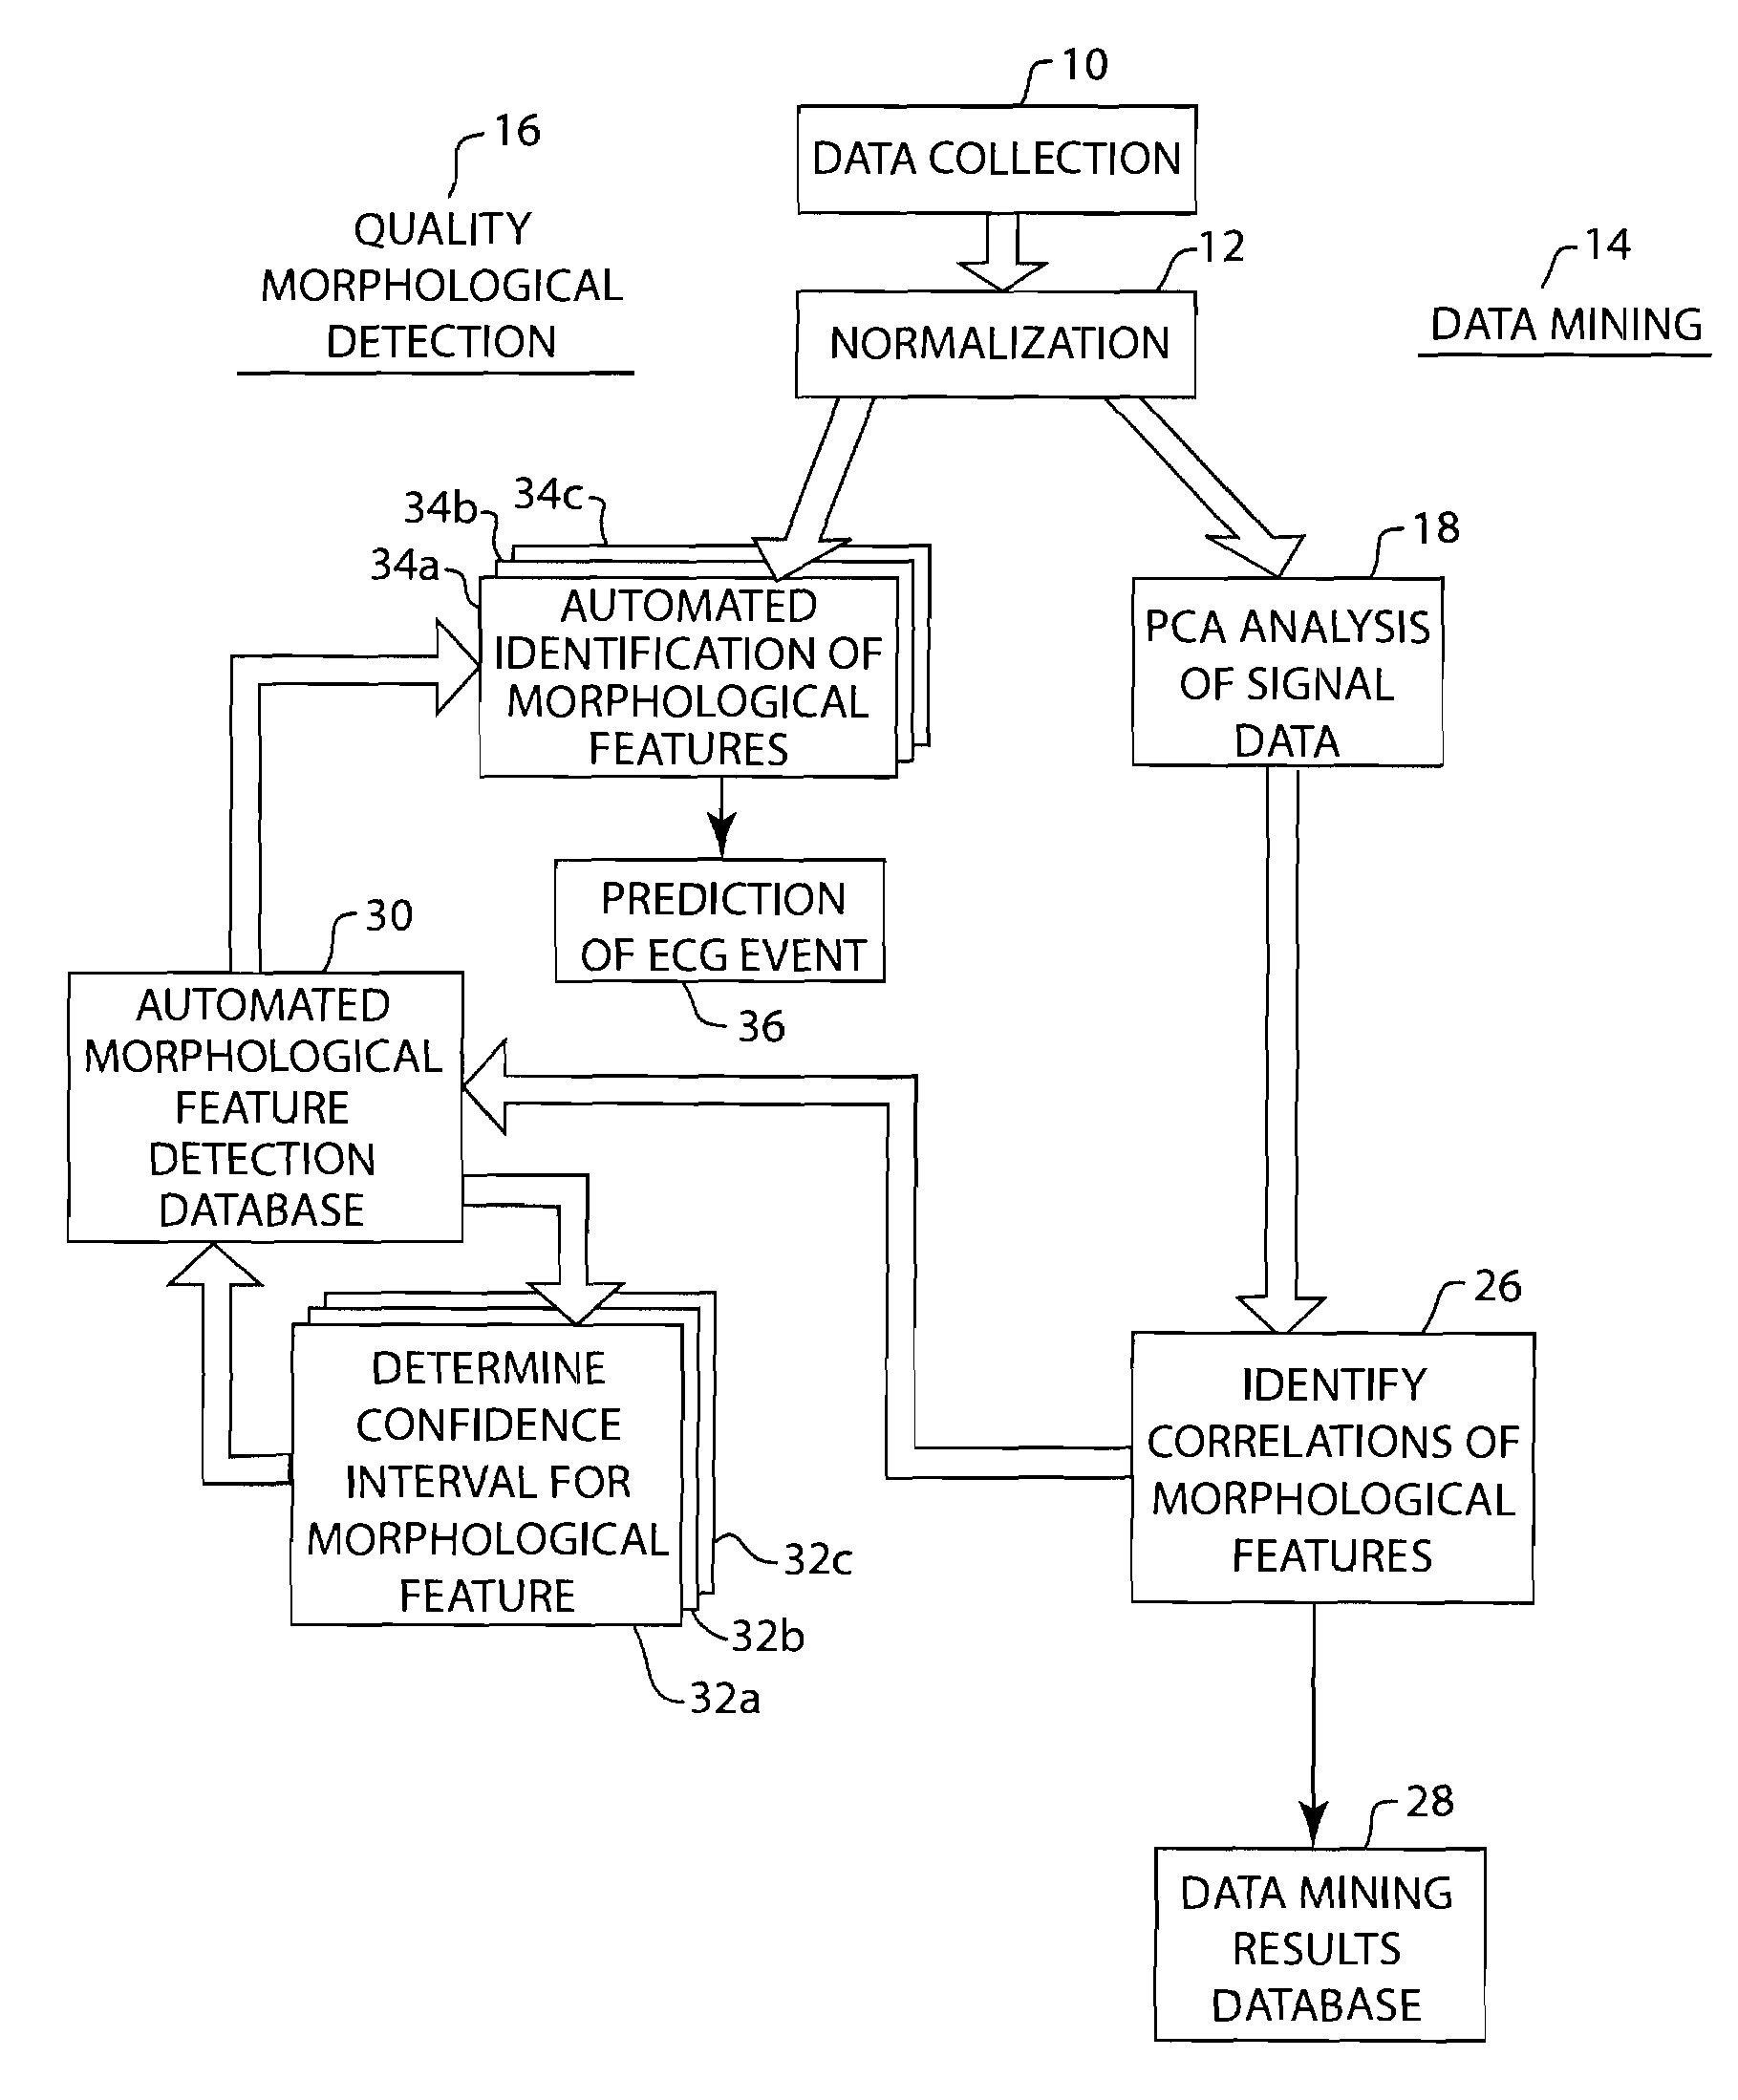
[0008]The present invention provides a method for providing, in a pharmaceutical drug trial and other applications, an accurate measurement of the Q-T interval as well as the ability to find new ECG morphological features that might serve as a better indication of drug induced TdP.
[0012]In a further feature of the present invention, the collected ECG information is sent to an ECG reference library database, thereby updating the database and allowing the database to “learn” as the analysis of additional collected ECG signals proceeds.

Problems solved by technology

The measurement of Q-T interval and the calculation of QTc are complicated by the hysteresis effect of heart rate within a heart cycle.
However the magnitude and complexity of data that must be analyzed to identify correlative features makes this a daunting task.

Method used


Image

  • Method of physiological data analysis and measurement quality check using principal component analysis
  • Method of physiological data analysis and measurement quality check using principal component analysis
  • Method of physiological data analysis and measurement quality check using principal component analysis

Examples


Embodiment Construction

[0021]While the present invention is described using a determination of Q-T interval and a group of morphological features for exemplary purposes, it is understood that the method of the present invention is not so limited, but rather may be used for the determination of new morphological features of any relevant physiological signal, such as electromyography (EMG) and electroencepholography (EEG). A physiological signal comprising an electrocardiogram (ECG) is used in the description of the present invention as an example.

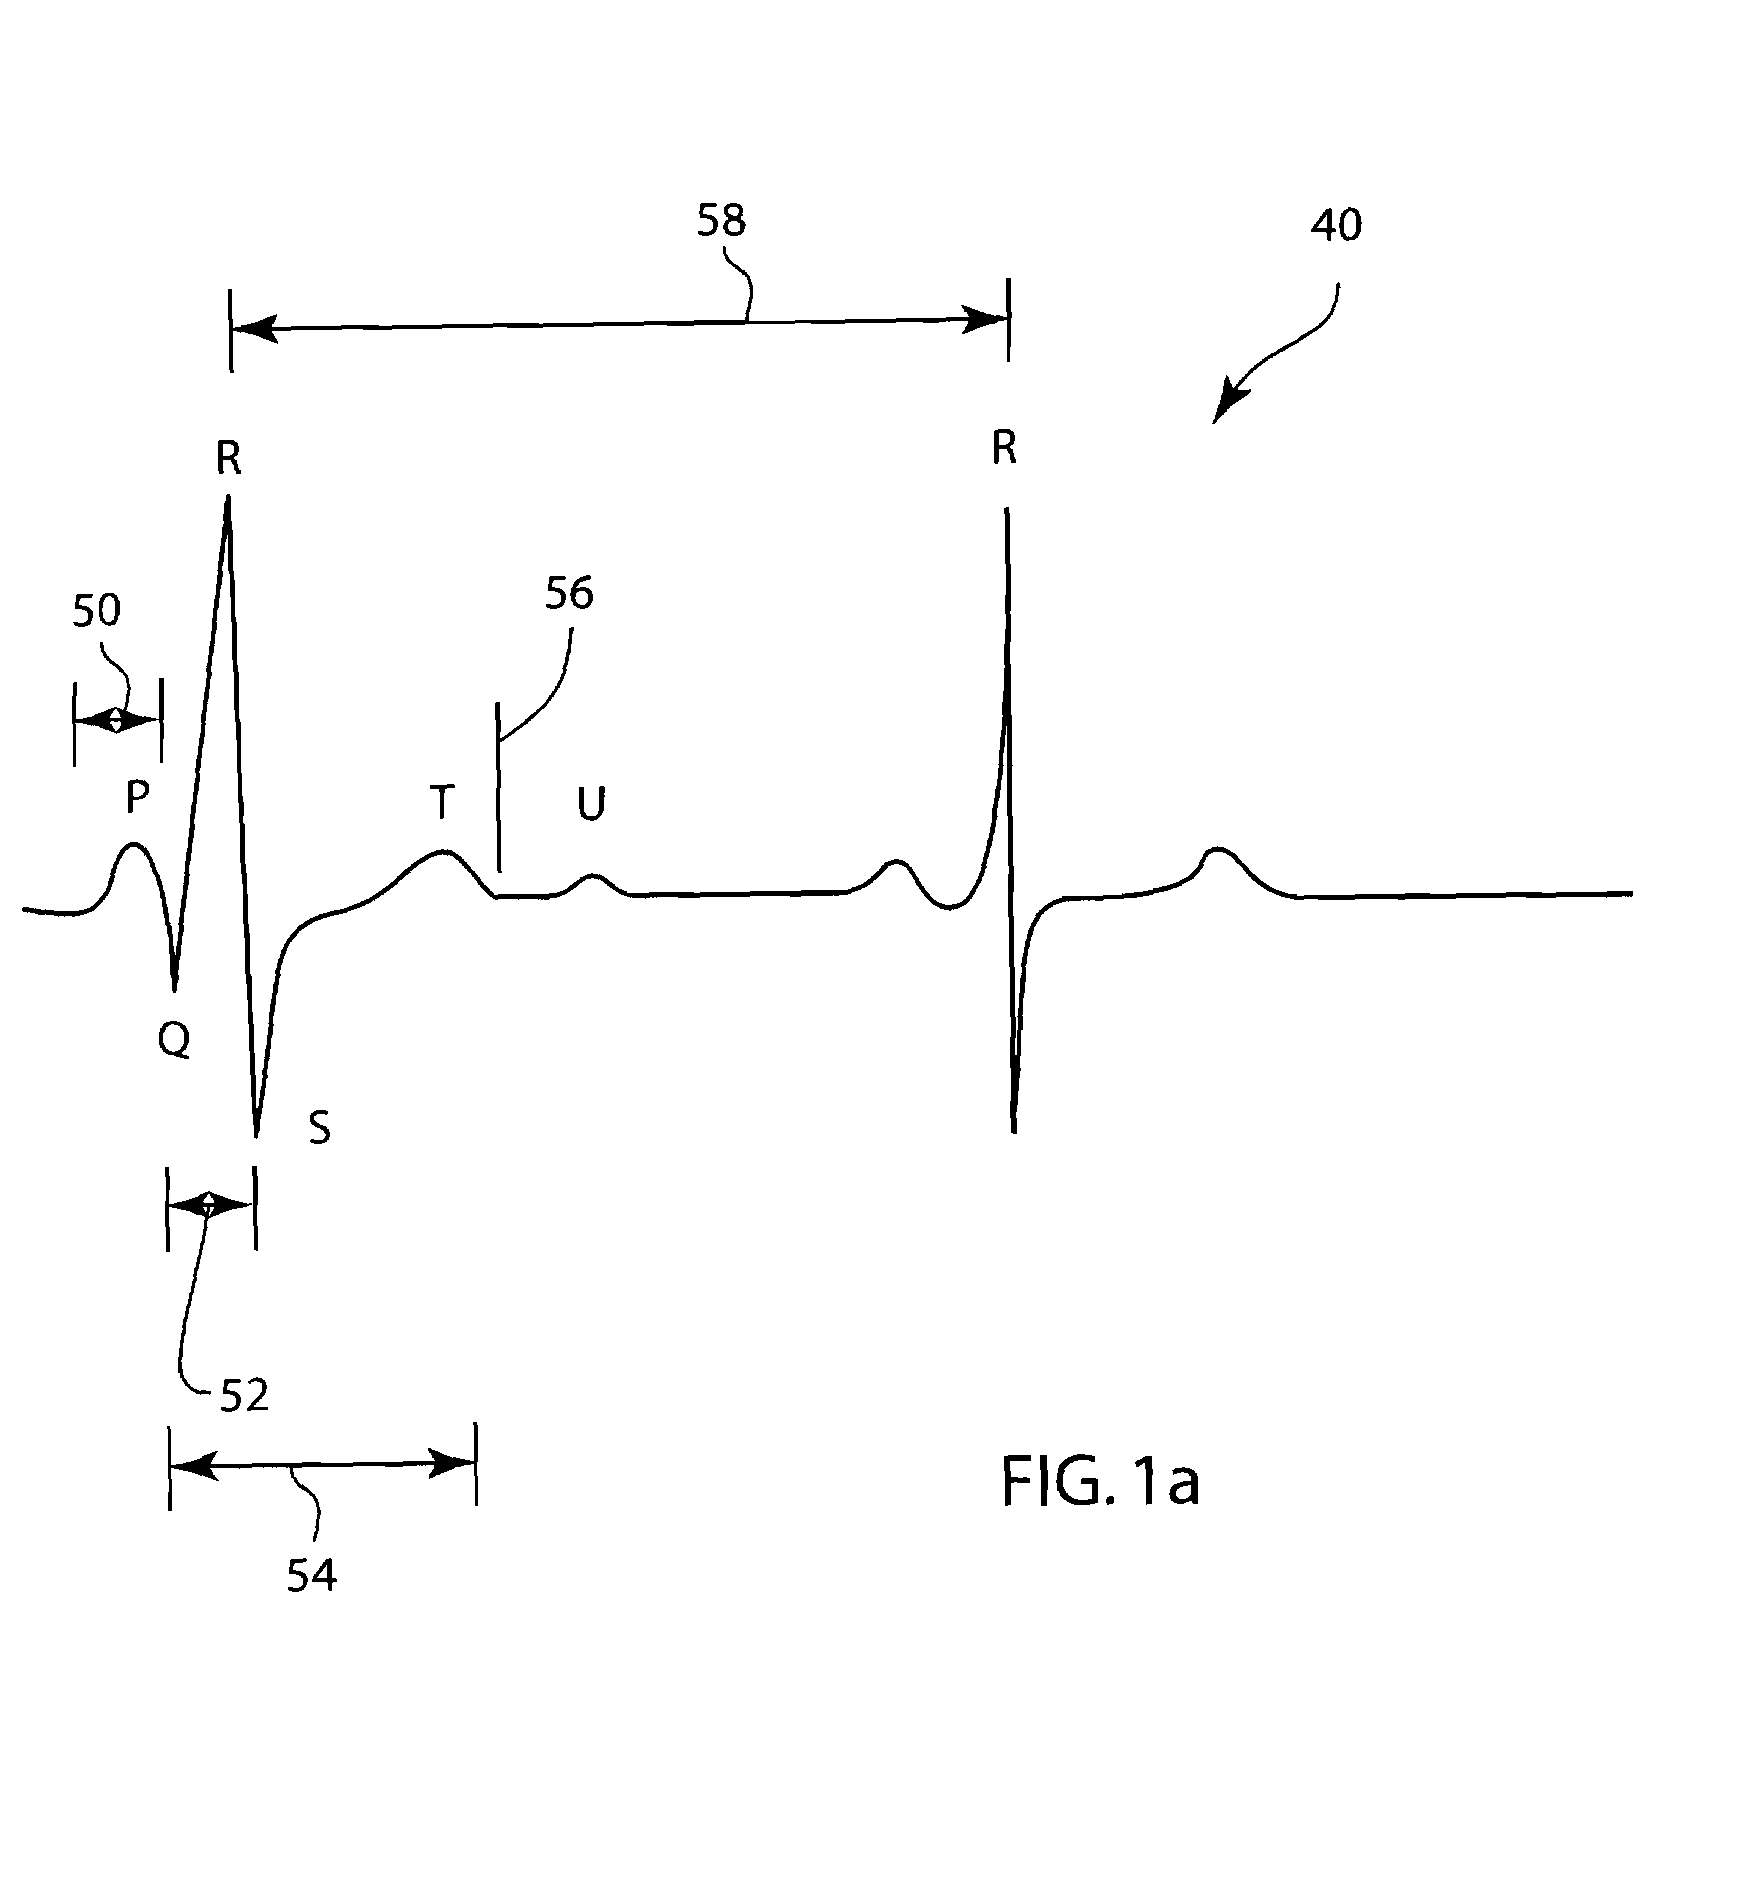
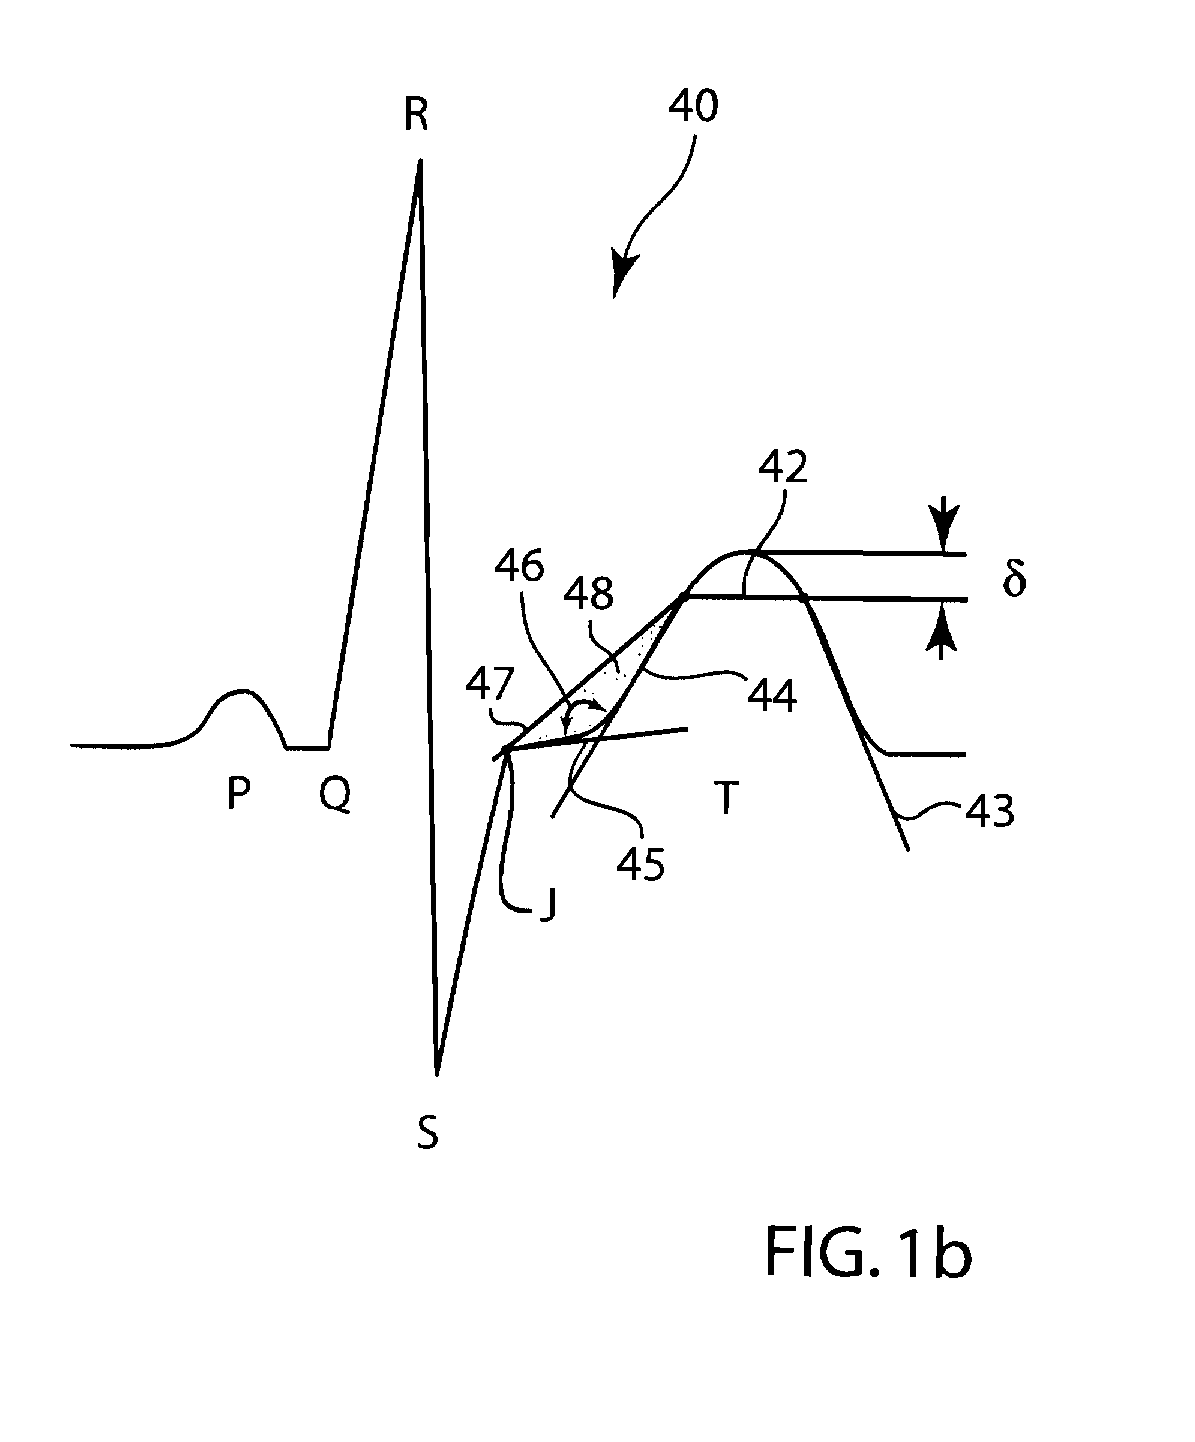
[0022]FIG. 1a depicts a generalized ECG signal 40 with indications of some of the widely recognized morphological features that may be used in the data mining or automatic morphological detection aspects of the present invention. Many of the morphological features of an ECG signal 40 are related to the cyclical depolarization and repolarization of specific regions of the heart that characterize the contraction and relaxation phases of a cyclical heartbeat. The P-w...


PUM


Abstract

In a method of analyzing patient physiological data, the data is subjected to principal component analysis and compared to a model physiological data principal component analysis. The comparison is used to identify correlations present in the morphology of the patient physiological data. The present invention further includes determining a confidence interval for the detection of a morphological feature and utilizing this confidence interval for improving the quality of the detection of morphological features of the patient physiological data, including automated morphological feature identification.

Description

FIELD OF THE INVENTION[0001]The present invention relates to the analysis of physiological data, for example cardiographic data. More specifically, the present invention relates to a technique for identifying features of the data that are predictive of events, typically future events, in the physiological function of a patient. Such identification of features in a collection of data is often termed “data mining”. The technique of the present invention may also be used to improve quality control in automated physiological data analysis and may be used in pharmaceutical testing to be reported to a regulatory agency.BACKGROUND OF THE INVENTION[0002]Before a new drug may be marketed to the public, the Food and Drug Administration (FDA) requires that the drug be proven safe and efficacious for its intended purpose. This required proof necessitates that extensive testing and trials of a new drug be made and the results reported to the FDA before the drug may gain regulatory approval to be...

Claims


Application Information

Patent Timeline
IPC IPC(8): A61B5/0402A61B5/366
CPCG06F19/3443A61B5/04012G16H50/70A61B5/316
Inventor XUE, JOEL QUIZHEN
Owner GENERAL ELECTRIC CO
Learn More