Weighted Scoring Methods and Use Thereof in Screening

a scoring method and weighted technology, applied in the field of weighted scoring methods, can solve the problems of curtailing clinical use of these statistical techniques, not widely applied in fda approved commercially available tests, and affecting the reproducibility of logistic regression models,

Inactive Publication Date: 2008-06-05
ABBOTT LAB INC
View PDF5 Cites 166 Cited by
  • Summary
  • Abstract
  • Description
  • Claims
  • Application Information

AI Technical Summary

Benefits of technology

[0030]Examples of biomarkers that can be quantified in the above method are one or more biomarkers selected from the group of antibodies, antigens, regions of interest (or “ROIs”, as described herein) or any combinations thereof. More specifically, the biomarkers that can be quantified include, but are not limited to, one or more of: anti-p53, anti-TMP21, anti-NY-ESO-1, anti-Niemann-Pick C1-Like protein 1, C terminal peptide-domain (anti-NPC1L1C-domain), anti-TMOD1, anti-CAMK1, anti-RGS1, anti-PACSIN1, anti-RCV1, anti-MAPKAPK3, anti-Cyclin E2 (namely, at least one antibody against immunoreactive Cyclin E2), cytokeratin 8, cytokeratin 19, cytokeratin 18, CEA, CA125, CA15-3, SCC, CA19-9, proGRP, serum amyloid A, alpha-1-anti-trypsin and apolipoprotein CIII, Acn6399, Acn9459, Pub11597, Pub4789, TFA2759, TFA9133, Pub3743, Pub8606, Pub4487, Pub

Problems solved by technology
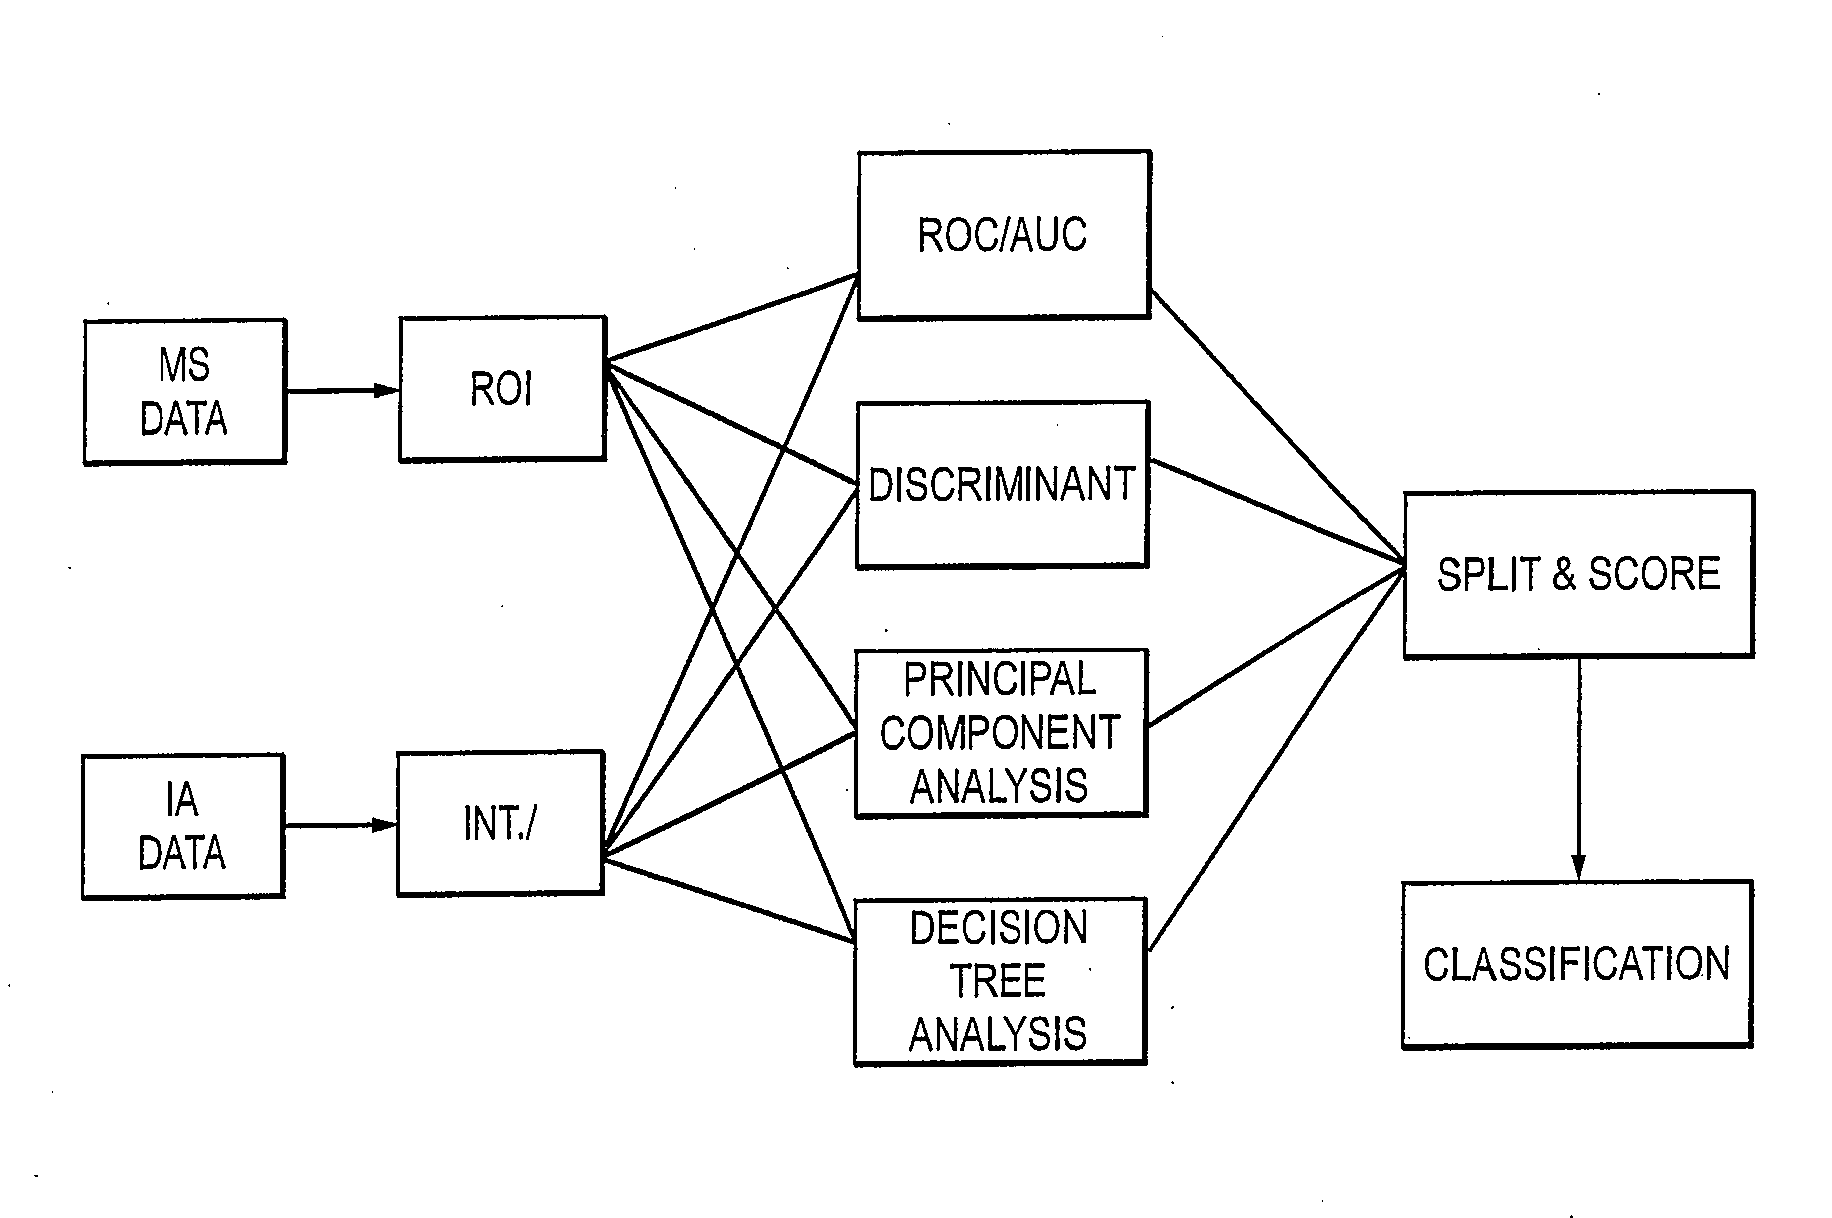
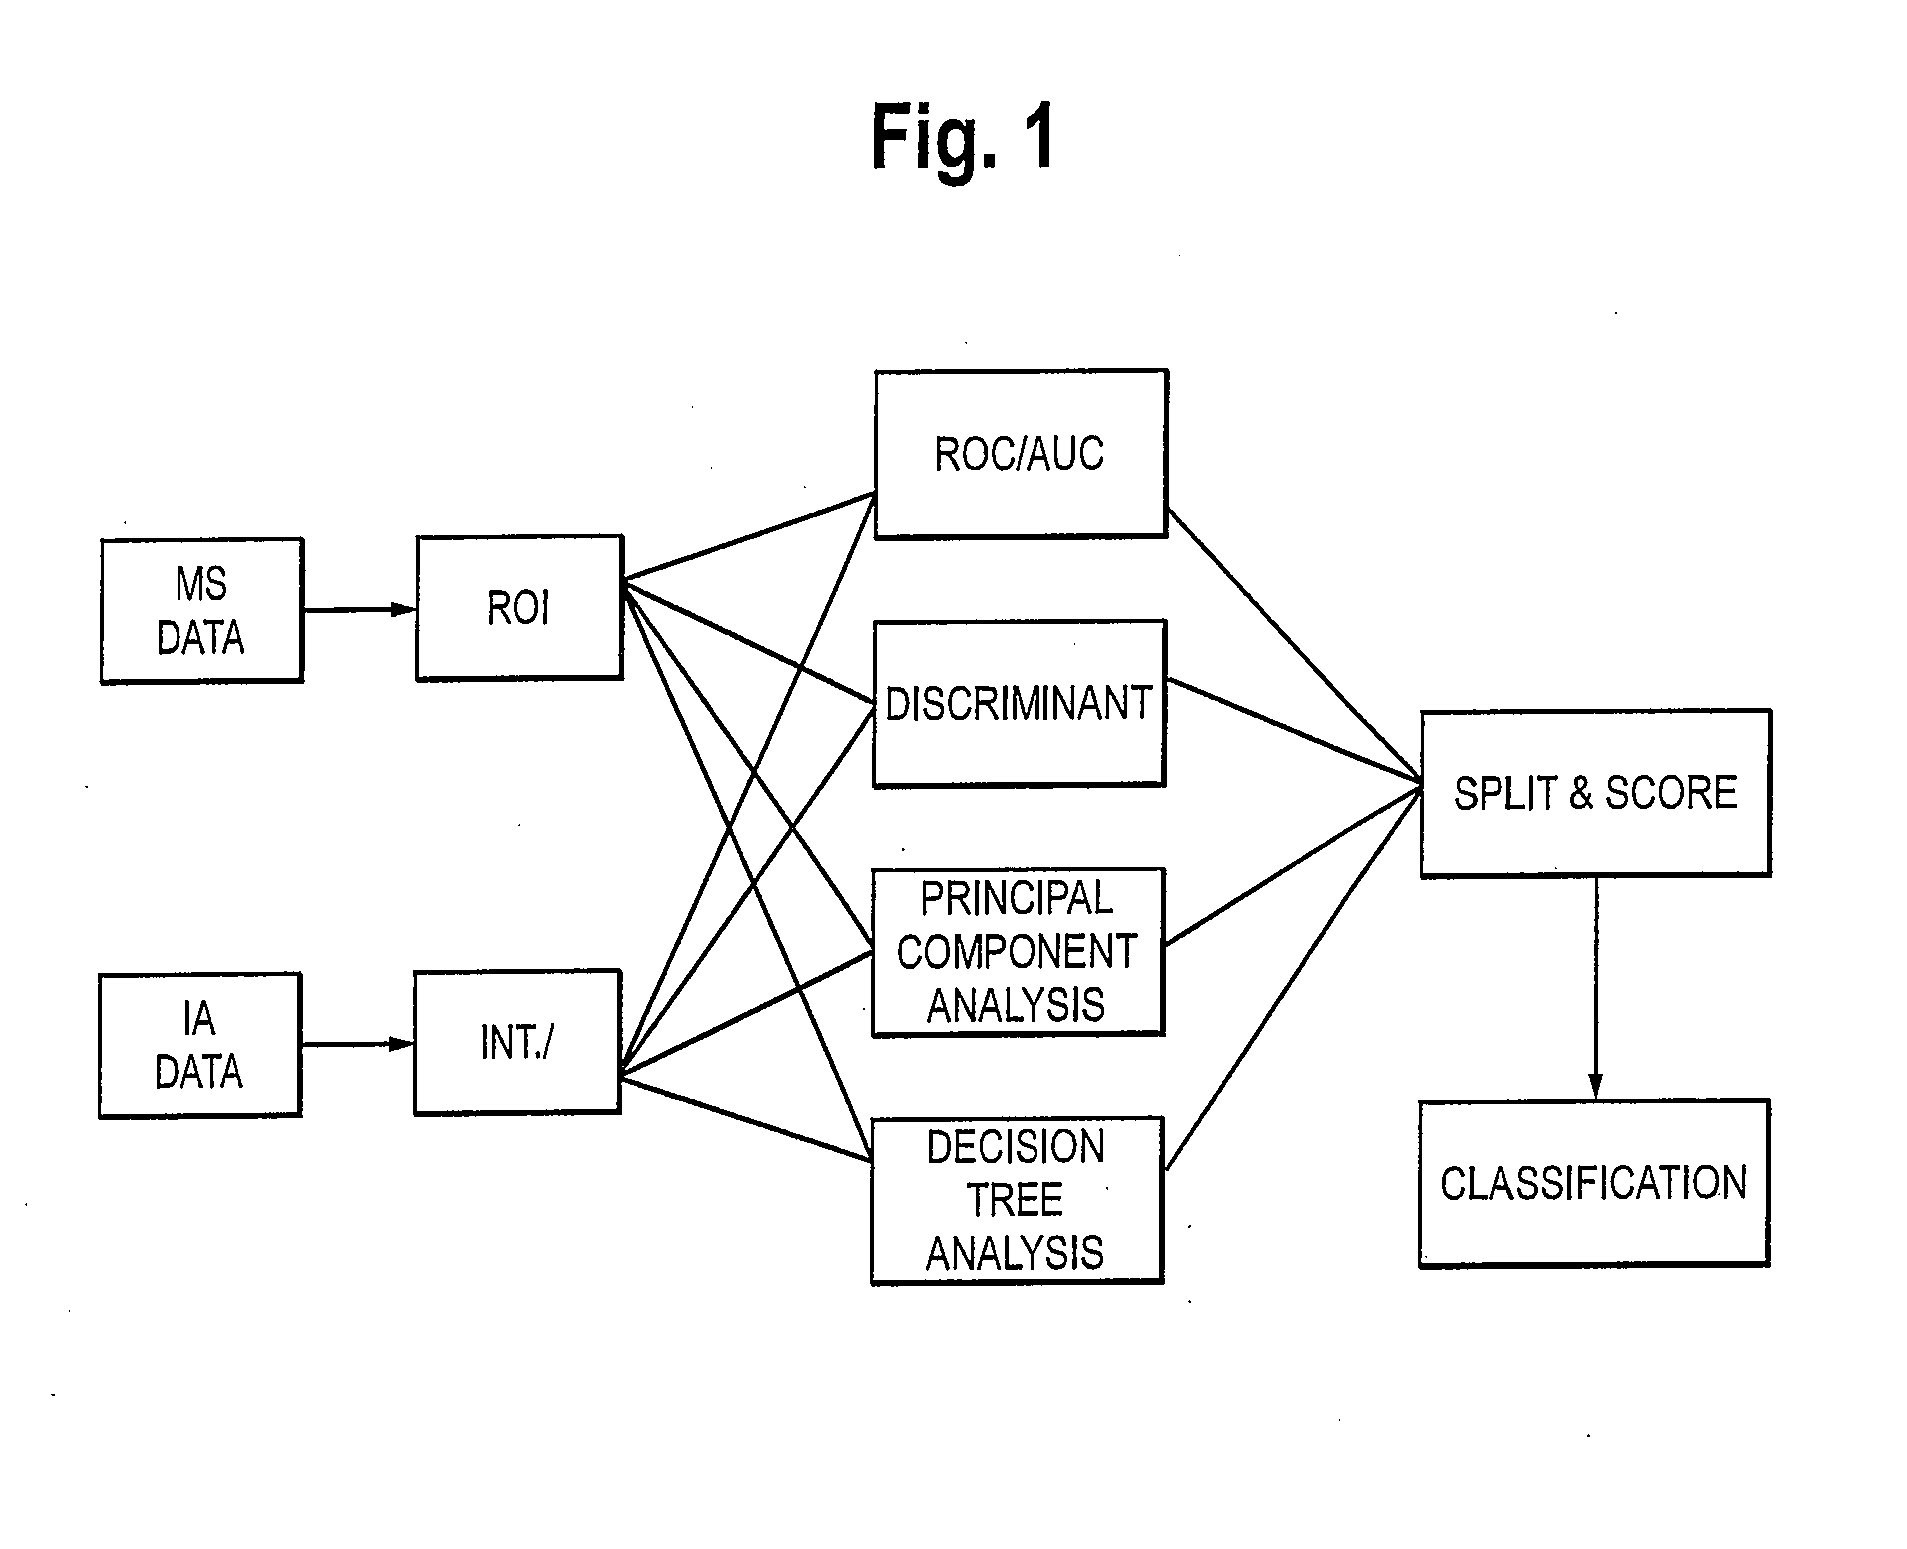
Although each of these models has been extensively used for biomarker development, the use of these statistical techniques for paneling biomarkers has not been widely applied in FDA approved commercially available tests.
Furthermore, new FDA regulations further scrutinizing these models also curtail their use in a clinical setting.
However, concerns remain over the reproducibility of the logistic regression models over time and across popul

Method used


Image

  • Weighted Scoring Methods and Use Thereof in Screening
  • Weighted Scoring Methods and Use Thereof in Screening
  • Weighted Scoring Methods and Use Thereof in Screening

Examples


example 1

Clinical Specimens

[0287]Clinical samples of patient serum were collected under an Institutional Review Board approved protocol. All subjects who contributed a specimen gave informed consent for the specimen to be collected and used in this project. Serum samples were drawn into a serum separator tube and allowed to clot for 15 minutes at room temperature. The clot was spun down and the sample poured off into 2 mL aliquots. Within 24 hours the samples were frozen at −80° C. and maintained at that temperature until further processing was undertaken. Upon receipt, the samples were thawed and realiquoted into smaller volumes for convenience and refrozen. The samples were then thawed a final time immediately before analysis. Therefore, every sample in the set was frozen and thawed twice before analysis.

[0288]A total of 751 specimens were collected and analyzed. The group was composed of 250 biopsy confirmed lung cancer patients, 274 biopsy confirmed benign lung disease patients, and 227 ...

example 2

Immunoassay Detection of Biomarkers

[0289]A. Abbott Laboratories (Abbott Park, Ill., Hereinafter “Abbott”) Architect™ Assays

[0290]Architect™ kits were acquired for the following antigens: CEA, CA125, SCC, CA19-9 and CA15-3. All assays were run according to the manufacturer's instructions. The concentrations of the analytes in the samples were provided by the Architect™ instrument. These concentrations were used to generate the AUC data shown below in Table 1.

TABLE 1Large CohortSmall CohortMarker#obsAUC#obsAUCCa19-95480.5482560.559CEA5490.6882570.664Ca15-35490.6042570.569Ca1255490.6932570.665SCC5490.6152570.639

Table 1. Clinical performance (AUC) of CA125, CEA, CA15-3, CA19-9, and SCC in the small and large cohorts. The #obs refers to the total number of individuals or clinical samples in each group.

[0291]B. Roche Elecsys™ Assay

[0292]Cyfra 21-1 (Cytokeratin 19, CK-19) measurements were made on the Elecsys™ 2010 system (Roche Diagnostics GmbH, Mannheim, Germany) according to the manufac...

example 3

Autoantibody Bead Array

[0295]A. Commercially available human proteins (See, Table 4, below) were attached to Luminex™ SeroMap™ beads (Austin, Tex.) and the individual beadsets were combined to prepare the reagent. Portions of the reagent were exposed to the human serum samples under conditions that allow any antibodies present to bind to the proteins. The unbound material was washed off and the beads were then exposed to a fluorescent conjugate of R-phycoerythrin linked to an antibody that specifically binds to human IgG. After washing, the beads were passed through a Luminex™ 100 instrument, which identified each bead according to its internal dyes, and measured the fluorescence bound to the bead, corresponding to the quantity of antibody bound to the bead. In this way, the immune responses of 772 samples (251 lung cancer, 244 normal, 277 benign) against 21 human proteins, as well as several non-human proteins for controls (bovine serum albumin (BSA) and tetanus toxin), were assess...


PUM


Abstract

The present invention relates among other things to methods for scoring one or more biomarkers in or associated with a test sample and determining a subject's risk of developing a medical condition.

Description

RELATED APPLICATION INFORMATION[0001]This application is a continuation-in-part of U.S. application Ser. No. 11 / 644,365 filed on Dec. 21, 2006, which claims priority to U.S. Patent Application No. 60 / 753,331 filed on Dec. 22, 2005, the contents of each of which are herein incorporated by reference.FIELD OF THE INVENTION[0002]The present invention relates among other things to methods for scoring one or more biomarkers in or associated with a test sample and determining a subject's risk of developing a medical condition.BACKGROUND OF THE INVENTION[0003]Investigators use statistical models to select and to combine new biomarkers for the diagnosis of a specific medical conditions such as, but not limited to, cancer, cardiovascular disease, neurological disease, liver disease, etc. Examples of statistical models routinely used for combining biomarkers include: 1) logistic regression; 2) neural networks; and 3) decision trees. Although each of these models has been extensively used for b...

Claims


Application Information

Patent Timeline
IPC IPC(8): G01N33/48A61B5/00
CPCG01N33/57423G06F19/345G01N33/6848G16H50/20Y02A90/10
Inventor FROST, STEPHEN J.
Owner ABBOTT LAB INC
Why Eureka
Try Eureka