
Method and system for assessing and diagnosing control loop performance

a technology of control loop and performance assessment, applied in the direction of testing/monitoring control system, instruments, computing, etc., can solve the problems of poor tuning, affecting the overall and the absence of prior methods, so as to achieve the effect of assessing and diagnosing the performance of the control loop

Inactive Publication Date: 2008-10-02
YOKOGAWA ELECTRIC CORP
View PDF7 Cites 11 Cited by
  • Summary
  • Abstract
  • Description
  • Claims
  • Application Information

AI Technical Summary

Benefits of technology

[0009]The invention is a system for assessing and diagnosing a control loop performance, comprising a Data Collection Section which collects data of two parameters of the control loop for an installed valve during a steady state. The data collected during the steady state operation, which can be referred as the Reference Data, is processed in a Linear Regression Section to generate a linear regression. A User Setting Port is provided to define the tolerance band and the boundary points, which are the minimum and maximum operating points. The generated linear regression, together with the defined tolerance band and boundary points are processed in a Linear Approximation Section to generate an acceptable reference region.

Problems solved by technology

In addition, prior methods do not consider other factors such as valve wear and tear, poor tuning, leakage and / or impulse line blocking which can affect the overall performance of the control loop.

Method used


Image

  • Method and system for assessing and diagnosing control loop performance
  • Method and system for assessing and diagnosing control loop performance
  • Method and system for assessing and diagnosing control loop performance

Examples


Embodiment Construction

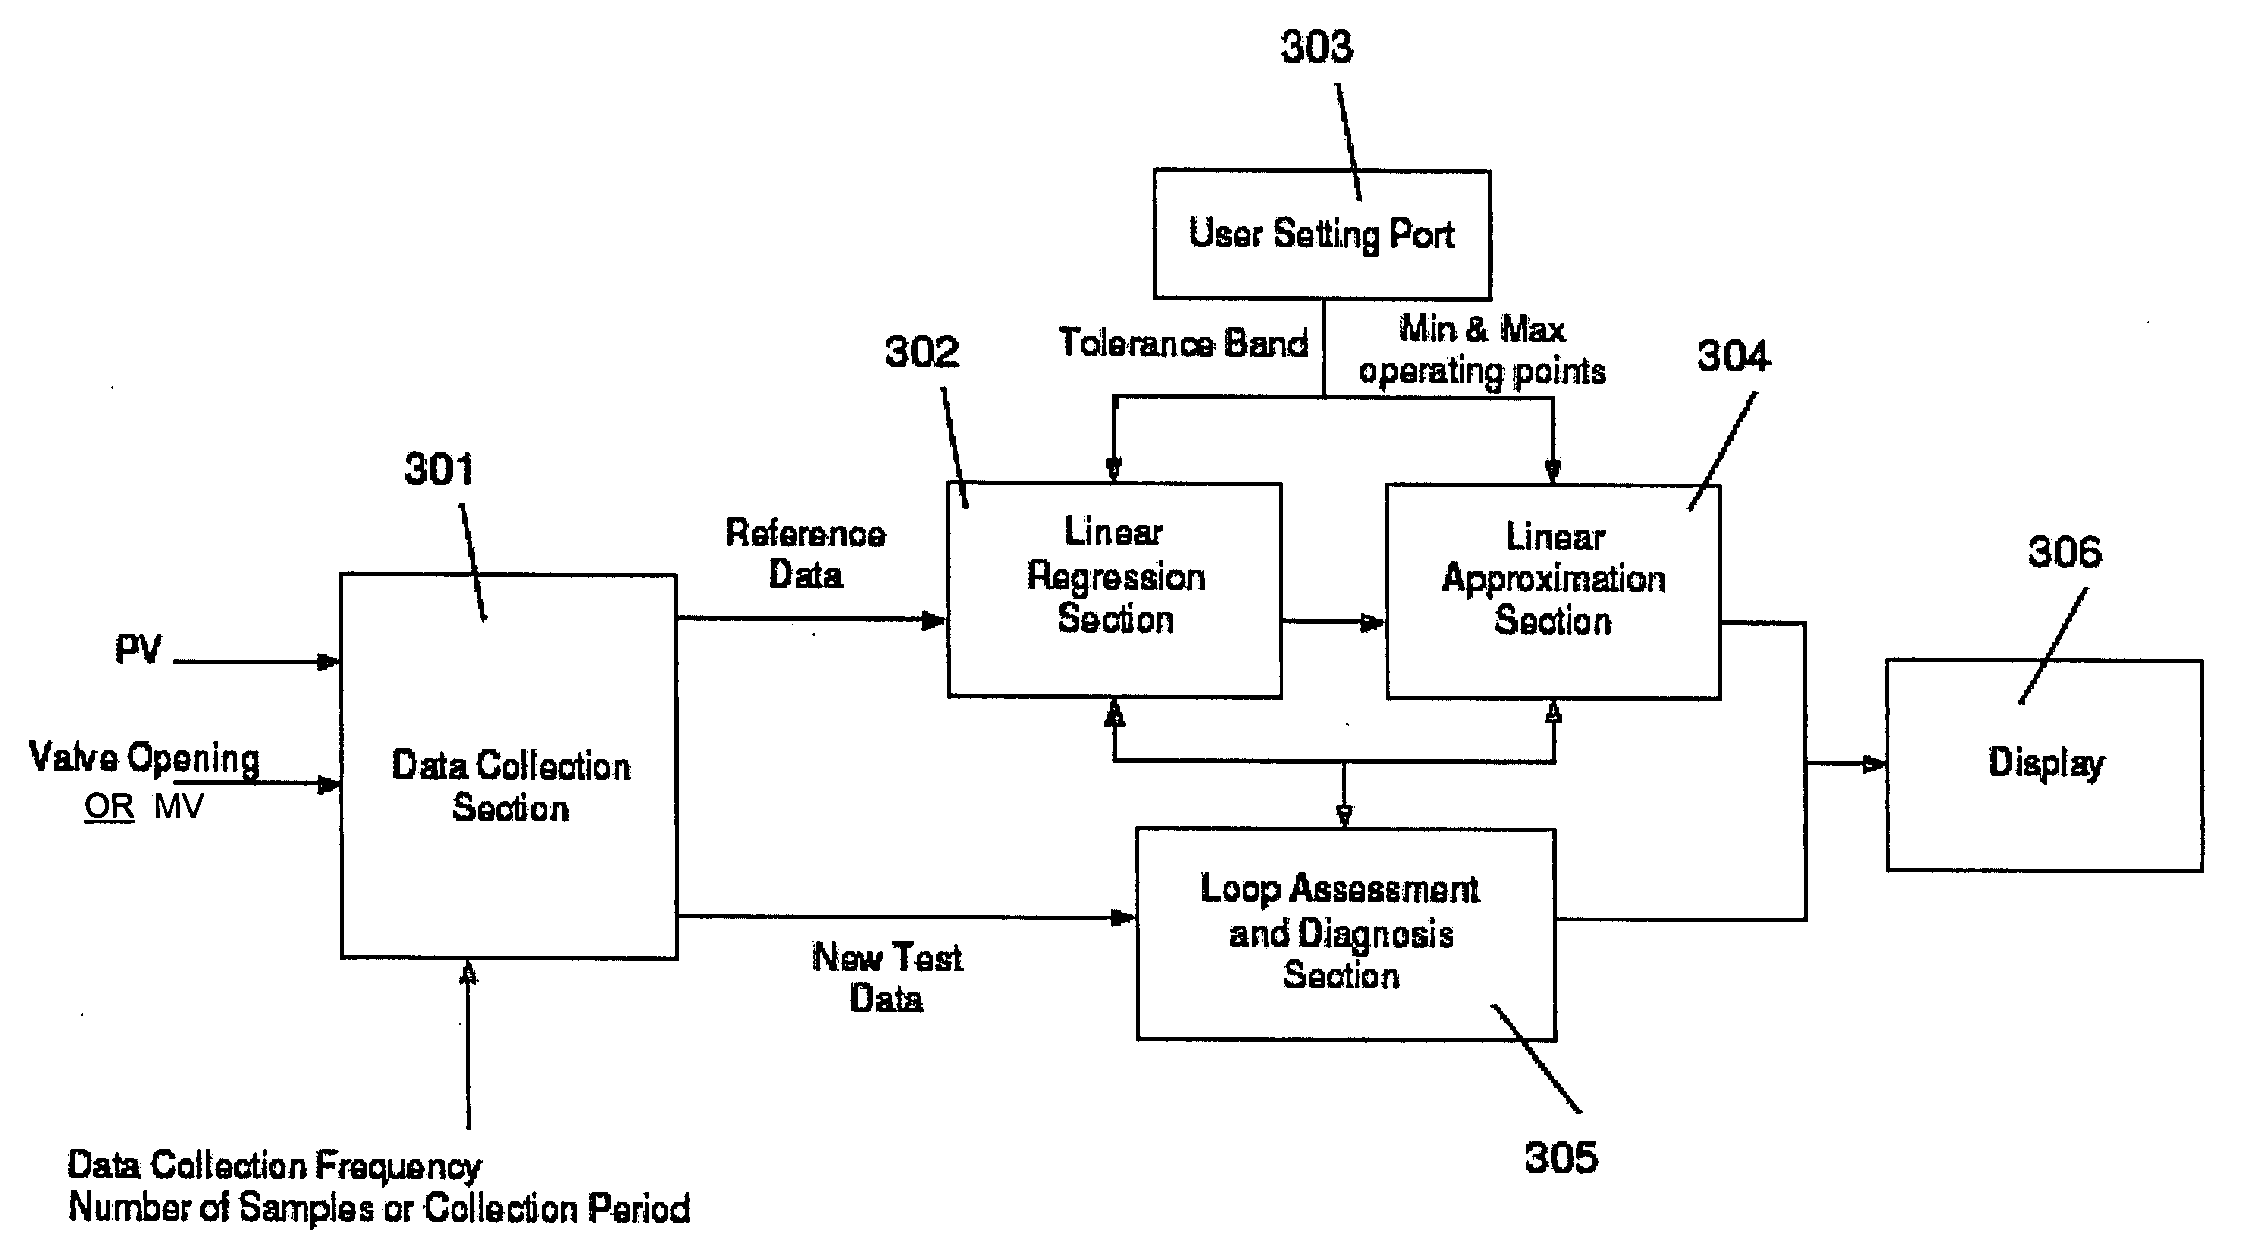
[0017]A preferred embodiment of the invention is a system for applying, assessing and diagnosing a control loop performance as illustrated in FIG. 3. A Data Collection Section 301 collects data of at least two parameters of the control loop for an installed valve during steady state operation. The first parameter is the Process Variable (PV), which is being monitored and inputted to the control loop. The second parameter is the valve opening. For a valve opening controlled by a conventional valve, which is not part of the control loop, the control loop outputs a Manipulated Variable (MV) based on a setpoint. The valve opening can be derived from the MV and the valve characteristic curve. In this case, the second parameter is the MV.

[0018]In order to ensure that sufficient data is collected for establishing a reference region which is representative of the installed valve characteristic, the valve opening is varied to obtain the corresponding PV. Alternatively, the setpoint is varied...


PUM


Abstract

The invention is a system for assessing and diagnosing performance of a control loop, comprising a Data Collection Section which collects data of two parameters of the control loop for an installed valve. The data collected is processed in a Linear Regression Section to generate a linear regression. A User Setting Port is provided to define the tolerance band and the boundary points. The generated linear regression, together with the defined tolerance band and boundary points are processed in a Linear Approximation Section to generate an acceptable reference region.

Description

FIELD OF INVENTION[0001]This invention is related to the assessment and diagnosis of a control loop for valve operation based on process and manipulated data.BACKGROUND OF THE INVENTION[0002]Valves installed in a plant are controlled by control loops. FIG. 1 illustrates a schematic diagram of such a prior art setup. An instrument 100 for displaying a Process Variable (PV), for example flow rate, temperature or pressure, is monitored by a control loop 102. The control loop monitors the PV against a desired value or a setpoint 104, and outputs a Manipulated Variable (MV) to control the valve opening 106. This ensures that the valve is functioning properly and the PV is within specifications. The performance of the control loops must be maintained within optimal levels to realise the benefits of automation.[0003]Typical control loop performance indices are used for detecting poorly performing control loops by comparing the controller performance against a user-defined benchmark, such a...

Claims


Application Information

Patent Timeline
Patent Type & Authority Applications(United States)
IPC IPC(8): G06F17/00
CPCG05B23/024
Inventor LEE, JOSEPH CHING HUAVISHWASRAO, SHARADORNELAS, EMELINKISHIMOTO, NAOYAIMAI, TATSUHIKO
Owner YOKOGAWA ELECTRIC CORP
Learn More