Method and system for motor failure detection

Active Publication Date: 2008-10-16
RESMED LTD
11 Cites 88 Cited by

AI-Extracted Technical Summary

Problems solved by technology

Such faults may include, for example, degraded bearings, a failing motor, low output torque, increased bearing fr...

Benefits of technology

[0013]The techniques of certain example embodiments can be applied to any device having a motor (e.g., with a bearing) to detect faults therein by, for example, comparing the useful (output) torque produced by the system with the (input) torque generated by the motor. These techniques may be used for motor testing and/or fault detection (e.g., gross fault detection, developing fault detection, and the like) before the motor is incorporated into the device, as a diagnostic function of an assembled device, etc.
[0014]In certain example embodiments, a method is provided to detect developing faults in a flow generator during therapy. A flow generator may employ an impeller powered by a motor under servo control. The torque exerted on the impeller by the fluid load is estimated from measured parameters. This is the output (e.g., useful) torque. The motor torque (e.g., input motor torque) can be determined in part from motor current. A difference between the input torque and the output torque may be calculated. The determination of whether a fault exists may be based at least in part on an assessment of the difference. The term expected motor torque alternatively may be used to signify the torque that is exerted on the impeller expected from the measured outputs from the turbine, including, for example, measured pressure, flow, and/or rotational speed.
[0015]In certain other example embodiments, a turbine-based ventilator...

Abstract

Systems and methods for detecting developing faults in a flow generator or ventilator during therapeutic use thereof are provided. The motor current may be measured to estimate the torque input by the motor, while the output torque from the impeller may be determined (e.g., as inferred from the motor control system model and/or by consulting a lookup table). One or more transducers may collect data useful in determining the input and output torques. A difference between the input (to the motor) torque and the output (from the impeller) torque may be calculated. The difference, optionally filtered using a low-pass filter to reduce noise, may be compared to a predetermined threshold once or over a period of time to detect gross failures and/or developing failures. Once a failure or developing failure is detected, a user may be alerted and/or the flow generator may be placed into a “service required” mode.

Application Domain

Technology Topic

ImpellerTreatment use +9

Image

  • Method and system for motor failure detection
  • Method and system for motor failure detection
  • Method and system for motor failure detection

Examples

  • Experimental program(1)

Example

1. Fault Detection
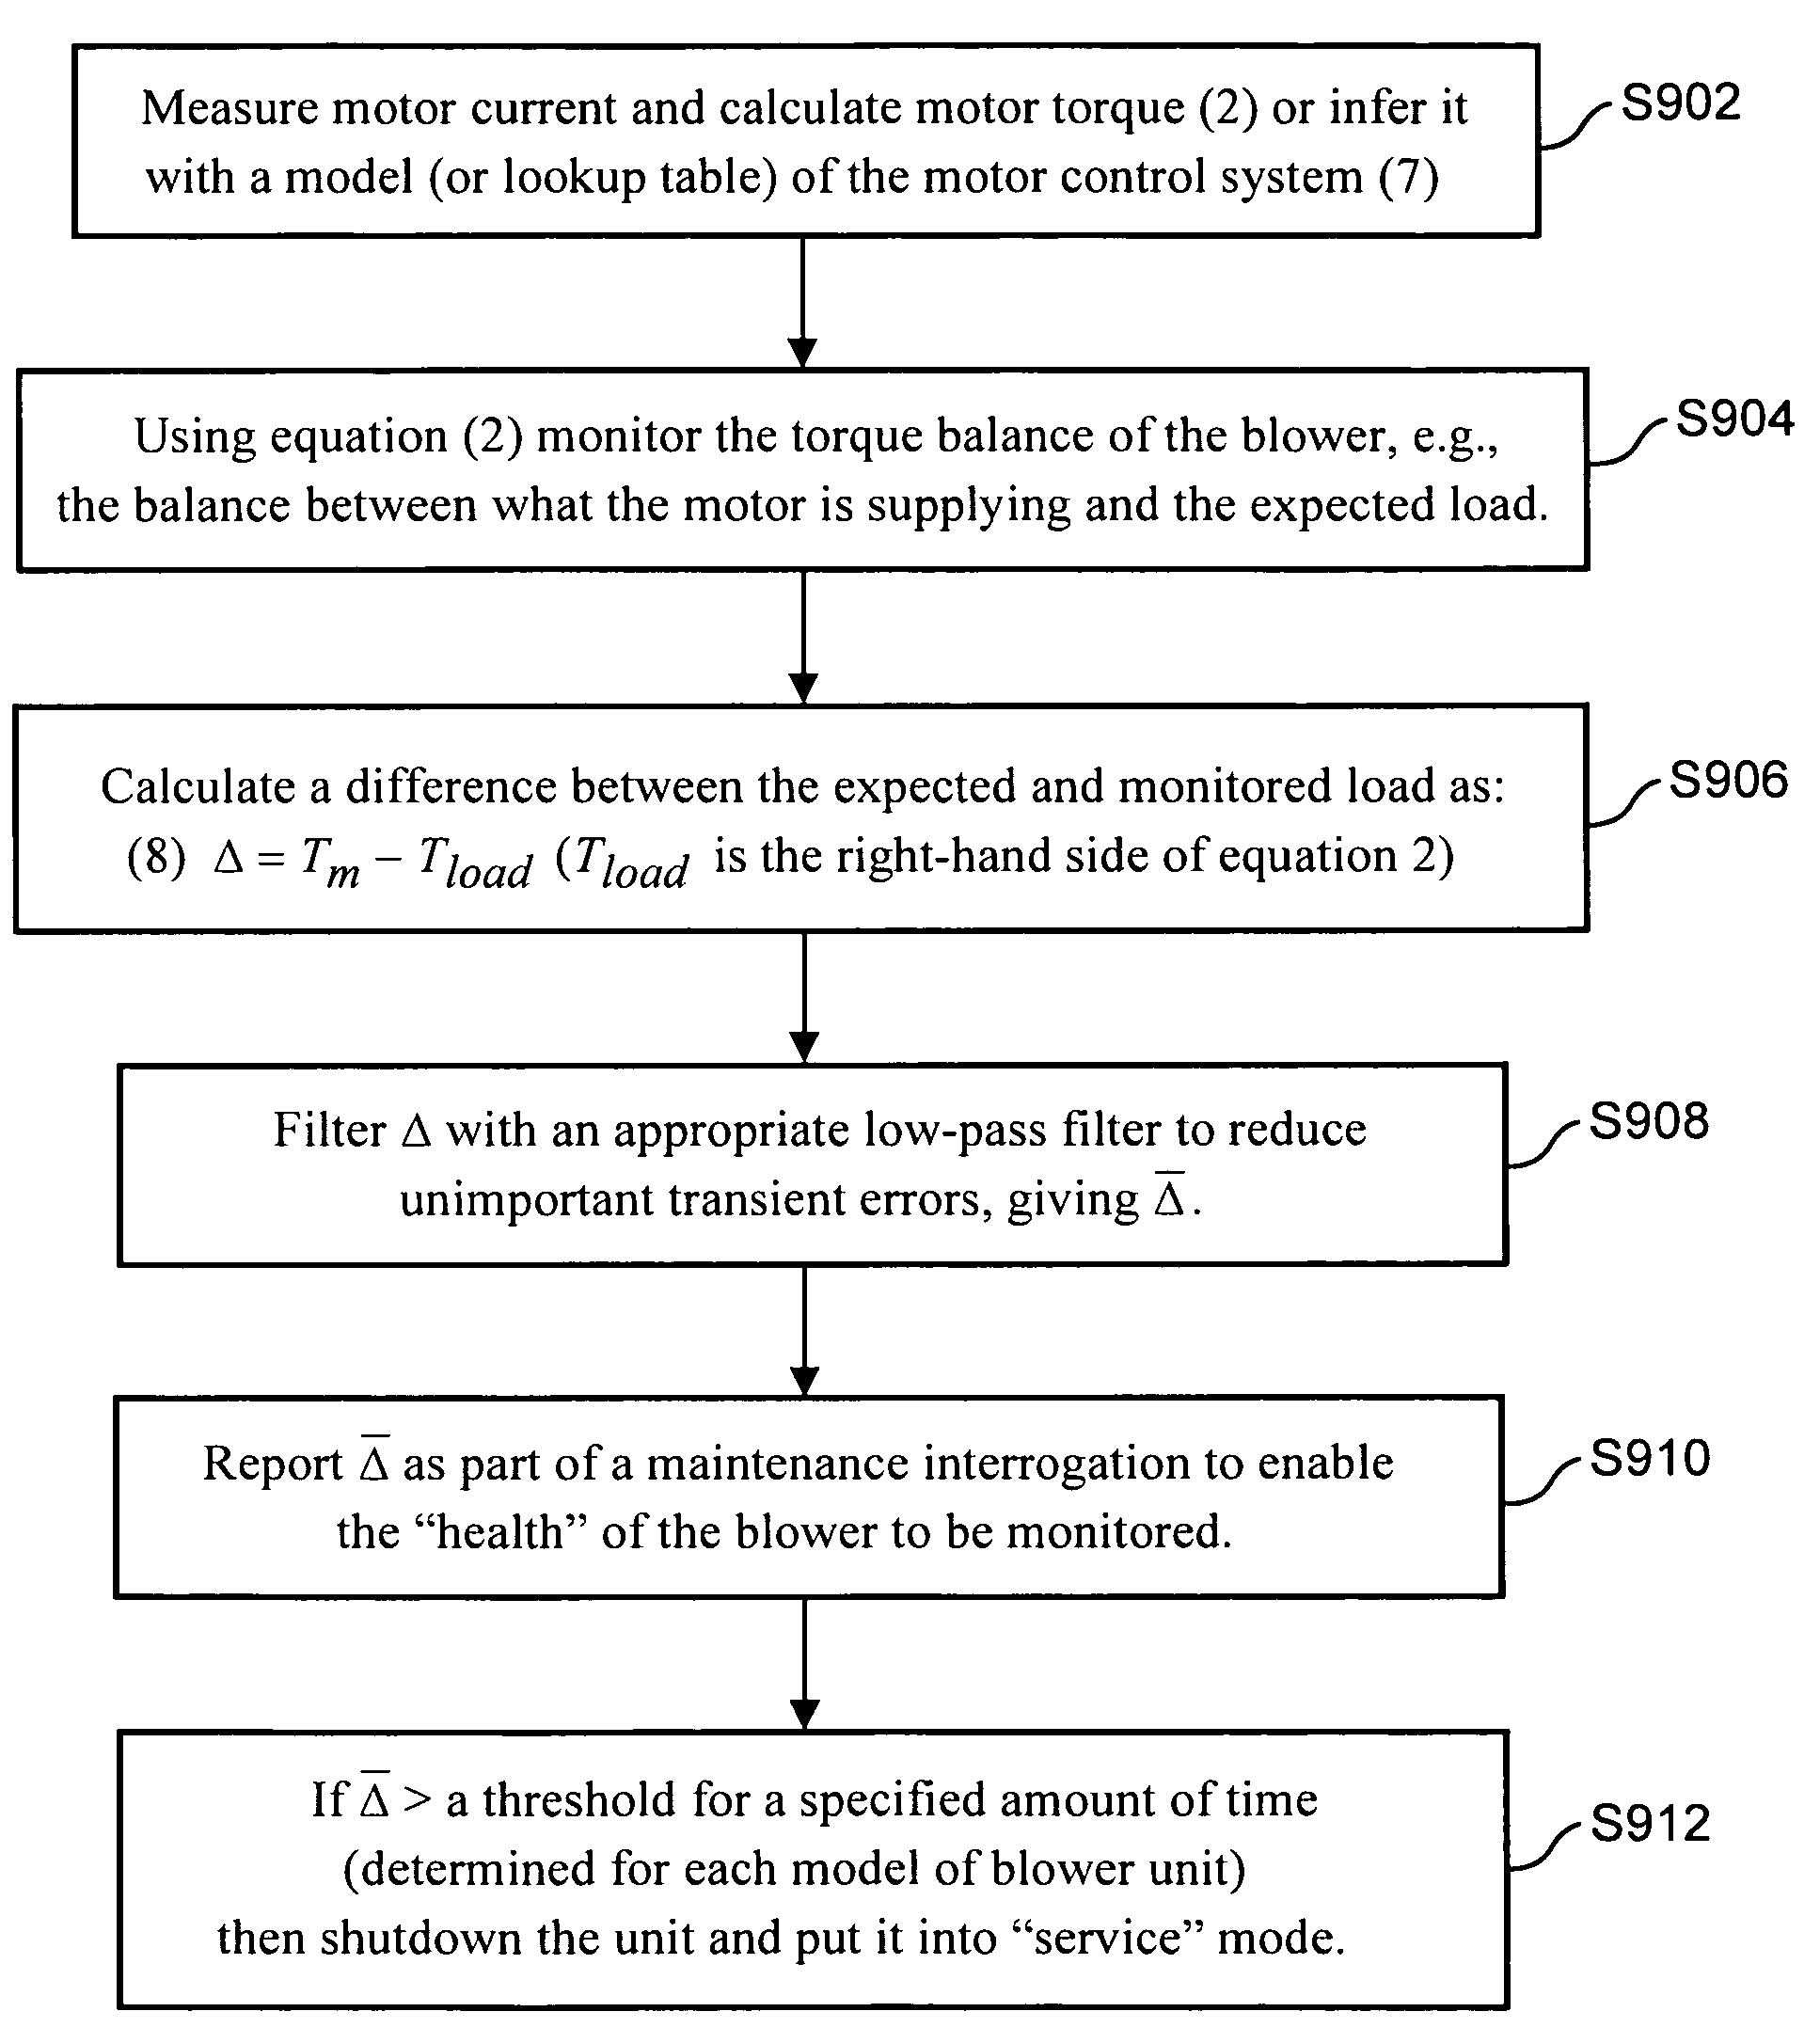
[0027]Certain example embodiments relate to techniques for detecting developing faults in flow generators. This may be made possible by calculating the difference between the expected and monitored load torques of a flow generator. The difference, filtered or unfiltered, may be compared to one or more predetermined thresholds (e.g., over a period of time) to determine whether a gross fault has occurred and/or whether a fault is developing. The following sections detail illustrative equations and illustrative hardware/software configurations that may be used in conjunction with this approach.
[0028]1.1 Model Overview
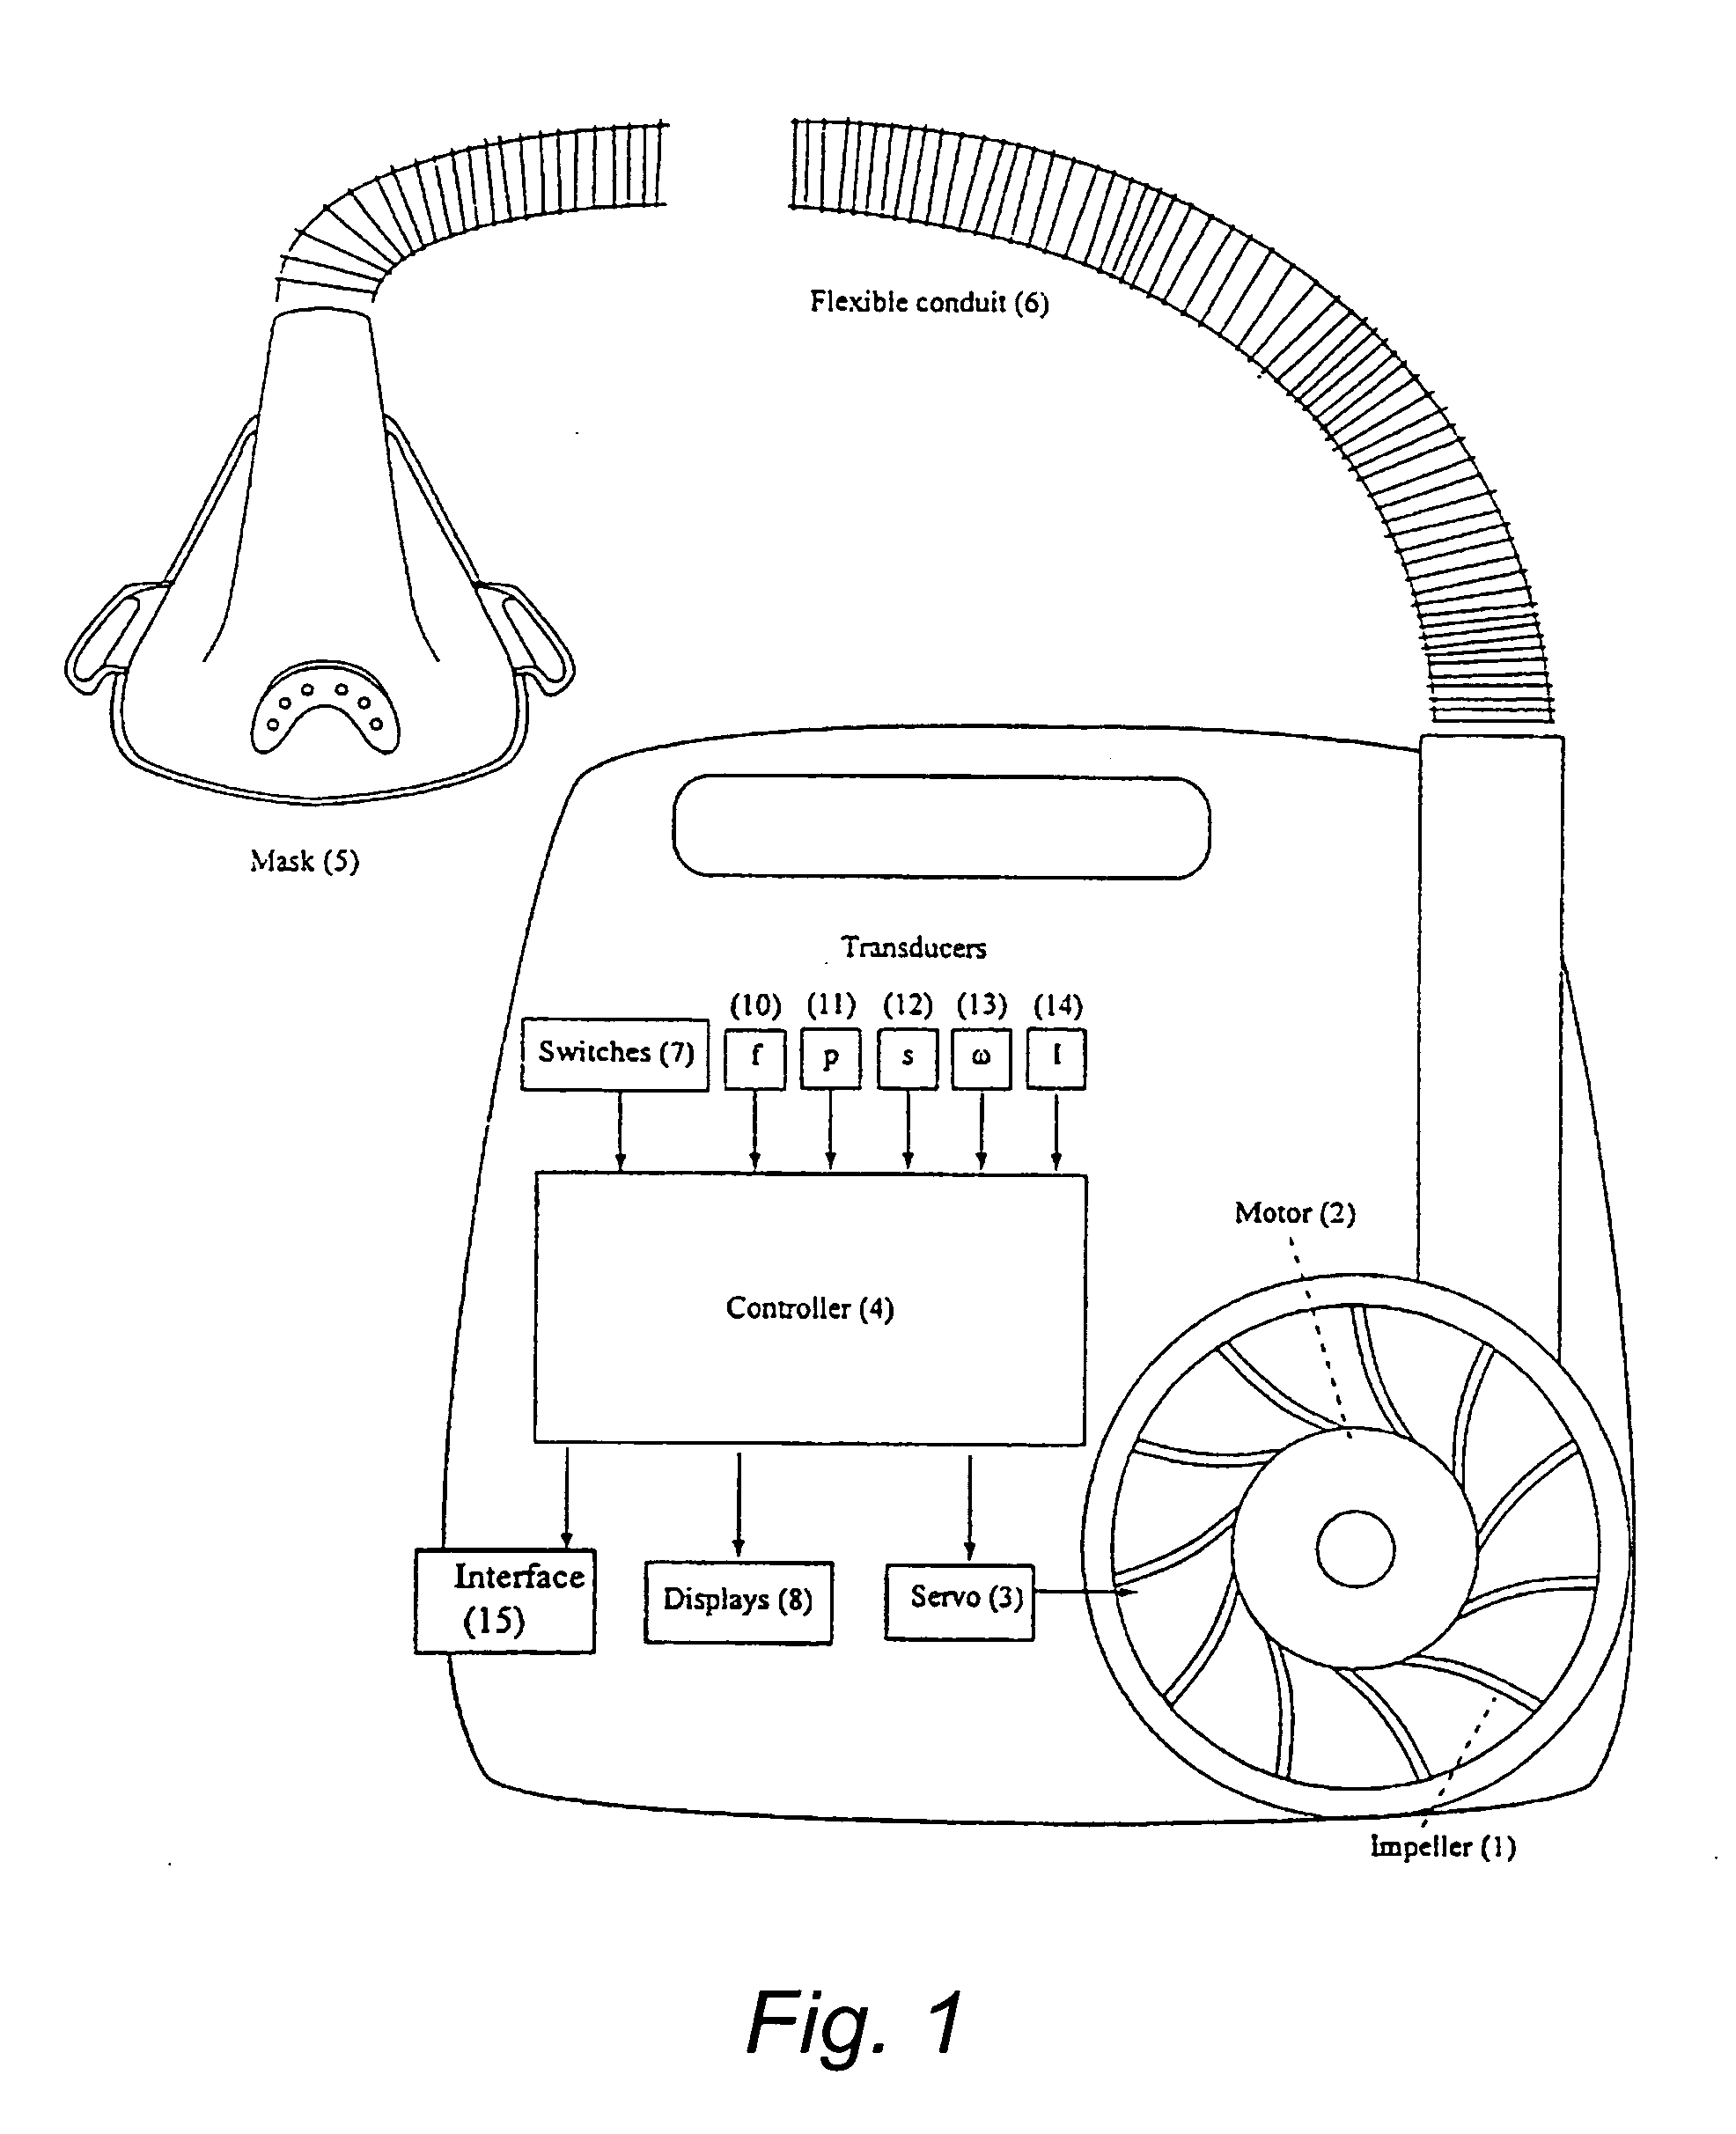
[0029]The blower is powered by a motor 2 that delivers a torque to the impeller 1 which accelerates the delivered fluid. At any point in time, there will be a balance between the torque developed by the motor and the torque required for accelerating the fluid, accelerating the mass of the impeller and motor rotor, and any losses in the system. It will be appreciated that this balance also could be formulated in terms of power. The torque developed by the motor can be calculated from the current consumed by the motor by applying the motor constant km. For a multiphase motor, this constant will be a per-phase equivalent constant. The torque provided by the motor is then:
Tm=km·Im,  (1)
where Im is the motor current. This torque is balanced by the torques detailed above as in the equation:
T m = p · Q ω + J ∂ ω ∂ t + T loss , ( 2 )
where p is the pressure delivered to the patient in Pascals (or the difference in pressure between the outlet and inlet of the impeller if the inlet pressure is not zero), Q is the flow-rate in m3·s−1 of the delivered gas, ω is the rotational speed of the impeller in radians per second (which may be measured directly or indirectly, e.g., as some brushless DC or “sensorless motors” are capable of inferring rotational speed from back-emf), J is the rotational moment of inertia of all the spinning mass that the motor is accelerating, and Tloss is the sum of all the loss torques. The last term in equation (2) can be modeled, for example, using the following function:
Tloss=Tcons+ƒ(p,Q2,ω).  (3)
[0030]It will be appreciated that here, the density, viscosity, and temperature of the fluid are assumed to be constant. When this is not true, certain example embodiments may allow constants to be incorporated to allow for measured and/or inferred changes in these and/or other variables. The rationale for this last equation is as follows. Tcons represents a “constant torque load” typical of rotating machinery. A torque proportional to ω is a viscous torque attributable to fluid-filled ball bearings. A torque term proportional to the pressure across the impeller will account for leakage from high pressure zones to low pressure zones, and a torque proportional to Q2 will allow for the (mostly turbulent) losses along the fluid path of the impeller and housing. In certain example embodiments, the function ƒ may be assumed to be approximately linear, although the present invention is not so limited. For example, in certain other example embodiments, the function ƒ may be nonlinear, a lookup table, etc. One example of a suitable function is:
Tloss=Tcons+k1+ω+k2·Q2+k3·p. (4)
[0031]For the purposes of the discussion herein, SI units will be used, implying that torque will be measured in Newton-meters. Of course, it will be appreciated that other units of measurement can be used in other example embodiments.
[0032]Certain example embodiments relate to a therapy device having a motor and an impeller as above, transducers suitable for measuring and/or calculating p, Q, ω, Im. Such capabilities allow the torque balance in equation (2) to be monitored. For example, when the difference between the left-hand-side term and the sum of the right-hand-side terms exceeds a predetermined threshold, a signal may be generated to indicate that service is necessary (e.g., an audible alarm and/or visual alarm may be triggered, the flow generator may be placed into a “requires service” mode, etc.). As another example, the balance can be tracked over time to give an indication of expected remaining service life or “health status.” It will be appreciated that the term related to rotational inertia
( J ∂ ω ∂ t )
could be ignored if the torque balance were only checked during non-acceleration periods.
[0033]Thus, in certain example embodiments, the predetermined threshold may be indicative of a value signifying a gross failure, whereas the predetermined threshold may be indicative of a relative (e.g., growing) failure in certain other example embodiments. Certain example embodiments may be capable of indicating both gross failures (e.g., a single difference being above a given threshold), as well as relative failures (e.g., increasing differences between the monitored and expected torques beyond a threshold indicative of an acceptable increase). The predetermined threshold may be expressed in terms of an absolute value, a percentage increase or decrease, etc.
[0034]1.2 Calculation of Tm
[0035]Equation (1) shows that the torque provided by the motor can be calculated as the product of the motor current and the motor torque constant. Ordinarily, the motor torque constant will be provided by the motor manufacturer. The motor supply current then only needs to be measured or inferred to complete input to this equation. Accordingly, if a low-valued resistor is placed in line between the power supply and the motor, then the voltage across that resistor will be approximately linearly proportional to the current supplied to the motor. Also, if the motor is controlled using switched-mode technology, then the voltage across the resistor may need to be filtered to provide a substantially noise-free estimate of supply current.
[0036]The motor supply current also can be inferred from other parameters involved in the closed-loop control of motor current. For example, a transconductance amplifier can be used to control motor current in a closed loop fashion. Here, a control voltage, known as “drive,” is the input to the transconductance amplifier that uses switch-mode technology to control the current fed to the motor. At a substantially constant angular velocity of the motor, there will be an almost-linear relationship between the control voltage “drive” and the motor supply current. FIG. 2 shows the relationship between drive and the r.m.s. supply current for six different constant angular velocities experimentally obtained from a AutoSet CS2 blower, which is commercially available from ResMed. The plots correspond, from left to right, to RPMs of 5,000; 8,000; 10,000; 15,000; 20,000; and 23,000.
[0037]The change in the relationship between drive and supply current with angular velocity can be accommodated by a model or lookup table that covers the required operating range. Because the transconductance amplifier loop may run at a very high speed (e.g., about 20 kHz), the model or lookup table can be created using static tests (e.g., tests at a substantially constant velocity), but the results will still be valid generally for a dynamically changing system (e.g., where the motor is accelerating). FIG. 3 shows the results of modeling the r.m.s. current as a nonlinear function of drive and angular velocity. The plot represents the same data as those plotted in FIG. 2 and displays a substantially linear relationship between modeled and real r.m.s. current. The slope of the line is approximately one, the y-intercept is about zero, and the correlation coefficient is about 0.998. It will be appreciated that this model could also be implemented by a lookup table.
[0038]1.3 Calculation of the Torque Required to Accelerate the Breathable Gas
[0039]The power produced by a pump is equal to p·Q, where, if p is measured in Pascals and Q in m3·s−1, the result will have units of Watts. If the power produced by the pump is divided by the angular velocity in radians per second, the result is torque in Newton-meters. If the pump is 100% efficient (e.g., no fluid or mechanical losses), then this torque is that required of the motor when the pump is turning at constant angular velocity.
[0040]1.4 Calculation of the Torque Required to Accelerate the Spinning Mass of the Pump and Motor Rotor and Shaft
[0041]If the motor and pump are accelerating (e.g., the angular velocity is not constant), then a torque will be required to accelerate the combined spinning mass as:
T inertia = J ∂ ω ∂ t ,
where J has the SI units of kg·m2, Tinertia has units of Newton-meters, and
∂ ω ∂ t
has units of (radian)·s−2.
[0042]For the AutoSet CS2 blower, the value of J is 2·1.13 E−6 (two impellers)+1.26 E−7 (motor)=2.386 E−6 kg·m2.
[0043]1.5 Calculation of the Torque Consumed by the Bearings and Pump Inefficiencies
[0044]As noted above, the inefficiencies of the pump and losses related to the bearings can be modeled empirically while still basing the functional principles of certain example embodiments on sound physical principles. One such model is
Tloss=Tcons+k1·ω+k2·Q2+k3·p. (6)
[0045]Here, Tcons represents the static or Coulomb friction of the bearings, and k1 represents the viscous friction typical of grease-filled bearings. k2 represents the (predominantly turbulent) fluid losses within the pump housing, and k3 represents losses related to leakage from high pressure zones to low pressure zones.
[0046]Typical values of the constants above for a AutoSet CS2 blower are [0047] Tcons=5.4721E−4 N·m [0048] k1=1.8838E−6 N·m·(radian−1)·s [0049] k2=1.2585E2 N·m−5·(radian−1)·s2 [0050] k3=1.0493E−7 N·m·Pa−1
These values were calculated using a “known-good” unit and a least squares fitting routine. It will be appreciated that constants for other units may be calculated using the same or similar techniques.
[0051]1.6 An Example of Dynamically Calculated Torque Difference
[0052]FIG. 4 shows two plots of torque in Newton-meters vs. time, the dotted curve being that supplied by the motor and the solid curve being that related to the combined load. The AutoSet CS2 blower is here delivering pressure in simple bilevel fashion with a fixed cycle length while a subject breathes. The motor torque was calculated using the model developed with static tests, e.g.,
Tm=ƒ(drive,ω).  (7)
It will be appreciated that motor current also can be calculated as a function of drive (representing the [0, 1] signal output by the motor controller) and speed of the motor spindle, as modeled by the equation Tm=ƒ(drive, RPM).
[0053]FIG. 5 shows a close-up of one cycle in FIG. 4, showing good correspondence (e.g., torque balance) between the two signals. FIG. 6 shows the same scenario, this time with a perturbation of the load torque between 15 and 25 seconds. The perturbation included a small amount of friction being applied to the impeller surface. As will be appreciated from FIG. 6, the motor torque curve is shifted up during the perturbation, e.g., the motor is supplying some “extra” torque not matching the expected load. FIG. 7 shows the expected torque difference, and again there is a pronounced difference in the balance during the perturbation.
2. An Example of Longer-Term Monitoring of Blower “Health” Status
[0054]FIG. 8 shows longer-term monitoring of the torque-balance trace in FIG. 7 for four separate units. In FIG. 8, the displayed traces have been filtered with a time constant of 100 seconds to eliminate transient noise. Three “good” units (curves 810, 820, and 830) were run for around one hour and displayed similar near-zero torque difference. A fourth crippled unit (curve 840) was run for about three hours until bearing failure. This unit had had the grease removed from its bearing at time zero and at the one hour point some dust was introduced into the bearing. The crippled unit clearly displays a greatly increased torque difference, indicating that the motor is supplying torque (or power) to an “unexpected” load. It will be appreciated that this unit could have been shut down by the controlling software long before catastrophic failure based at least in part on the detection of the large filtered torque difference.
3. Illustrative Flowchart Showing Fault Detection Example Methods
[0055]FIG. 9 is an illustrative flowchart showing a fault detection method, in accordance with an example embodiment. In step S902, the motor current is measured, and the motor torque is determined. The motor torque can be calculated, for example, using equation (2). Alternatively, the motor torque can be inferred using a model and/or lookup table of the motor control system, for example, using equation (7). In step S904, the torque balance (e.g., the balance between what the motor is supplying and the expected load) of the blower is monitored, for example, using equation (2). The difference between the expected and monitored (actual) load may be calculated in step S906. The difference may be modeled as:
Δ=Tm−Tload,  (8)
with Tload being the right-hand side of equation (2).
[0056]In step S908, Δ may be filtered with an appropriate low-pass filter to reduce unimportant transient errors, producing Δ. In step S910, Δ may be reported as part of a maintenance interrogation (e.g., by the controller 4 and output via one or more displays 8), reflecting the “health” of the flow generator. As shown in step S912, if Δ is greater than a predetermined threshold for a specified amount of time, the flow generator may be shutdown, put into a “service mode,” and/or may otherwise alert a user that a fault is detected and/or anticipated. It will be appreciated that the predetermined threshold and/or the amount of time may be particular to the model of the flow generator being used.
[0057]The monitoring and/or calculating processes may be performed and/or aggregated over a longer period of time. This data may be stored (e.g., to a memory) and compared for longer-term trending purposes to measure the overall health of the flow generator and/or changes to the overall health of the flow generator. For example, the actual performance may be compared to an idealized performance over a longer period of time. Significant deviations from the idealized performance may be indicative of a problem with the flow generator and/or the monitoring equipment.
[0058]It will be appreciated that although certain example embodiments have been described in relation to a CPAP device and/or to ResMed's AutoSet CS2 model blower, the present invention is not so limited. Instead, the example embodiments described herein may be used in conjunction with other types of flow generators (e.g., PAP devices generally, bilevel devices, AutoSet algorithm devices, etc.), potentially available from any manufacturer. Also, it will be appreciated that the hardware components described herein are not limited to any particular arrangement. For example, the transducers may be a part of a particular flow generator, they may be part of a separate module to be integrated into a particular flow generator, they may be separate from a particular flow generator, etc. Moreover, it will be appreciated that the hardware and/or software components described herein may comprise any combination of hardware, software, firmware, or the like that provides suitable functionality. For example, the calculations may be implemented by software algorithms executable and/or embedded into the controller 4.
[0059]One advantage of certain example embodiments relates to patients benefiting from increased safety and the knowledge of impending failure(s). Another advantage of certain example embodiments relates to developing fault detection without the need for temperature and/or other sensors, as enabled by, for example, software algorithms transforming data already monitored by hardware elements of the treatment apparatus. The detectable faults may include, for example, degraded bearings, a failing motor, low output torque, increased bearing friction, constricted inlet(s), dropped phase, disconnected Hall sensor(s), impeller failures, etc.
[0060]It will be appreciated that although certain example embodiments have been described as relating to PAP devices and/or flow generators, the present invention is not limited to any particular device. For example, the example embodiments described herein may be used in connection with any suitable turbine-based ventilator. Such turbine-based ventilators may include, for example, flow, volume, and/or pressure target based devices. Such turbine-based ventilators also may include, for example, traditional mechanical ventilators, CPAP devices, high-flow nasal cannula based devices, etc.
[0061]While the invention has been described in connection with what are presently considered to be the most practical and preferred embodiments, it is to be understood that the invention is not to be limited to the disclosed embodiments, but on the contrary, is intended to cover various modifications and equivalent arrangements included within the spirit and scope of the invention. Also, the various embodiments described above may be implemented in conjunction with other embodiments, e.g., aspects of one embodiment may be combined with aspects of another embodiment to realize yet other embodiments.
[0062]Also, the various embodiments described above may be implemented in conjunction with other embodiments, e.g., aspects of one embodiment may be combined to provide treatment in connection with invasive ventilation techniques, volume modes, mechanical ventilation, etc. In addition, while the invention has particular application to patients who suffer from OSA, it is to be appreciated that patients who suffer from other illnesses (e.g., ventilatory insufficiency or failure, congestive heart failure, diabetes, morbid obesity, stroke, barriatric surgery, etc.) can derive benefit from the above teachings. Moreover, the above teachings have applicability with patients and non-patients alike in non-medical applications.

PUM

no PUM

Description & Claims & Application Information

We can also present the details of the Description, Claims and Application information to help users get a comprehensive understanding of the technical details of the patent, such as background art, summary of invention, brief description of drawings, description of embodiments, and other original content. On the other hand, users can also determine the specific scope of protection of the technology through the list of claims; as well as understand the changes in the life cycle of the technology with the presentation of the patent timeline. Login to view more.

Similar technology patents

Schottky barrier diode

Owner:MITSUBISHI ELECTRIC CORP

Classification and recommendation of technical efficacy words

Why Eureka
Try Eureka