

Methods and Systems for Incorporating Multiple Environmental and Genetic Risk Factors
a technology of applied in the field of methods and systems for incorporating multiple environmental and genetic risk factors, can solve the problems of inconvenient and complex analysis of individual risk factors, inability to accurately estimate individual risk for developing a condition, and inability to conduct large-scale studies that investigate all of these factors at on
- Summary
- Abstract
- Description
- Claims
- Application Information
AI Technical Summary
Benefits of technology
Problems solved by technology
Method used
Image

Examples
example 1
Evaluation of GCI
[0214]The WTCCC data (Wellcome Trust Case Control Consortium, Nature. 447:661-678 (2007)) is used to test the GCI framework. This dataset contains the genotypes of approximately 14,000 individuals divided into seven subpopulations based on disease phenotypes and one unaffected control subpopulation of 1,500 samples from the UK Blood Service Control Group. The GCI is tested in the context of three different diseases: Type 2 Diabetes, Crohn's disease, and Rheumatoid Arthritis, which differ substantially in their heritability and average lifetime risk. Thus, analysis is limited to the Type 2 Diabetes, Crohn's Disease, and Rheumatoid Arthritis subpopulations and the control group. SNPs that were reported in the literature to be significantly associated with each of these conditions, and that passed a set of quality criteria (see Table 2) are used.
TABLE 2Allele frequencies and the relative risks Type 2 Diabetes, Crohn's Disease, and Rheumatoid Arthritis.Relative risk1Rel...
example 2
Theoretical Effect of Unknown SNP-SNP Interactions
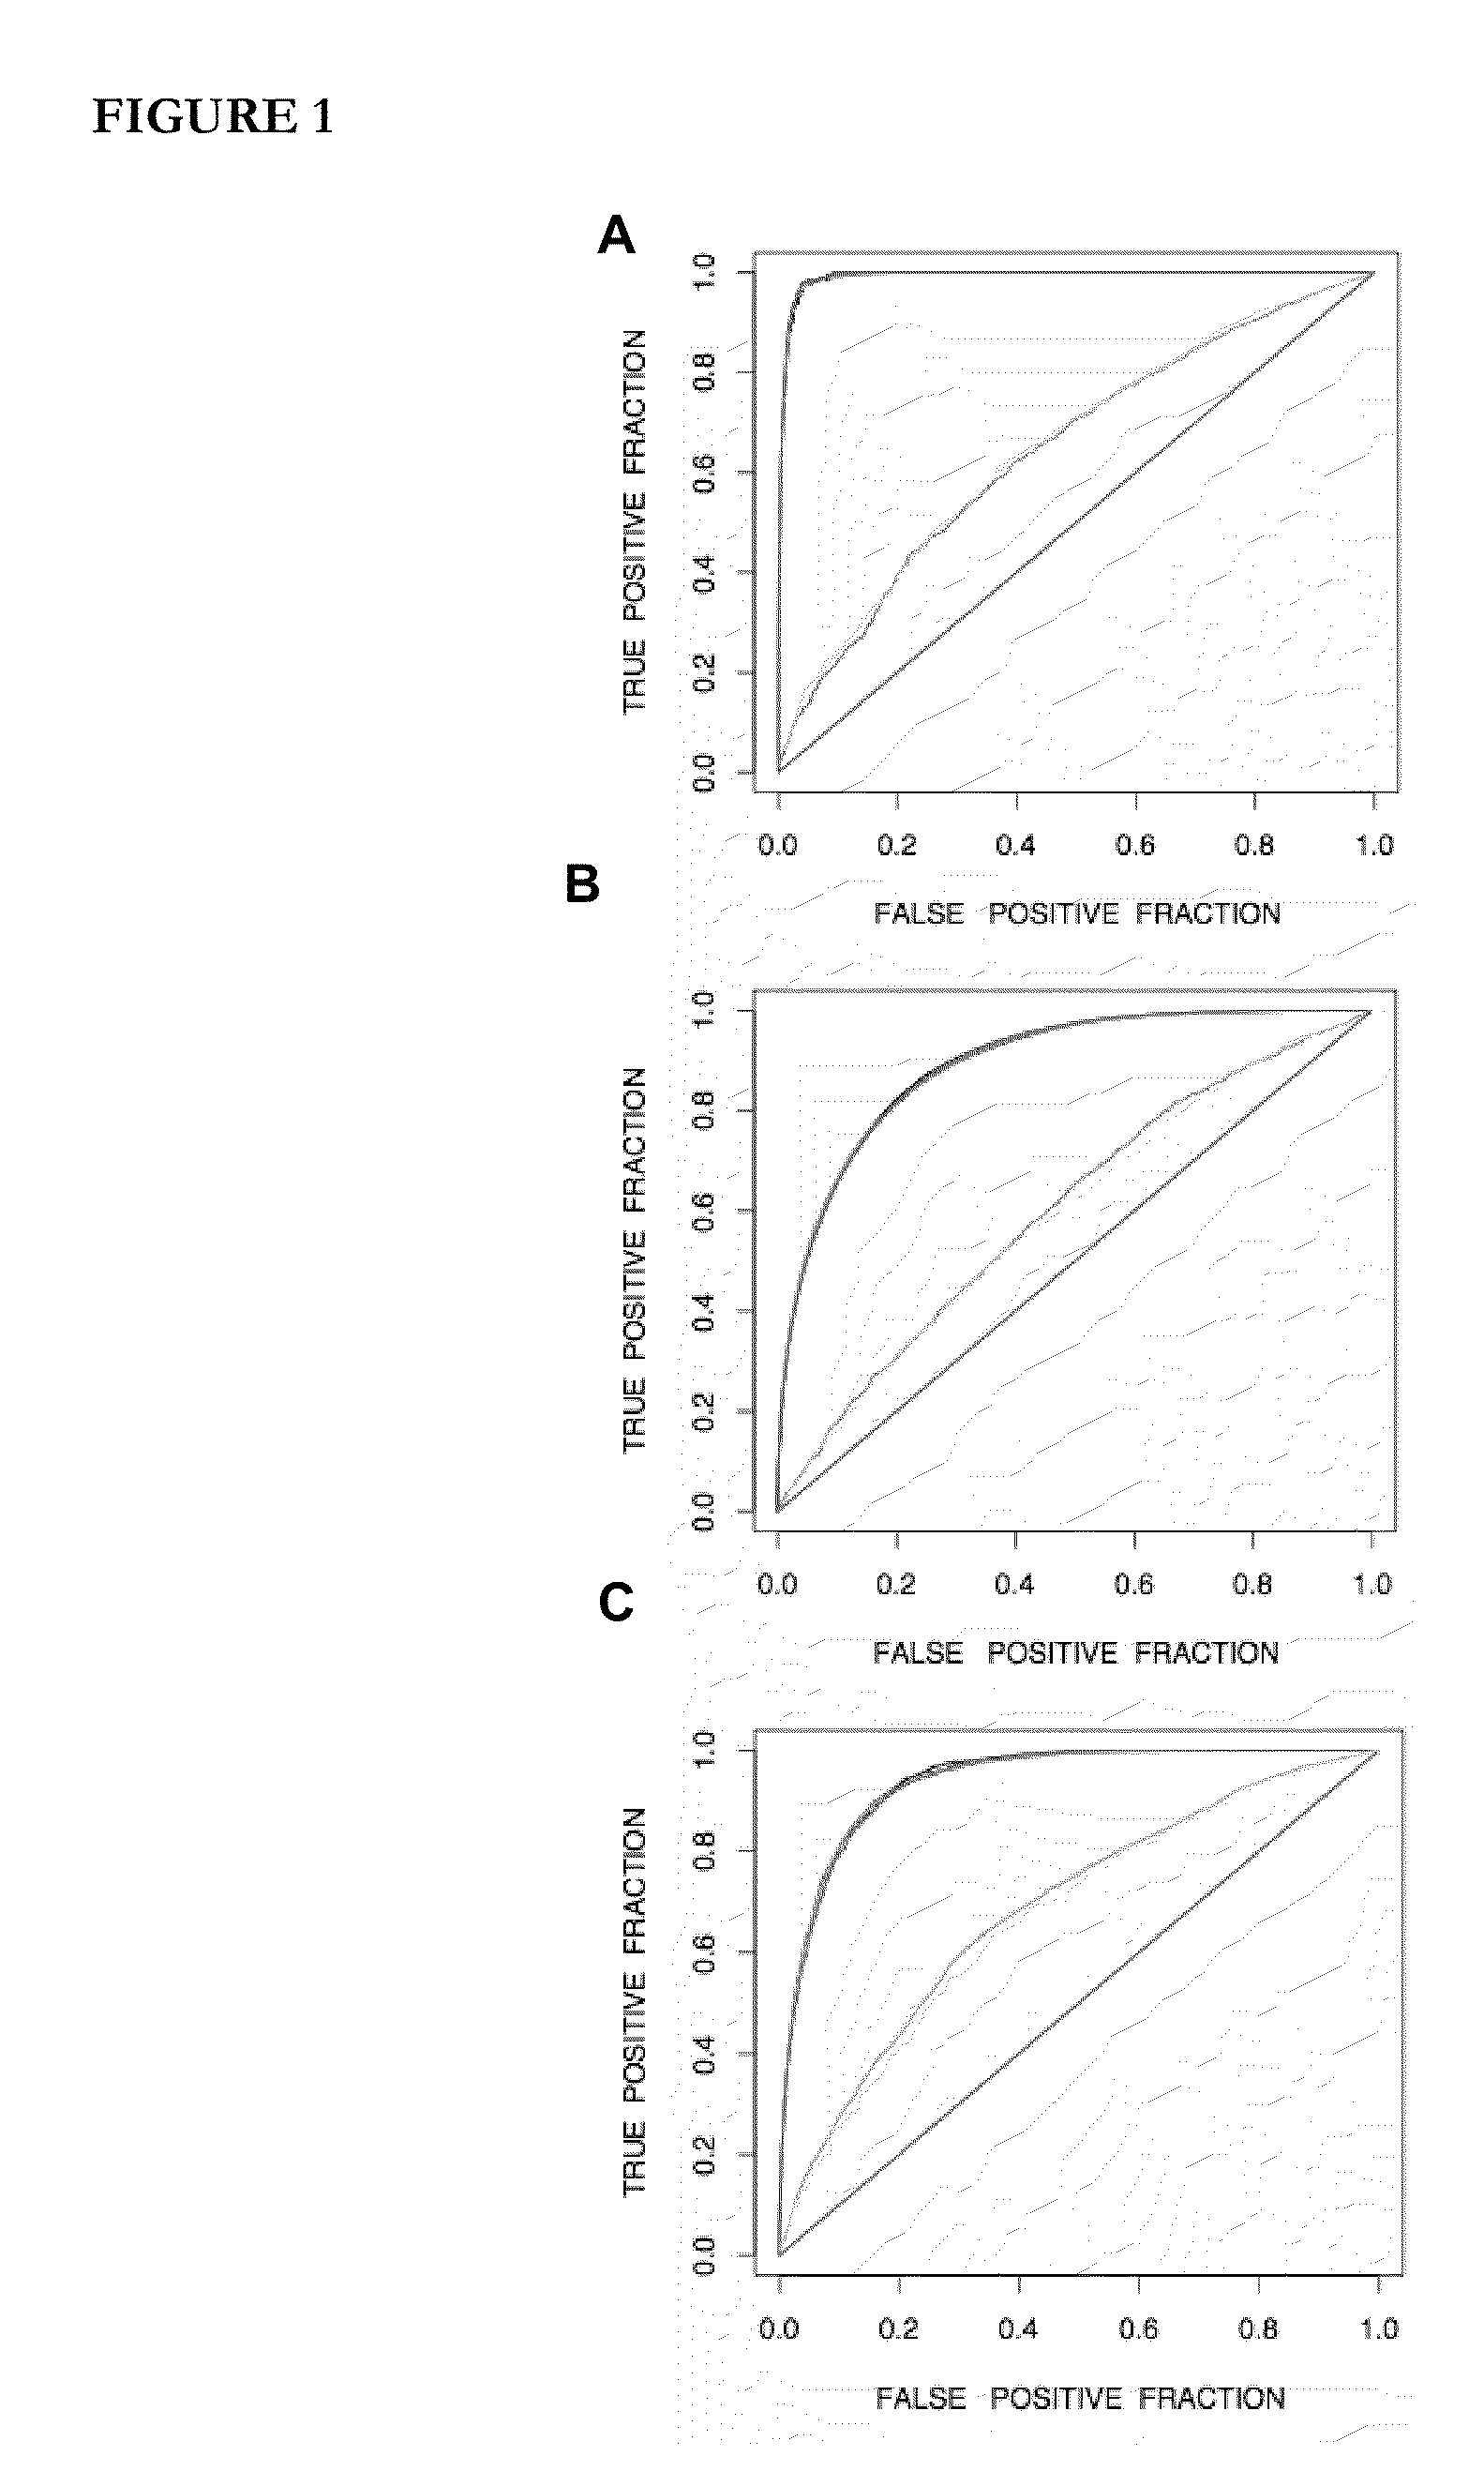
[0243]The GCI score is based on the assumptions that all SNPs are independent of one another and that they have independent effects on the risk for the disease. As shown in FIG. 1, the three examples studied here show no significant difference between the GCI model and a model in which pairwise dependencies among the SNPs are included through logistic regression. There are some known examples in which SNP-SNP interactions do exist in other diseases and have to be taken into account (for example, Zheng et al., N Engl J Med. 358:910-919 (2008)). If these interactions are known, they can easily be incorporated into the GCI model. However, it is important to understand the effect of unknown SNP-SNP interactions on the risk estimates.
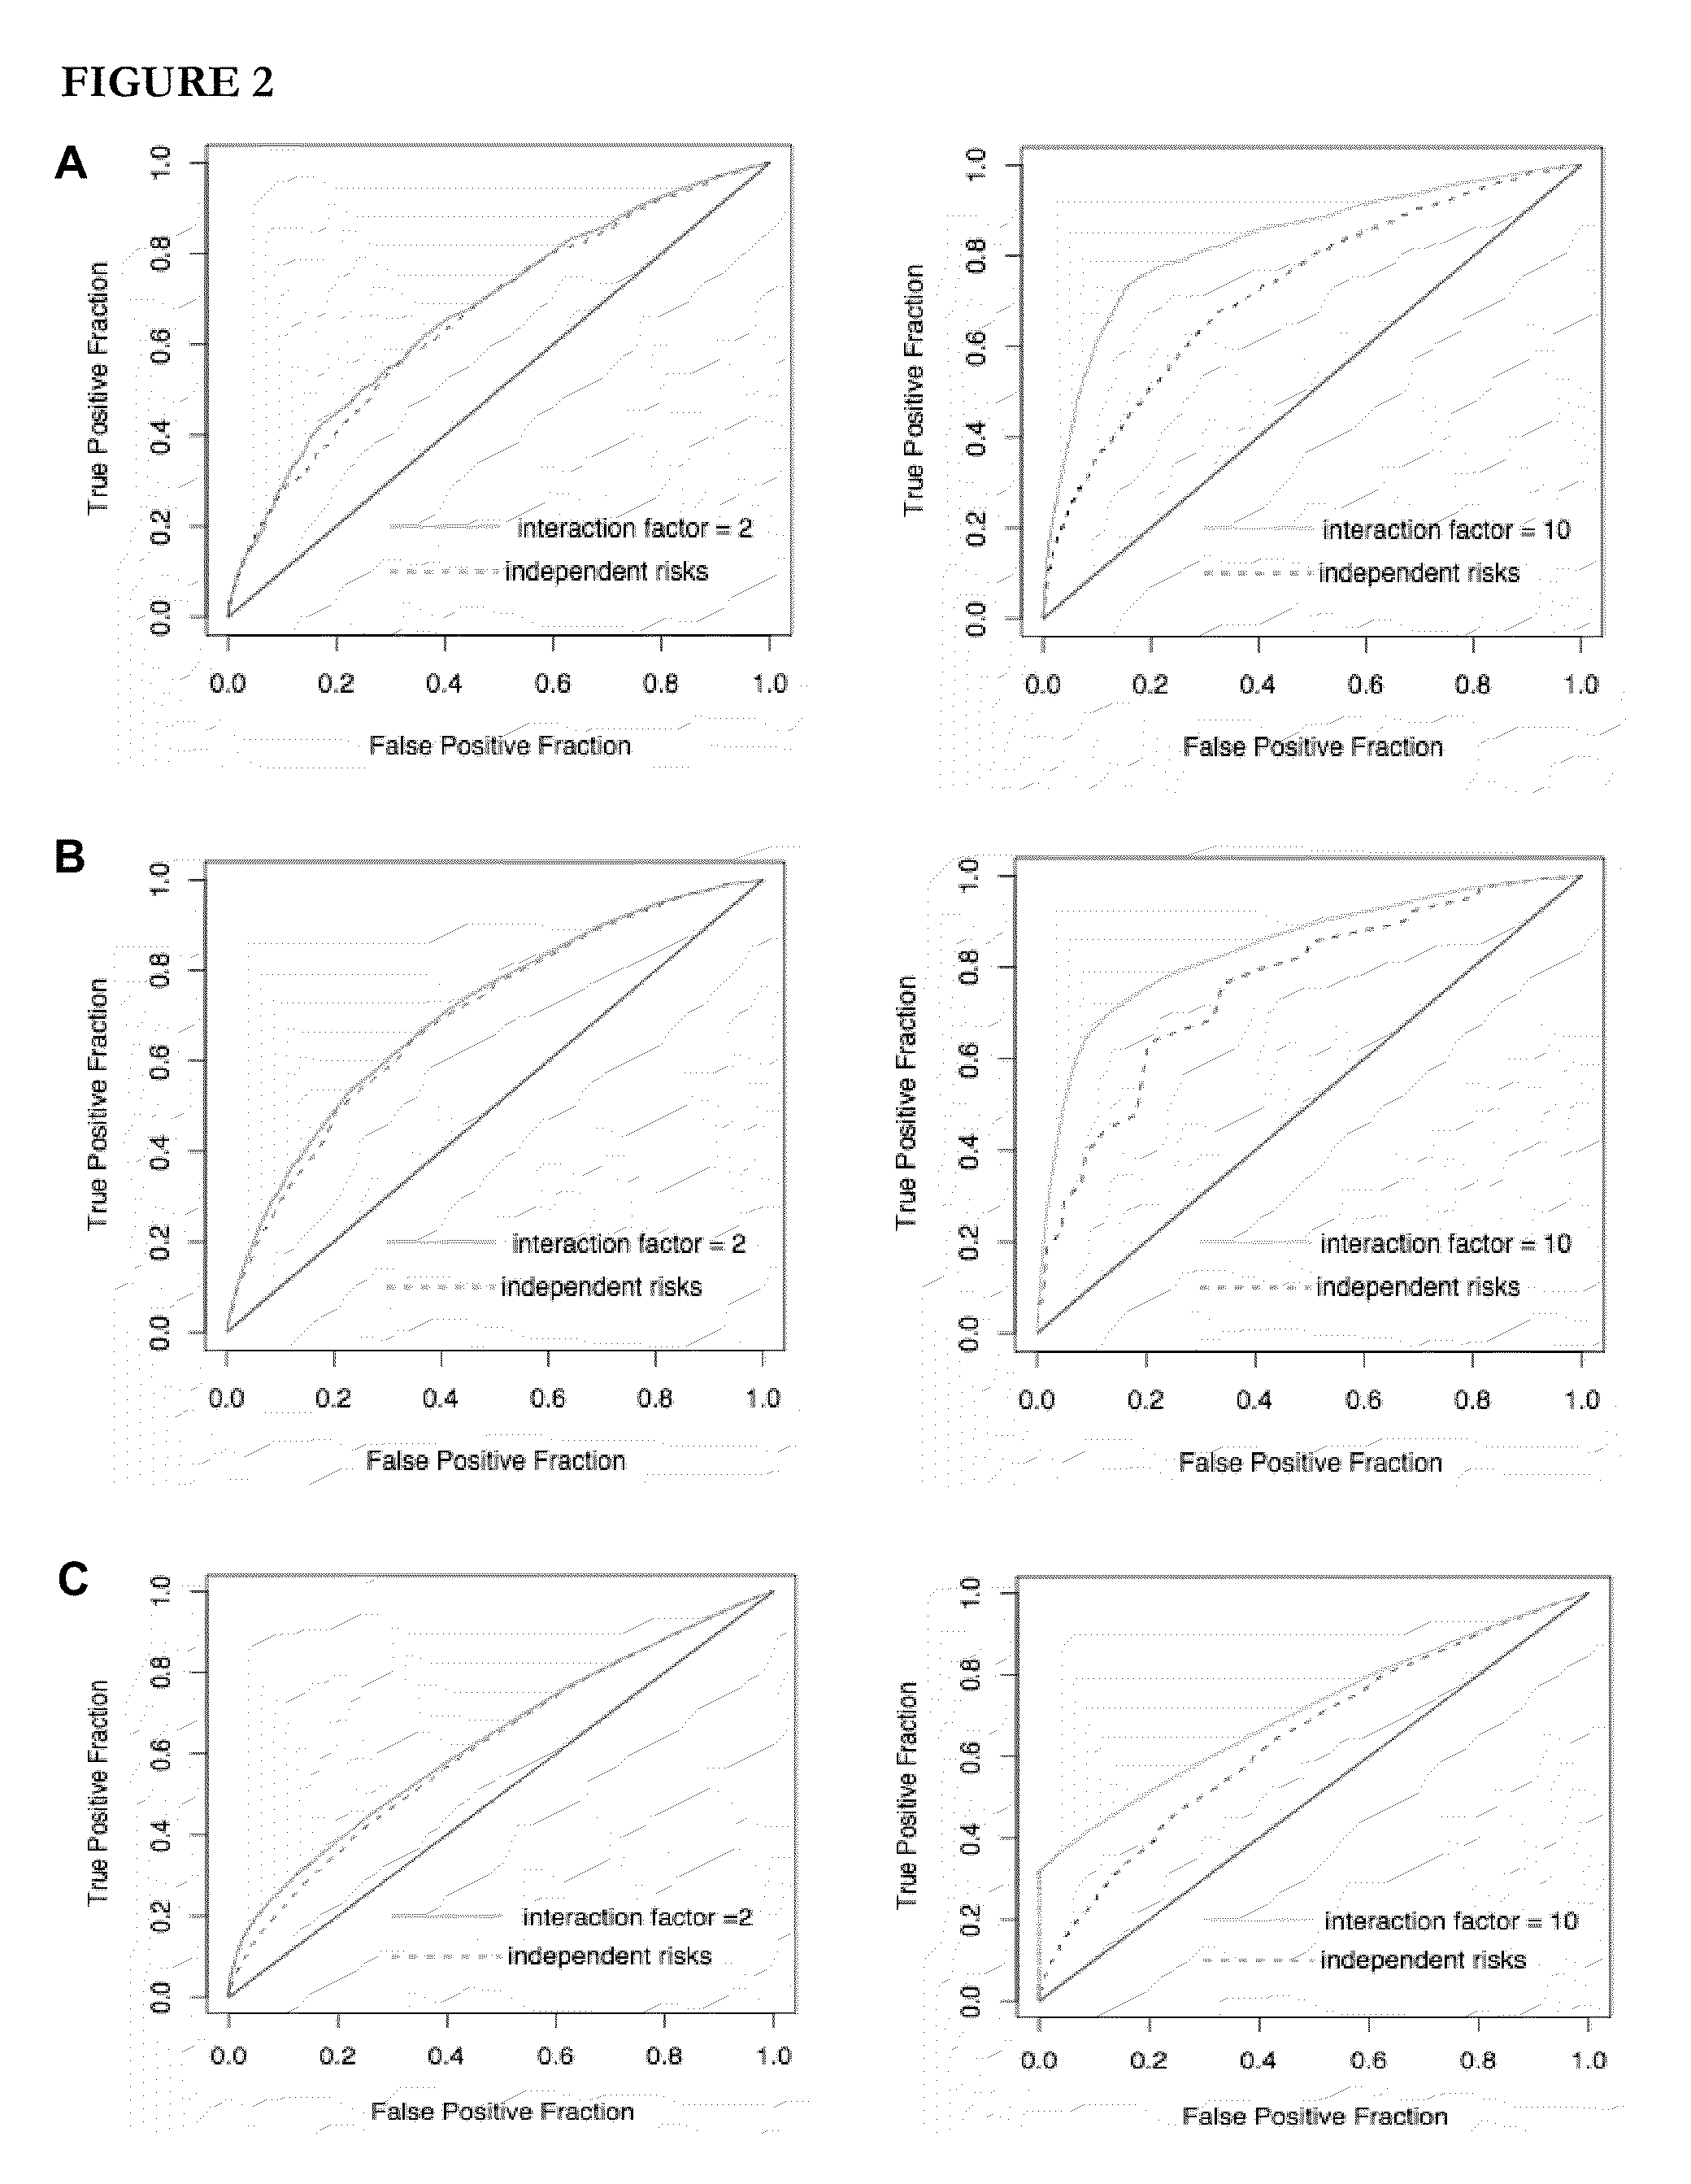
[0244]In order to explore the issue of interactions in greater detail, datasets are simulated under an interaction model where the relative risks are not independent for a single pair of SNPs in the dataset. ...
example 3
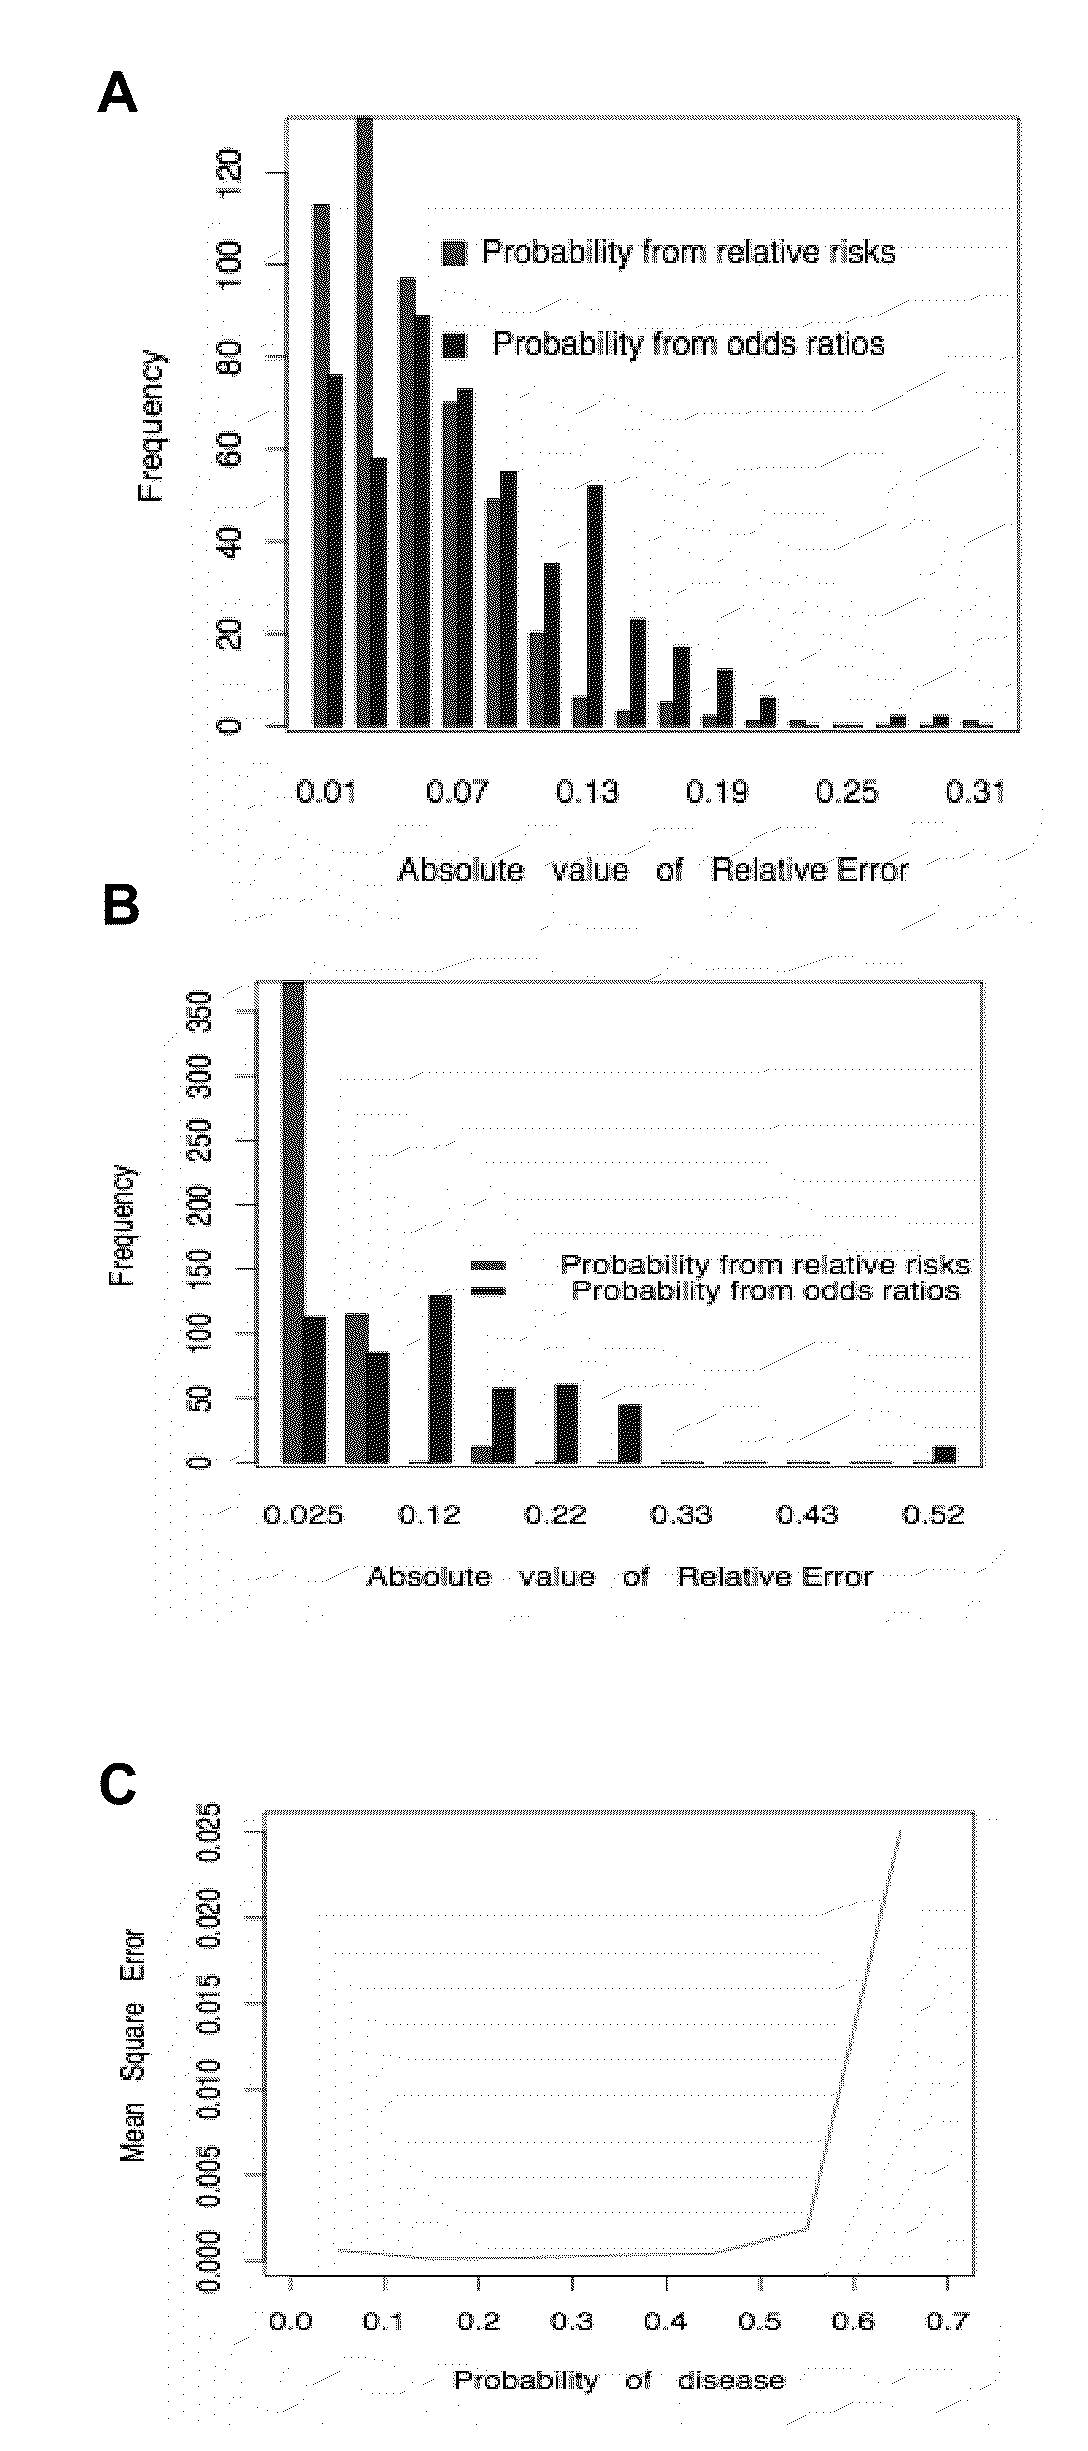
Measuring the Absolute Error in the Risk Estimate
[0248]The ROC curve serves as one metric for evaluating a diagnostic in that it provides a quantitative measure of the ability of the test to distinguish between healthy and sick individuals. However, when estimating lifetime risk, the ROC curve may not be an ideal measure if the correct probabilistic estimate is not used. In particular, for any given pair of score functions, f1(G) and f2(G), the ROC curves of the functions will be identical as long as f1 is a monotonic increasing function of f2. For instance, we could simply assign f2(G)=log(f1(G)), and in this case by using the scores f1 and f2 to estimate risk we will get exactly the same ROC curves. However, these two functions may give very different probabilistic risk estimates to individuals. Thus, the ROC curves may not necessarily be a good measure for tests that report probabilistic risk. For probabilistic risk assessment a more informative test would be the average absolute...
PUM
 Abstract
Description
Claims
Application Information