Enterprise Information Security Management Software For Prediction Modeling With Interactive Graphs

Inactive Publication Date: 2010-10-28
ALLGRESS
View PDF18 Cites 301 Cited by
  • Summary
  • Abstract
  • Description
  • Claims
  • Application Information

AI Technical Summary

Benefits of technology

[0015]In an implementation, an information technology (IT) security software application permits performing what-if analysis based on factors including current risk analysis and future activities. Given current risk analysis data (from historical or current data), the user inputs future budgets and information about future activities such as expansion into other location, new offices, closing of offices, new software or hardware being deployed, more money being allocated to one location, less money being allocated at another location, and other future factors. This future activities information can be entered into the system as numerical info and given a date. For example, the expected budget for a San Francisco office for each month of a future year can be entered into the system. The IT security will provide charts, reports, and graphs showing and reflecting the potential changes in security risks, costs, vulnerabilities, controls, and others. Many different future inputs are provided to the what-if system (possibly from many different users or many different sources), the system's charts, reports, and graphs make it easier for a user to comprehend the vast amount of input data and to identify potential future security problems (such as seeing changes in an animated graph over time). Based on the what-if analysis, the IT security

Problems solved by technology

Security breaches could allow new product lines to fall into the hands of competitors, lost business, law suit

Method used


Image

  • Enterprise Information Security Management Software For Prediction Modeling With Interactive Graphs
  • Enterprise Information Security Management Software For Prediction Modeling With Interactive Graphs
  • Enterprise Information Security Management Software For Prediction Modeling With Interactive Graphs

Examples


Embodiment Construction

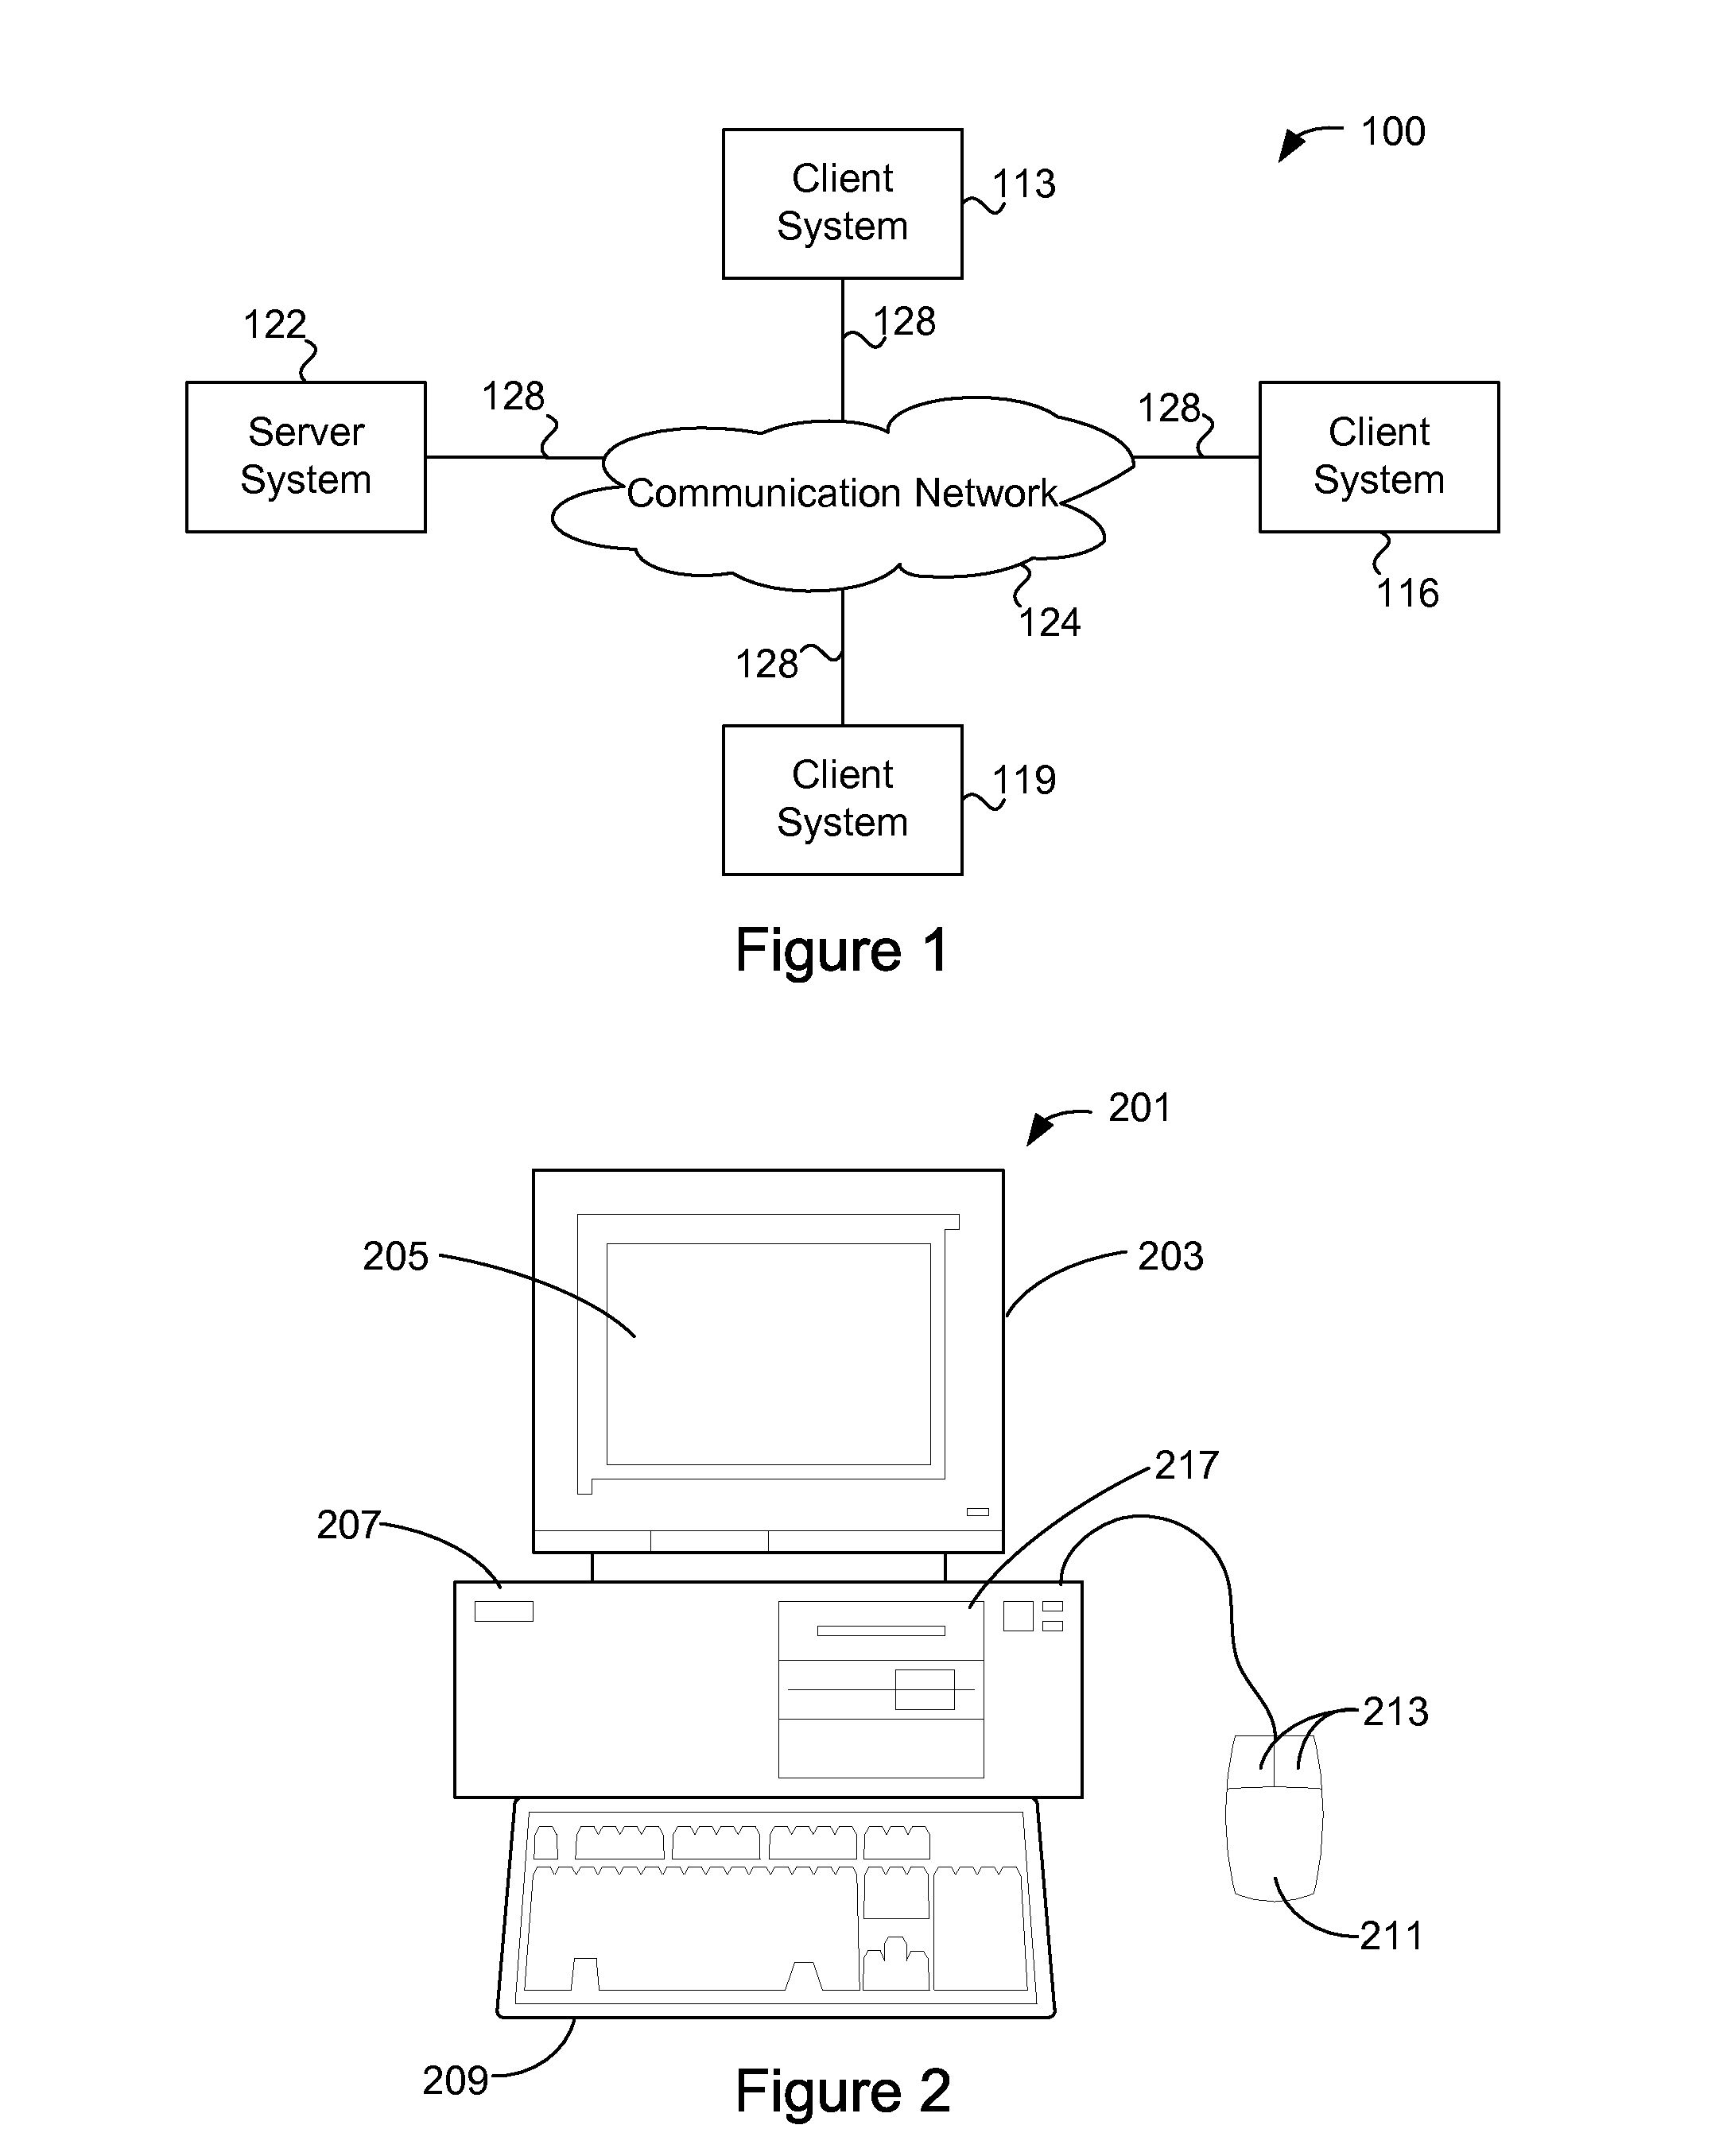
[0046]FIG. 1 is a simplified block diagram of a distributed computer network 100 incorporating an embodiment of the present invention. Computer network 100 includes a number of client systems 113, 116, and 119, and a server system 122 coupled to a communication network 124 via a plurality of communication links 128. Communication network 124 provides a mechanism for allowing the various components of distributed network 100 to communicate and exchange information with each other.

[0047]Communication network 124 may itself be comprised of many interconnected computer systems and communication links. Communication links 128 may be hardwire links, optical links, satellite or other wireless communications links, wave propagation links, or any other mechanisms for communication of information. Various communication protocols may be used to facilitate communication between the various systems shown in FIG. 1. These communication protocols may include TCP / IP, HTTP protocols, wireless applic...


PUM


Abstract

Various baseline security measurements of assets are collected and calculated by the system. A user creates a what-if scenario by changing one or more baseline security measurements. The system generates interactive, animated graphs that compare the baseline security measurements against the what-if scenario.

Description

CROSS-REFERENCE TO RELATED APPLICATIONS [0001]This patent application claims the benefit of U.S. provisional patent application 61 / 172,616, filed Apr. 24, 2009, which is incorporated by reference along with all other references cited in this application.BACKGROUND OF THE INVENTION[0002]This invention relates to the field of information systems, and more specifically to enterprise information security.[0003]Organizations and enterprises are essentially a collection of assets. An asset is anything that has value to an organization. Assets can range from data files to physical assets. Assets may also include intangibles such as an organization's reputation and the skill sets of its workforce.[0004]These assets include a great deal of information. In many cases, the information is confidential. The information may concern employees, customers, products, research, and financial status. The information may be stored on a variety of media including, for example, disk drives, floppy disks, ...

Claims


Application Information

Patent Timeline
IPC IPC(8): G06F21/00G09G5/02
CPCG06F21/577G06T11/206G06T11/001
Inventor BENNETT, JEFFSTAGER, MIKESHEVLIN, GORDONTANG, WILLIAM
Owner ALLGRESS
Why Eureka
Try Eureka