Fluorescence Imaging Apparatus and Method for Detecting Fluorescent Image

a fluorescent image and fluorescence imaging technology, applied in the field of optical bioimaging technique using fluorescence detection, can solve the problems of inability to watch the proliferation of cells of a single individual with the passage of time over a long time, the detection limit of fluorescence deterioration, and the inability to vividly image fluorescent components

Inactive Publication Date: 2011-07-14
SHIMADZU CORP
View PDF8 Cites 26 Cited by
  • Summary
  • Abstract
  • Description
  • Claims
  • Application Information

AI Technical Summary

Benefits of technology

[FIG. 6] The figures each show image data showing an actual example of advantageous effects of an absorption filter, and FIG. 6(a) shows a case where no absorption filter is present, FIG. 6(b) shows a case where the absorption filter is present, FIG. 6(c) is a chart showing the (light) intensity at the sectional center of the image (a) in the transverse direction, FIG. 6(d) is a chart showing the (light) intensity at the sectional center of the image (b) in the transverse direction, and FIG. 6(e) is a perspective view illustrating a measured sample.
of an absorption filter, and FIG. 6(a) shows a case where no absorption filter is present, FIG. 6(b) shows a case where the absorption filter is present, FIG. 6(c) is a chart showing the (light) intensity at the sectional center of the image (a) in the transverse direction, FIG. 6(d) is a chart showing the (light) intensity at the sectional center of the image (b) in the transverse direction, and FIG. 6(e) is a perspective view illustrating a measured sample.
[FIG. 7] The figure is a waveform chart showing the wavelength property of a fluorescent dye, ICG, and further shows wavelength properties of a light source and a filter when ICG is target.
[FIG. 8] The figure is a waveform chart showing combinations in each of which a wavelength of a usable LD is combined with (the wavelength property of) an actual absorption filter.
[FIG. 9] The figure is a waveform chart showing the spectrum of a single-wavelength light source, and the wavelength property of each of filters.
[FIG. 10] The figure is a schematic structural view of a system of measuring fluorescence from a macro sample.

Problems solved by technology

However, according to the method, it is impossible to watch the proliferation of cells of a single individual with the passage of time over a long term.
If the excitation light radiated onto the sample does not contain stray light at all, the following drawback is caused when the emission-side filter is insufficient in capability so as not to remove the wavelength components of the excitation light completely: components of the excitation light reflected on the sample are partially transmitted through the emission-side filter so as to overlap with the fluorescent components from the sample, so that the detection limit of the fluorescence is deteriorated.
The deterioration in the fluorescence detection limit causes feeble fluorescent components to be buried in noises, so that the fluorescent components cannot be vividly imaged.
When the fluorescence detection limit is bad, such feeble fluorescent components cannot be vividly captured.

Method used


Image

  • Fluorescence Imaging Apparatus and Method for Detecting Fluorescent Image
  • Fluorescence Imaging Apparatus and Method for Detecting Fluorescent Image
  • Fluorescence Imaging Apparatus and Method for Detecting Fluorescent Image

Examples


example 2

With reference to FIG. 4, a description is made about a case where the invention is applied to a micro sample, for which a microscope is used.

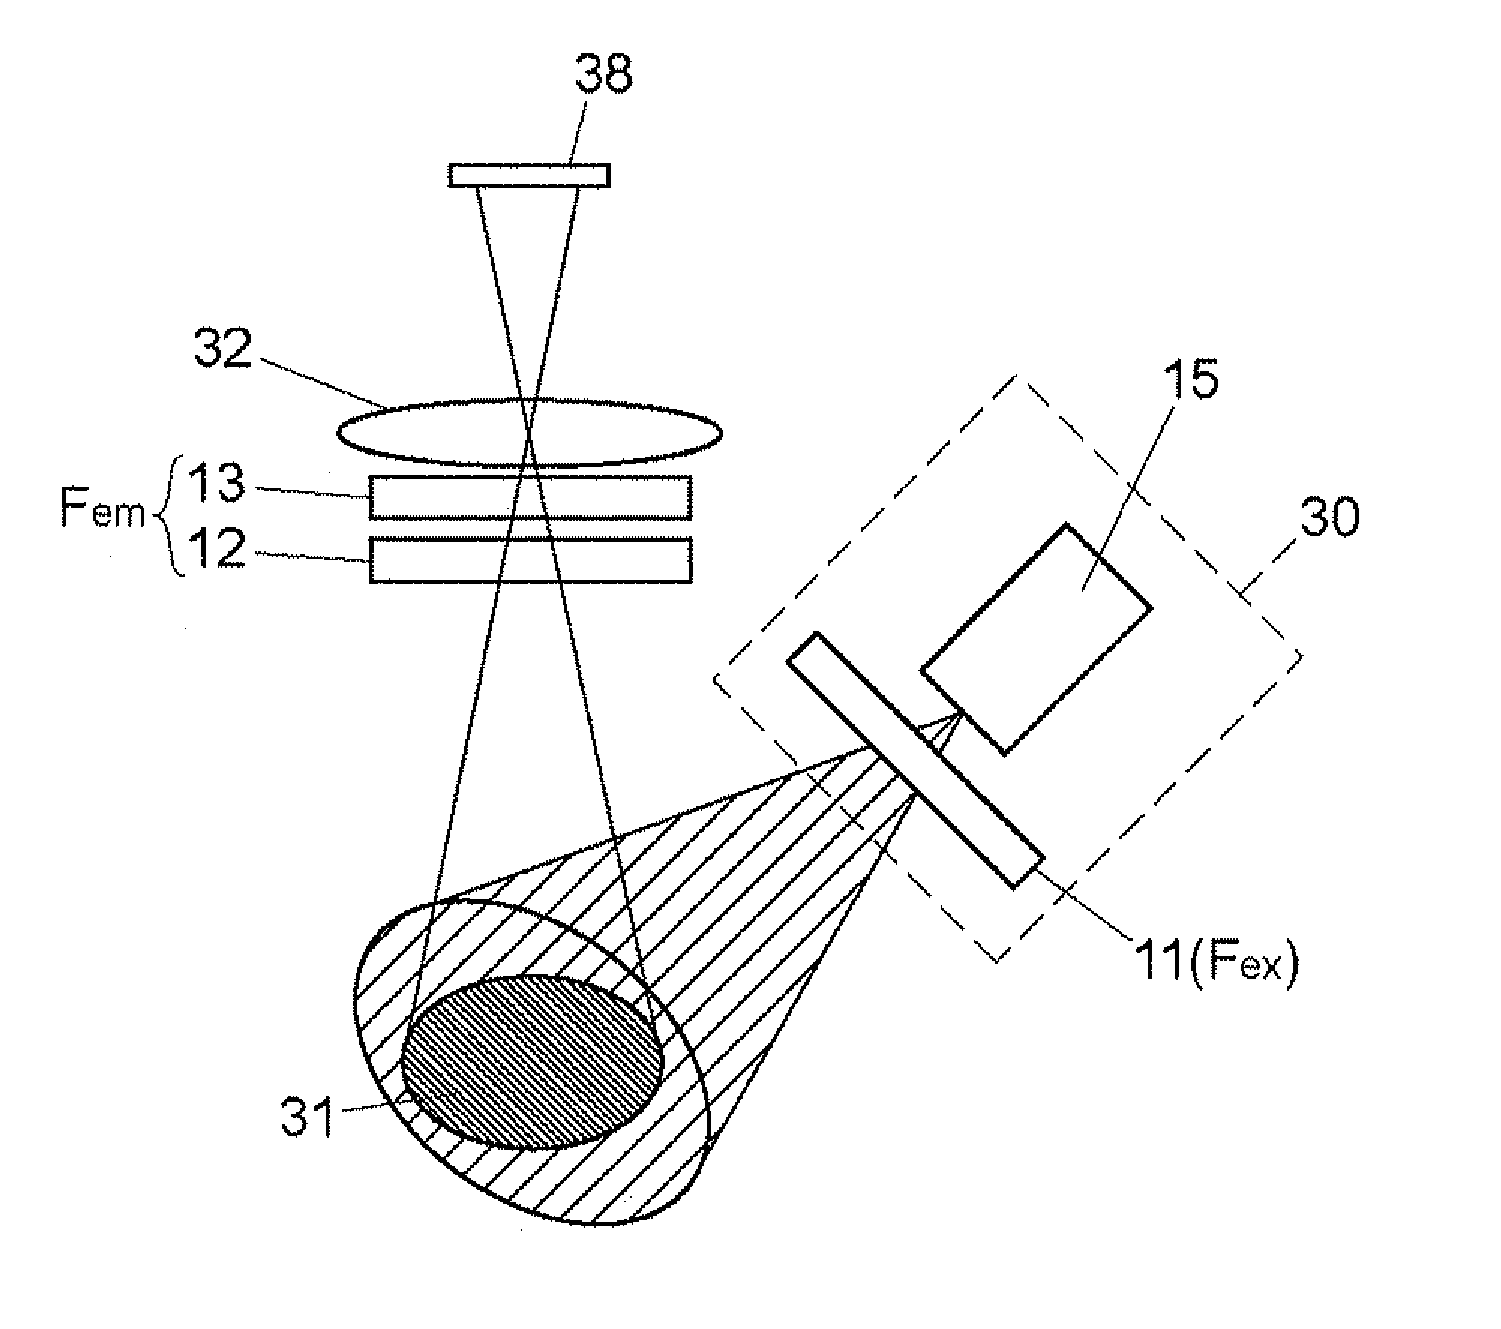
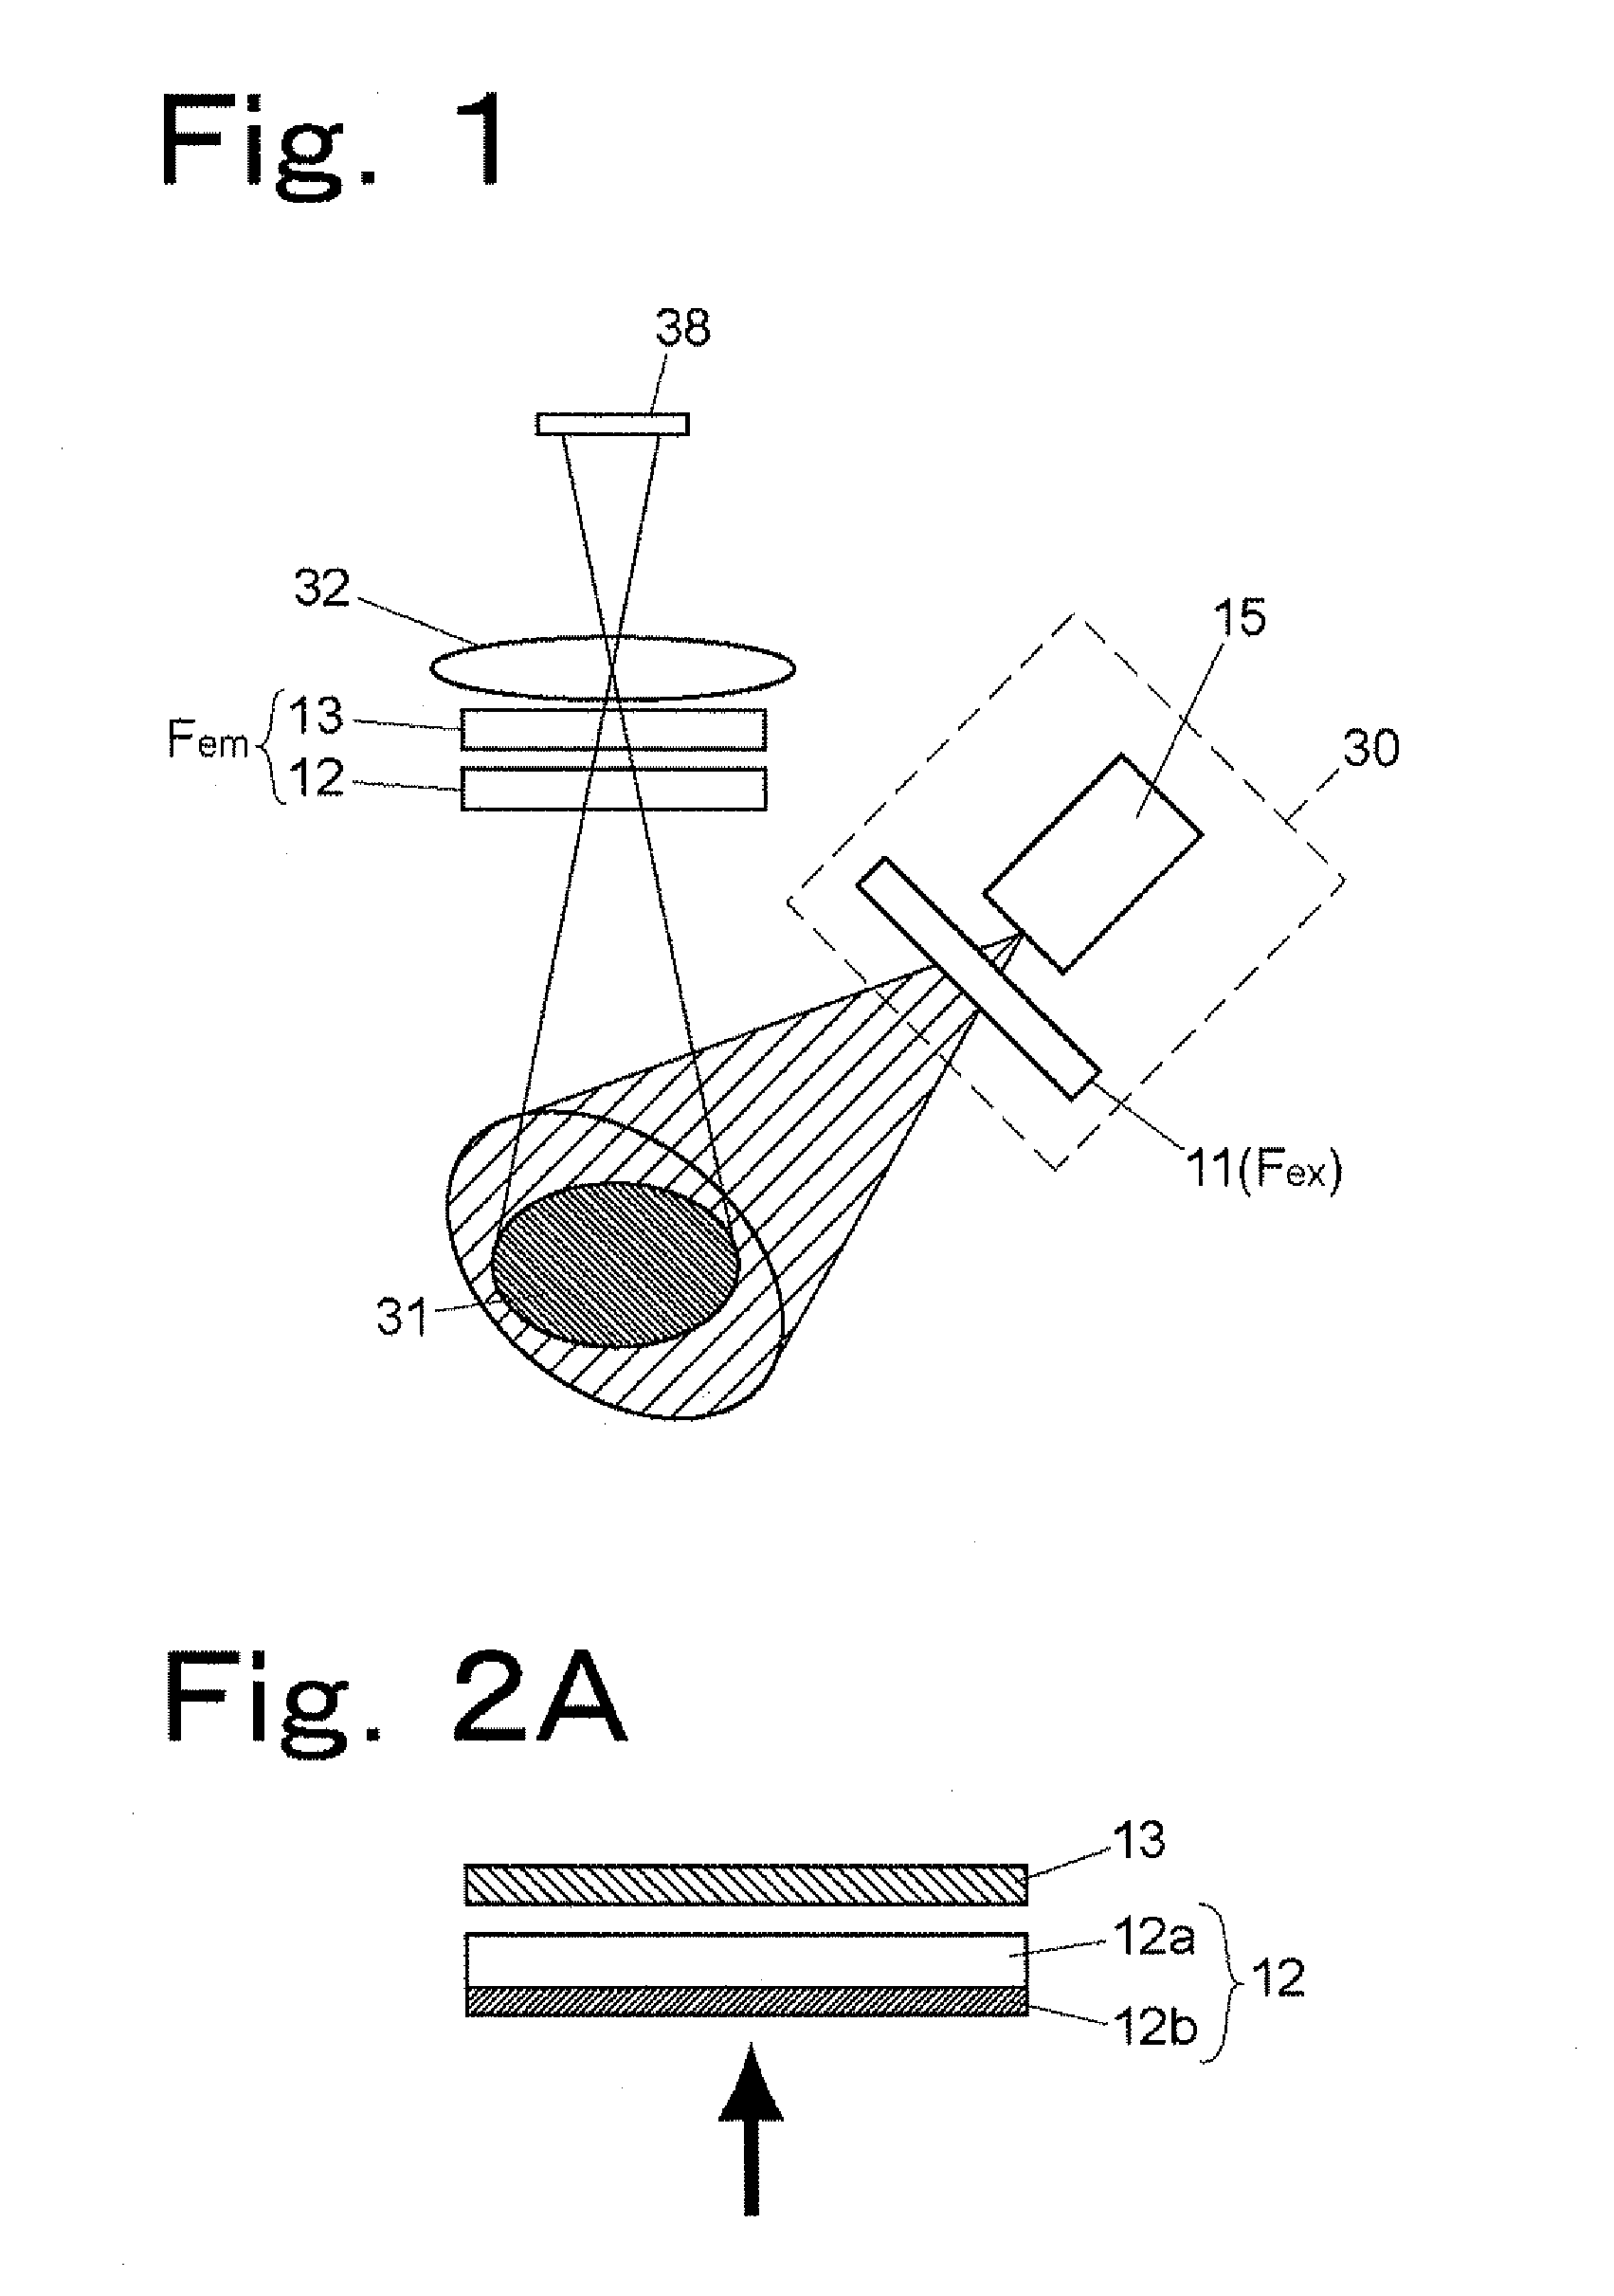
The system in this figure is not substantially varied from ordinary fluorescence microscopes. In the fluorescence microscope, an important member for functions of the excitation side and the emission-side is a rectangular beam splitter 61 wherein two prisms are caused to adhere onto each other. Toward two surfaces thereof are arranged an excitation-side filter 11 (Fex) and an emission-side filter section (Fem) paired therewith. This fluorescence microscope is different from conventional fluorescent microscopes in that the emission-side filter section (Fem) is composed of a multi-layered interferece filter 12 and an absorption filter 13. A light source 15 is a single-wavelength light source; however, the light source 15 may be a continuous spectrum light source.

With reference to FIG. 9, a description is made about the blocked wavelength range r...


PUM

PropertyMeasurementUnit
transmittanceaaaaaaaaaa
transmission wavelengthaaaaaaaaaa

Abstract

In order to reduce light leak influencing the detection capability of a fluorescence imaging apparatus, an interference filter and an absorption filter on an emission-side filter section are arranged serially in the traveling direction of the fluorescence. The interference filter and the absorption filter that are in use for such an arrangement block the waveband light equivalent to the excitation light irradiated onto a sample while fully transmitting the waveband light equivalent to the fluorescence.

Description

BACKGROUND OF THE INVENTION1. Field of the InventionThe present invention relates to an optical bio-imaging technique using fluorescence detection.2. Description of the Related ArtThe method for attaining imaging as to what state a molecular species in a living body or in cells is distributed into is an important researching method in medical science or biology. At the level of cells, the following method has widely been performed: a method of using a microscope to image a molecular species with a molecular probe to which a fluorescent dye adheres or a gene-expression molecular probe. Regarding those which are larger than cells, such as internal organs, and further, animal individuals, a device has been required for observing considerable molecular species and the state of their distribution while alive.The method is, for example, a technique of bonding a fluorescent probe to a cancer cell in an individual of a mouse or some other, imaging the situation of the proliferation of the c...

Claims


Application Information

Patent Timeline
Patent Type & Authority Applications(United States)
IPC IPC(8): G01N21/64
CPCA61B5/0059G01N21/6428G01N21/6458G01J3/4406G02B21/0032G01N2201/064G02B5/285G01J2003/1226G01N2021/6471G01N2201/0612G02B21/0076
Inventor YAJIMA, ATSUSHIODA, ICHIROHIZUME, KENTAROTSUNAZAWA, YOSHIO
Owner SHIMADZU CORP
Why Eureka
Try Eureka