Method for testing nonlinearity error of high speed digital-to-analog converter

Inactive Publication Date: 2011-07-14
NATIONAL YUNLIN UNIVERSITY OF SCIENCE AND TECHNOLOGY
View PDF2 Cites 2 Cited by
  • Summary
  • Abstract
  • Description
  • Claims
  • Application Information

AI Technical Summary

Benefits of technology

Thus, the present invention does not adopt a high-speed circuit but uses a common logic analyzer to assess the nonlinearity error of a h

Problems solved by technology

However, the design for a high-speed or high-resolution hold-sample circuit is hard to realize.
However, the abovementio

Method used


Image

  • Method for testing nonlinearity error of high speed digital-to-analog converter
  • Method for testing nonlinearity error of high speed digital-to-analog converter
  • Method for testing nonlinearity error of high speed digital-to-analog converter

Examples


Example

The embodiments are described in detail in cooperation with the drawings to demonstrate the technical contents of the present invention.

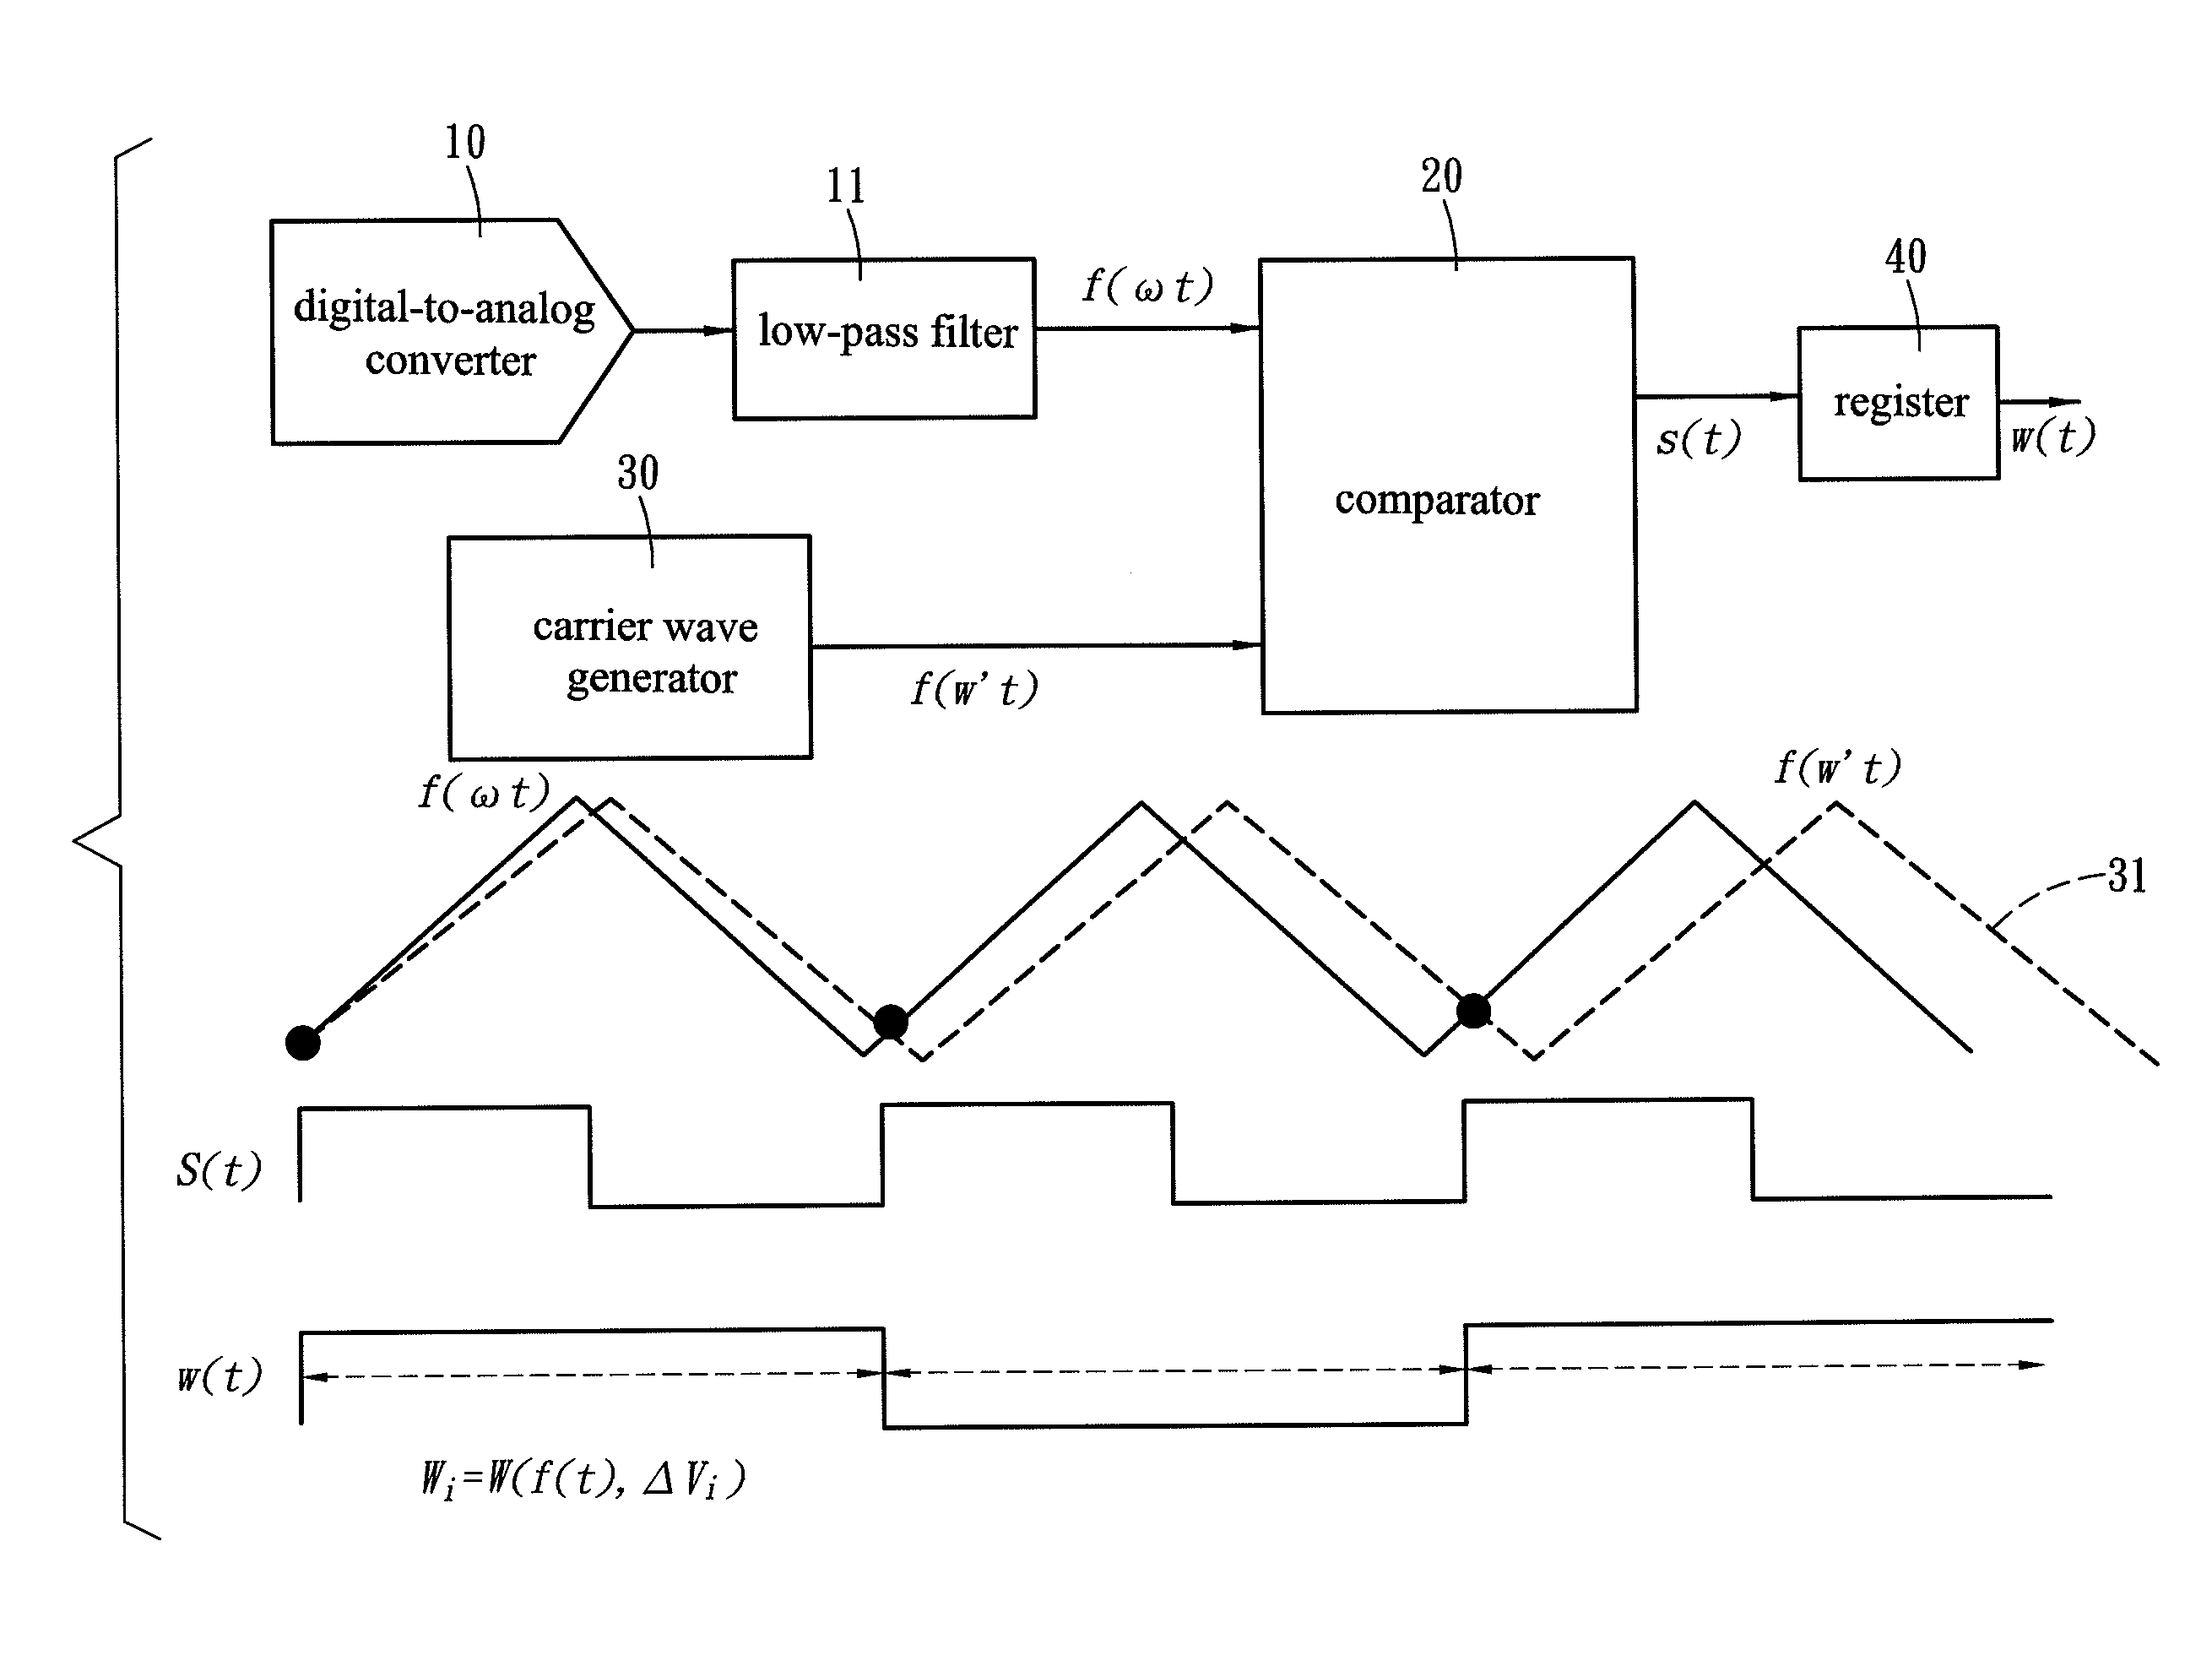
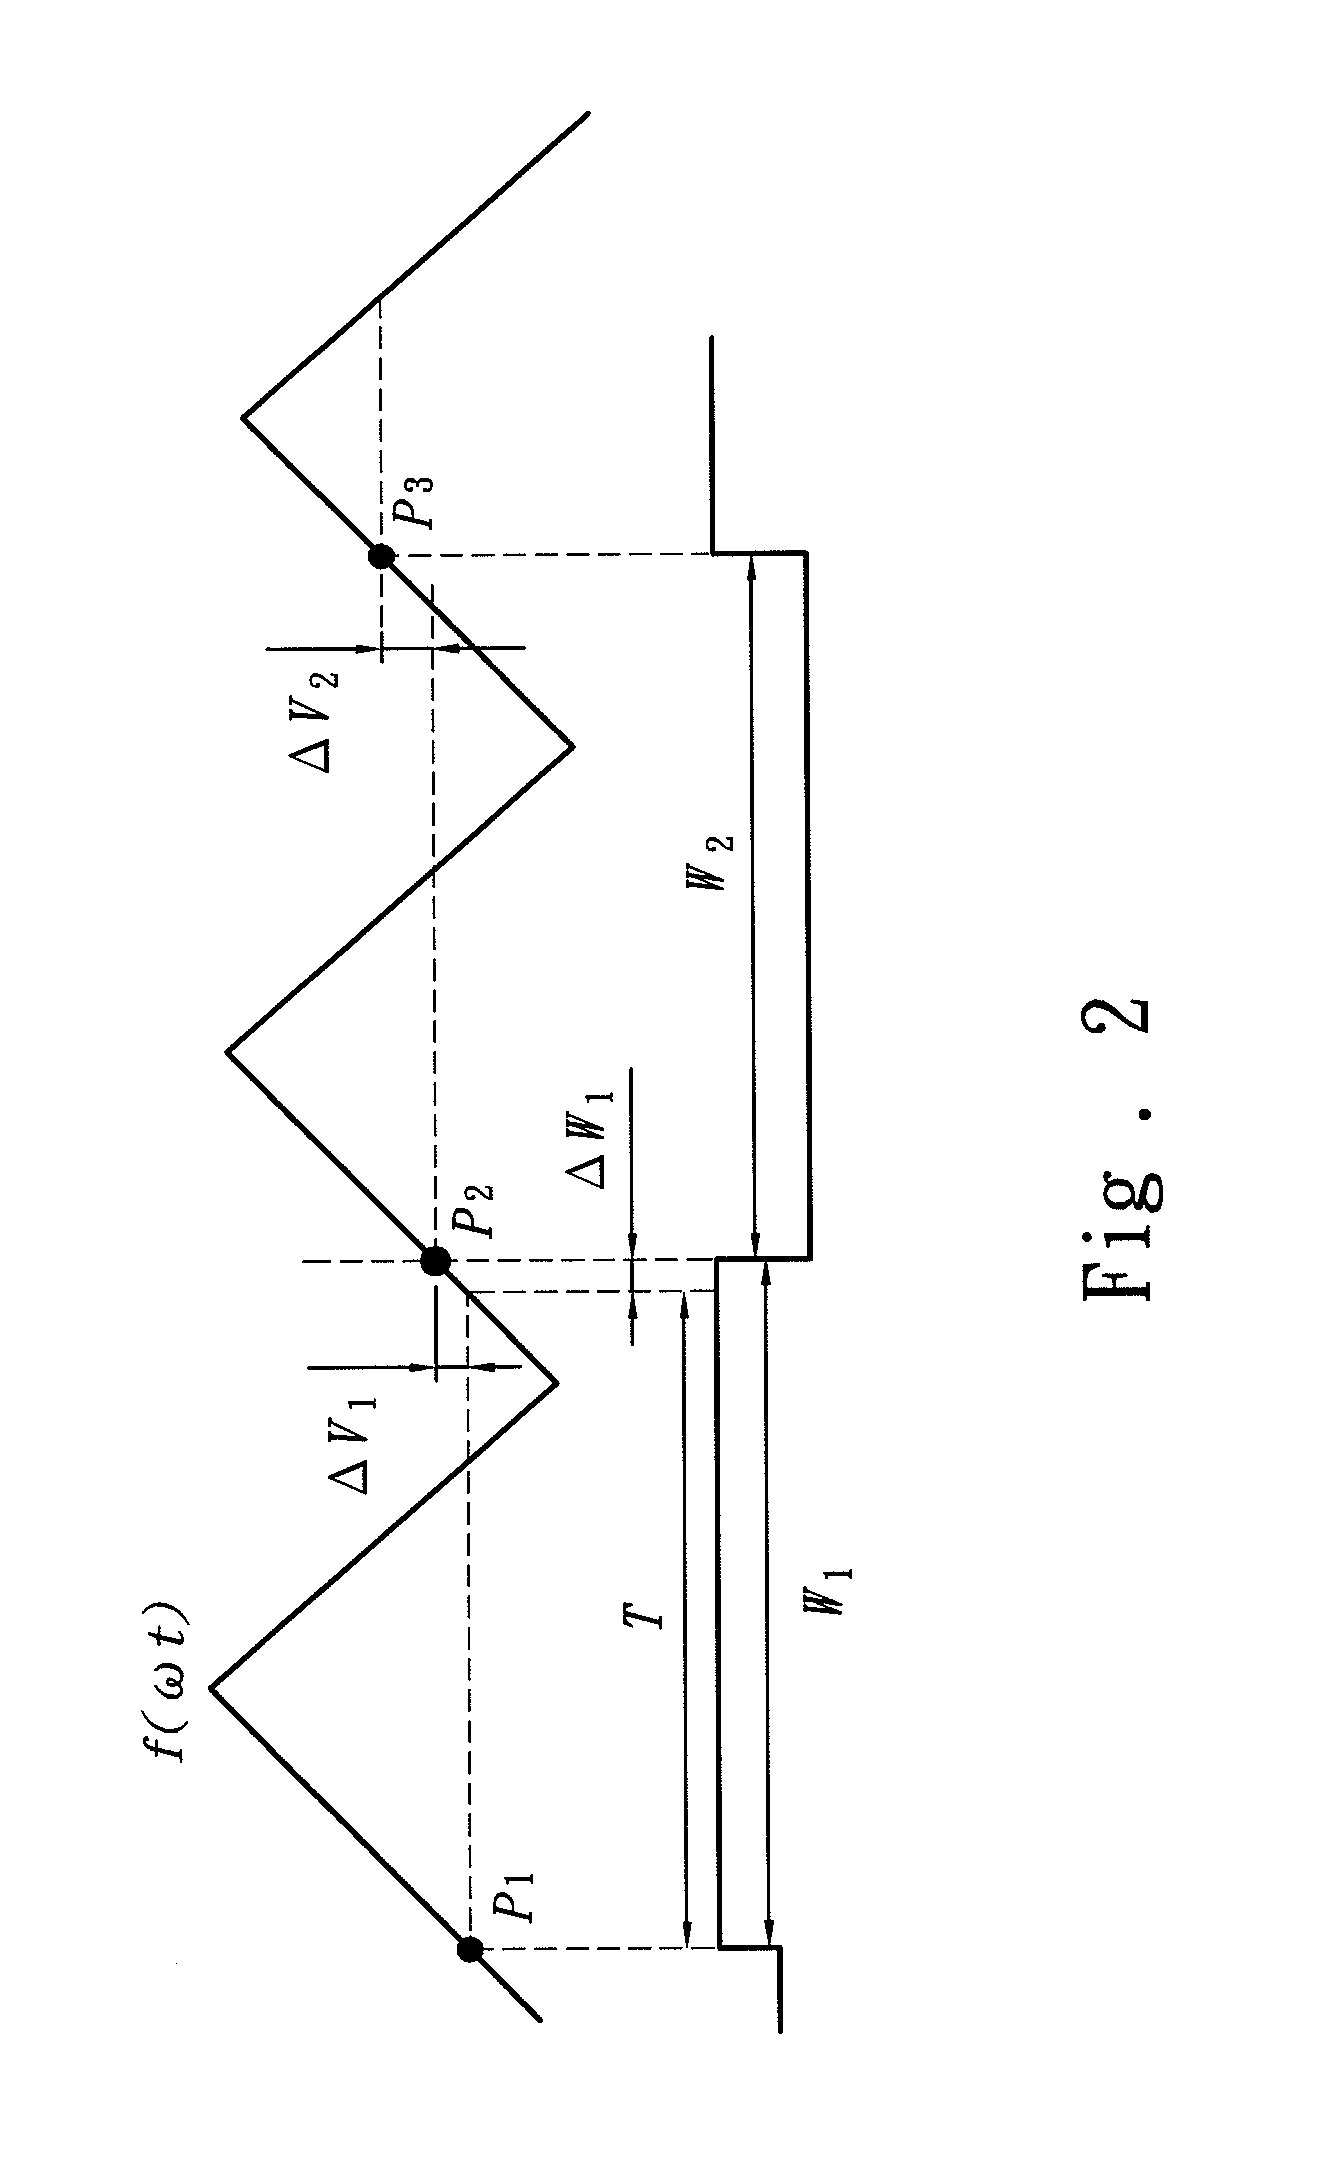
Refer to FIG. 2 and FIG. 3 for the sampling theorem of the present invention. Suppose that f(ωt) is the waveform output by a digital-to-analog converter (DAC) 10 and that the waveform has a period of T. Three sampling points p1, p2 and p3, which are originally sampled from a single cycle, are respectively arranged in three different cycles. Respectively define the time difference and voltage difference of a first sampling point and a second sampling point to be ΔW1 and ΔVi. Thus, ΔWi=Wi−T. The nonlinearity error of the tested circuit f(ωt) / dt can express the signal difference of the sampling points as the pulse width signal, i.e. the variation of the pulse width ΔWi.

Refer to FIG. 3 for the sampling circuit according to the present invention. In FIG. 3, f(ωt) is the digital-to-analog conversion output signal of the DAC 10. The digital-to-analog conve...


PUM


Abstract

A novel method applies the down-conversion sampling technology to test a high-speed digital-to-analog conversion. In the method, a digital-to-analog conversion output signal of a high-speed digital-to-analog converter and a low-frequency sinusoidal carrier wave signal input to a comparator to obtain a low-speed pulse signal. Therefore, the variation of the pulse width of the low-speed pulse signal can be measured by a common logic analyzer to assess the nonlinearity error of the high-speed digital-to-analog converter.

Description

FIELD OF THE INVENTIONThe present invention relates to a method for testing a digital-to analog converter, particularly to a method for testing the nonlinearity error of a high-speed digital-to-analog converter.BACKGROUND OF THE INVENTIONThe high-speed digital-to-analog (D / A) converter has been extensively applied to consumer electronics and communication technology. Refer to FIG. 1. In the conventional test method for the D / A converter (DAC) 1, a precision analog signal measurement circuit 3 containing a sample-hold circuit 4 is arranged in the output 2 of the D / A converter 1. The performance, especially the accuracy and stability, of the sample-hold circuit 4 directly influences the correctness of the measurement results. However, the design for a high-speed or high-resolution hold-sample circuit is hard to realize.The tested signals are usually converted into special test eigenvalues to facilitate analysis. The test eigenvalues are converted into the frequency or the duty ratio o...

Claims


Application Information

Patent Timeline
IPC IPC(8): H03M1/10
CPCH03M1/66H03M1/109
Inventor LIN, CHUN-WEILIN, SHENG-FENG
Owner NATIONAL YUNLIN UNIVERSITY OF SCIENCE AND TECHNOLOGY
Why Eureka
Try Eureka