complex process management

Inactive Publication Date: 2011-08-25
ECOMMERA
10 Cites 225 Cited by

AI-Extracted Technical Summary

Problems solved by technology

This shortcoming precludes such systems from being capable of providing any constructive feedback regarding how a defined objective may be realised, and severely limits their practical utility.
In general, the relationship between generated...

Method used

[0046]As mentioned briefly above, a plurality of different actions exist which a manager of an e-commerce enterprise may vary to affect the performance of the enterprise. Since, in the context of retail enterprise, the ultimate measure of performance is profitability, all further discussion of enterprise performance will be discussed in relation to trading profit. A plurality of actions exist which the manager of an e-commerce enterprise may vary to affect profit. Identifying the one or more relevant actions requiring implementation to increase profit, is an objective of the present e-commerce enterprise management system. It is not a trivial exercise to identify these actions. The difficulty is in part due to the large number of possible variables available, and the massive sets of data generated by the analytics systems, which require analysis to identify the sources of any potential underperformance in the e-commerce enterprise, such that performance may be improved, to increase trading profit. Identification of the sources directly affecting profitability is achievable once the relationship between received source data, performance measures, and available actions is established.
[0049]Ultimately, the hierarchical performance measure relationship framework provides a means for establishing a relationship between generated performance measures, including trading profit and source data. Integrating such a hierarchical performance measure relationship framework into an e-commerce enterprise management system, facilitates the identification of underperformance, which may be attributable to implemented processes, and facilitates the identification of actions required to resolve the identified underperformance. Equally, the method of the present invention may be used to identify the source(s) of overperformance. This is particularly useful in a context where an e-commerce enterprise is performing better than expected however, an understanding of the underlying reasons for the performance is lacking.
[0065]The source data may be transmitted to the enterprise management server 41 using push technology, wherein the data is periodically pushed to the server 41. Equally, the source data may be transmitted to the enterprise management server 41 using pull technology, wherein the required source data is requested by the enterprise management server 41 directly from the relevant e-commerce platform component (i.e. from the analytics system severs 9, 11, 13, 15, 17, 27 and/or the e-commerce server 3). On the basis of the received source data, the enterprise management system 39 is able to analyse the performance of the e-commerce enterprise, and specifically the performance of the online retail website. On the basis of this performance analysis, the enterprise management system is able to identify any underperformance (i.e. identifying underperformance), identify the sources of such underperformance, and to determine actions required to improve performance—i.e. increasing trading profit. In preferred embodiments, this information is presented to a user terminal 47 for review. The user terminal 47, shares a communication channel with the enterprise management system 39, and may be a personal computer. For example, the user terminal 47 may be operatively connected to shared communications channel 7 as illustrated in FIG. 1. The remaining description of the present embodiment describes how the enterprise management system 39 of the present invention is able to determine the required actions to increase trading profit for an online retail enterprise.
[0077]FIG. 4 is a functional overview of the enterprise management server 41 of the present embodiment, which may comprise the storage device 45. FIG. 4 illustrates the various different functional components, which may be comprised within the enterprise management server 41. These include: a data processing module 80, arranged to process data received from either the one or more analytics systems 9, 11, 13, 15, 17, 27 comprised within the e-commerce dashboard, as illustrated in FIG. 1, or data received from the e-commerce server 3; a performance measure calculation module 82 arranged to calculate the plurality of different performance measures, including PIs and KPIs; a graphical user interface (GUI) controller module 84 for graphically presenting data, including performance measures to the user, comprising means for presenting the data as graphs or other convenient and user-friendly data presentation means; an impact calculator module 86, arranged to calculate an ‘impact value’, or equivalently a contribution value to determine the sources contributing most to any identified performance shortcomings; an action rule module 88 for identifying required actions on the basis of an identified source of a performance shortcoming; an eCommera Value Score (EVS) calculator module 90, for calculating the actions likely to have the greatest impact on trading profit; a simulation module 92 for simulating the effects of implementing a selected action on the performance of the e-commerce enterprise; an artificial intelligence (AI) module 94 for amending and/or generating action rules, to improve the accuracy of the enterprise management system. The identified modules are provided for illustrative purposes only and are non-limiting. The skilled reader will appreciate that the functionality of any one of the identified modules may be provided by one or more different modules and such alternative embodiments fall within the scope of the present invention.
[0085]FIG. 6a is a screenshot of a dashboard 140, which may be displayed in a GUI on a user terminal 47 of FIG. 1. The illustrated screenshot relates to the ‘Executive’ dashboard, as indicated by the selected tab 142. Effectively, this dashboard provides a general holistic overview of the performance of the e-commerce enterprise, for the indicated time range 144. The dashboard is separated into different regions, each region conveys information pertinent to a different stage in the enterprise management process of the present embodiment. For example, information relating to the performance analysis stage is provided in region 146. Performance analysis information may relate to displaying the time-variance of KPIs 148 and PIs 150 as mentioned previously. The illustrated dashboard refers to PIs 150 as ‘Top Measures.’ The time variance of each displayed KPI and PI is displayed. Furthermore, the time variance of each KPI and PI may be colour coded to facilitate identification of decreased performance, for example red to indicate a decrease in performance, and green to indicate an improved performance.
[0092]In step 174, the impact calculator module 86 accesses the master database 98 relevant to the subject enterprise, and identifies the processed source data relevant to the selected performance measure (i.e. either a user selected performance measure, or the default trading profit KPI). It is important to recall, that each processed source data comprised within the master database 98, is associated with one or more enterprise business areas. In the ensuing description, the processed source data may be interchangeably referred to as ‘input data’. As mentioned previously, the one or more enterprise business areas input data is associated with, may be referre...

Benefits of technology

[0020]An advantage associated with the present invention is that a performance analysis of a complex entity such as an e-commerce enterprise may be automated. Similarly, the identification of any source of performance variance may also be automated, along with a quantitative measure of the impact the identified source may be having on the performance of the entity.
[...

Abstract

The present invention relates to a computer implemented method and system for determining the source of a determined performance variance of a complex entity, and determining one or more different actions to be taken as a consequence of the determined source of performance variance.

Application Domain

Technology Topic

Image

  •  complex process management
  •  complex process management
  •  complex process management

Examples

  • Experimental program(1)

Example

Worked Example
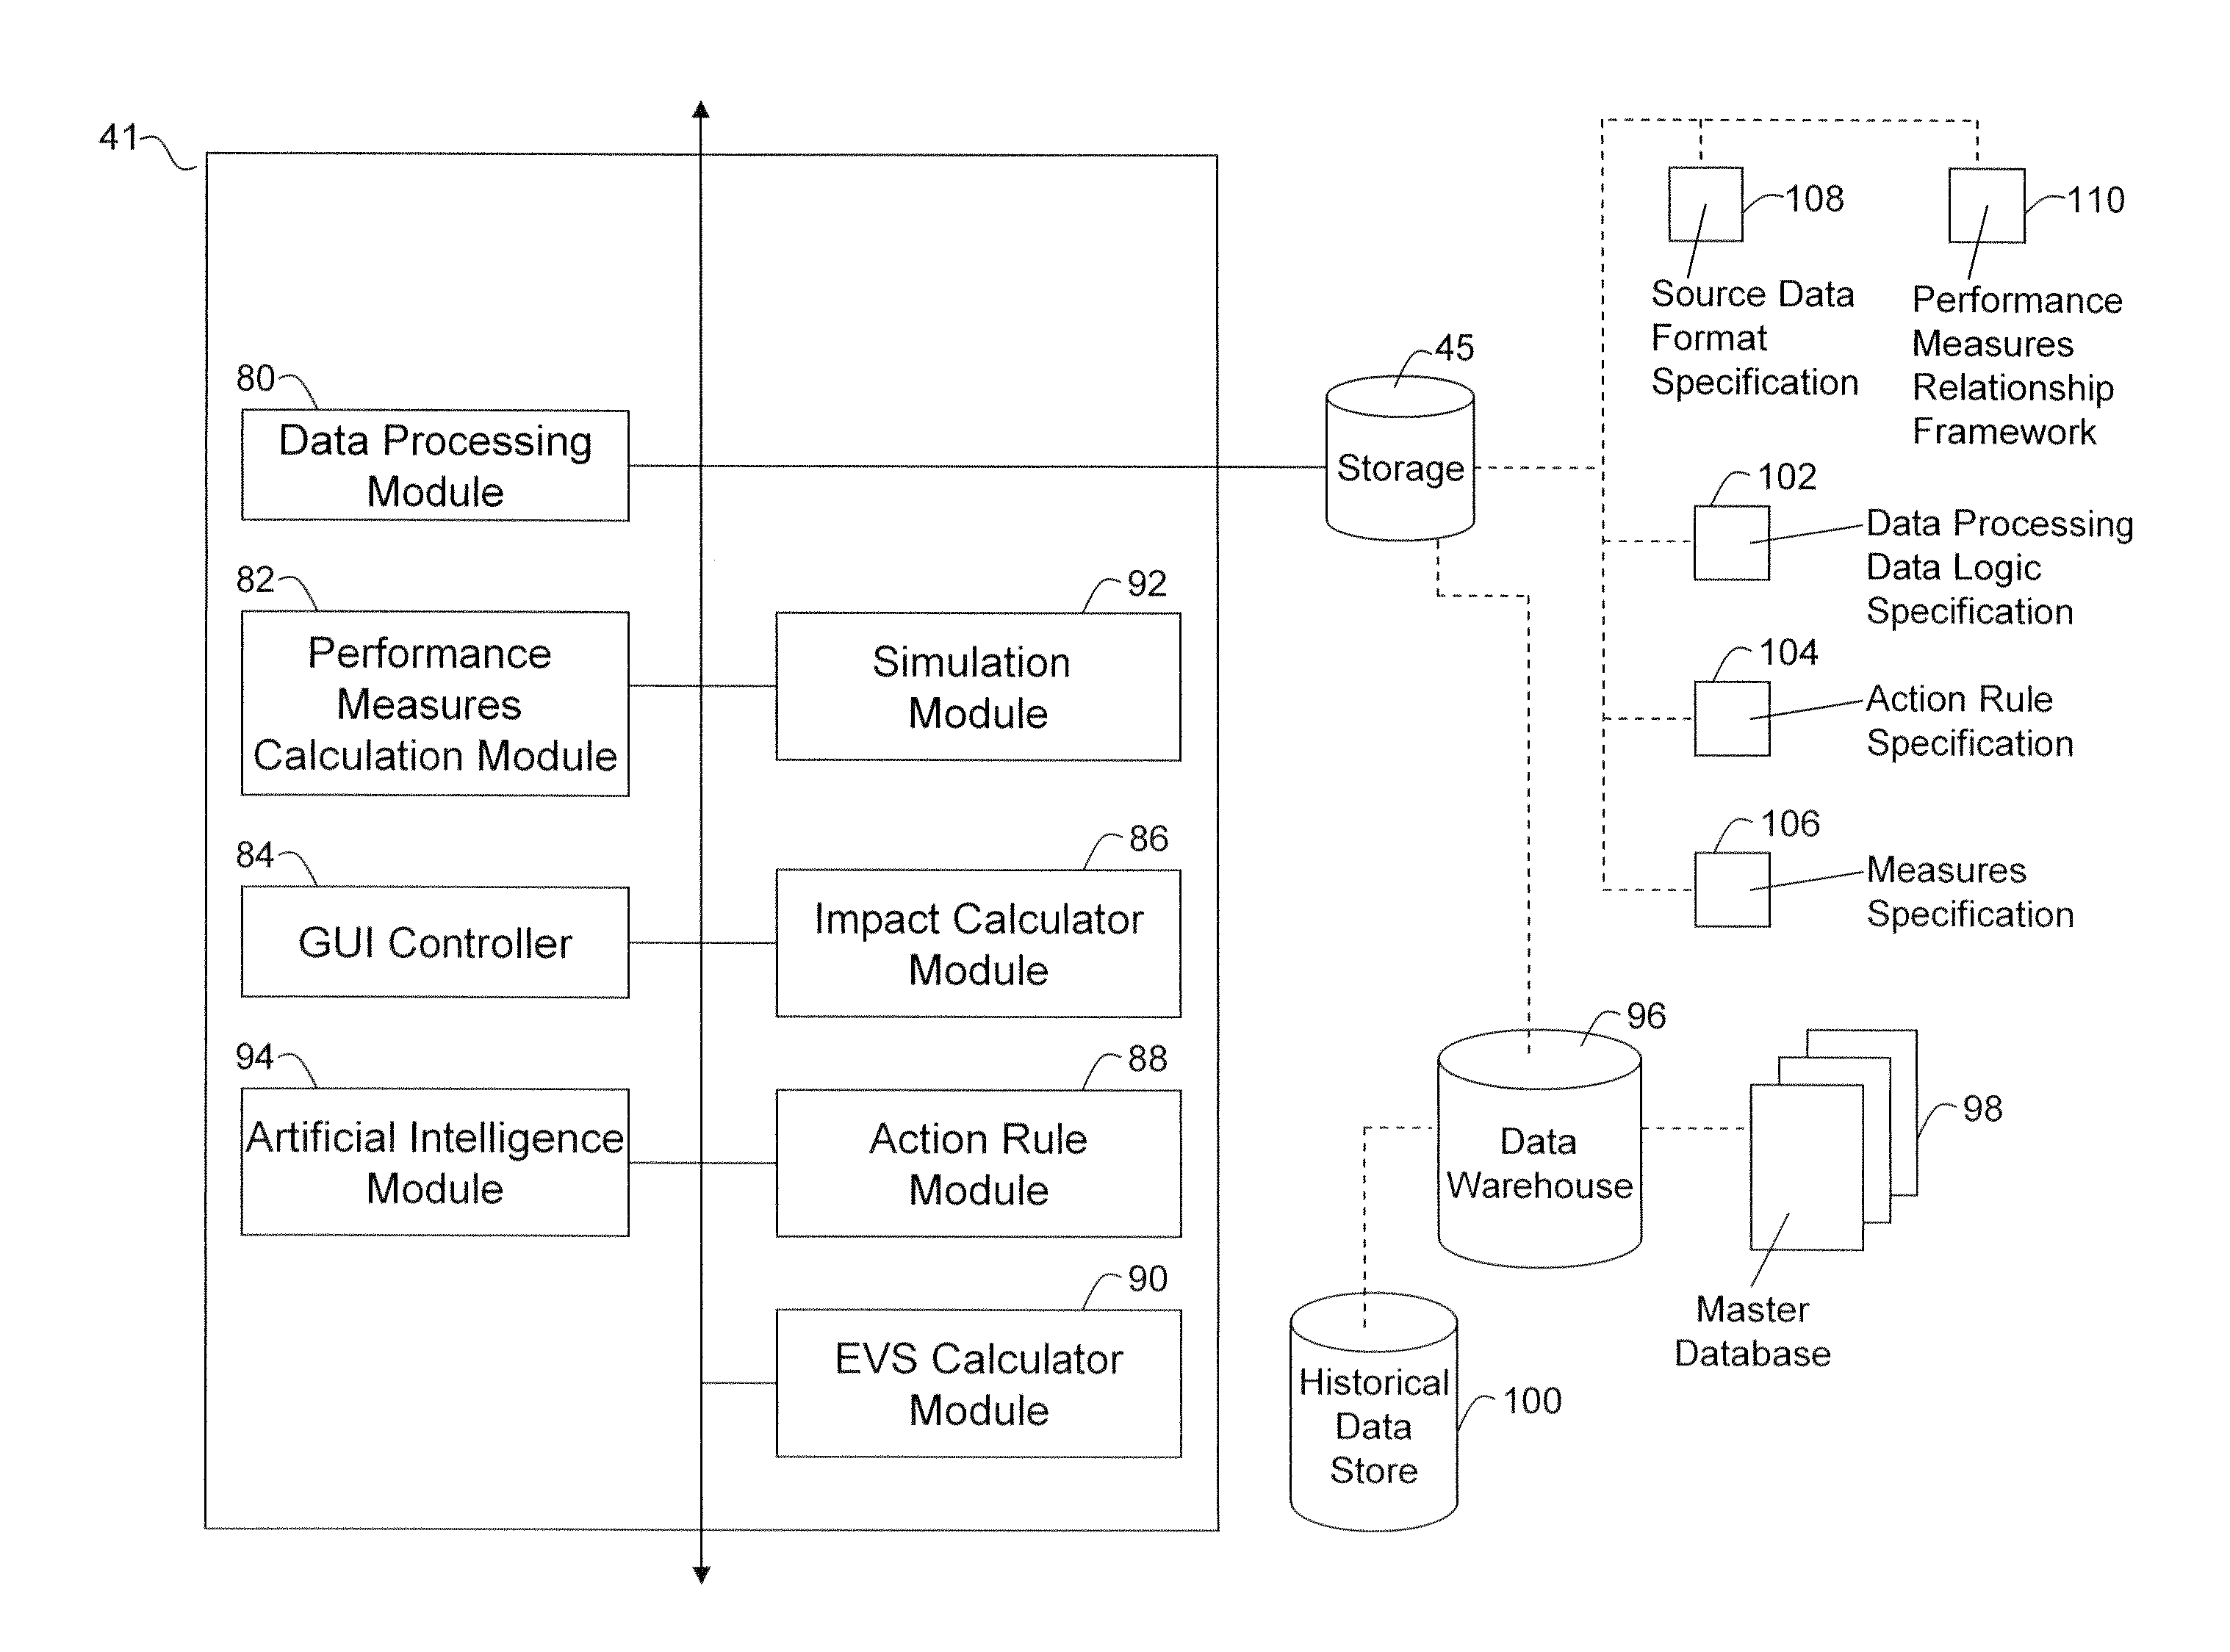
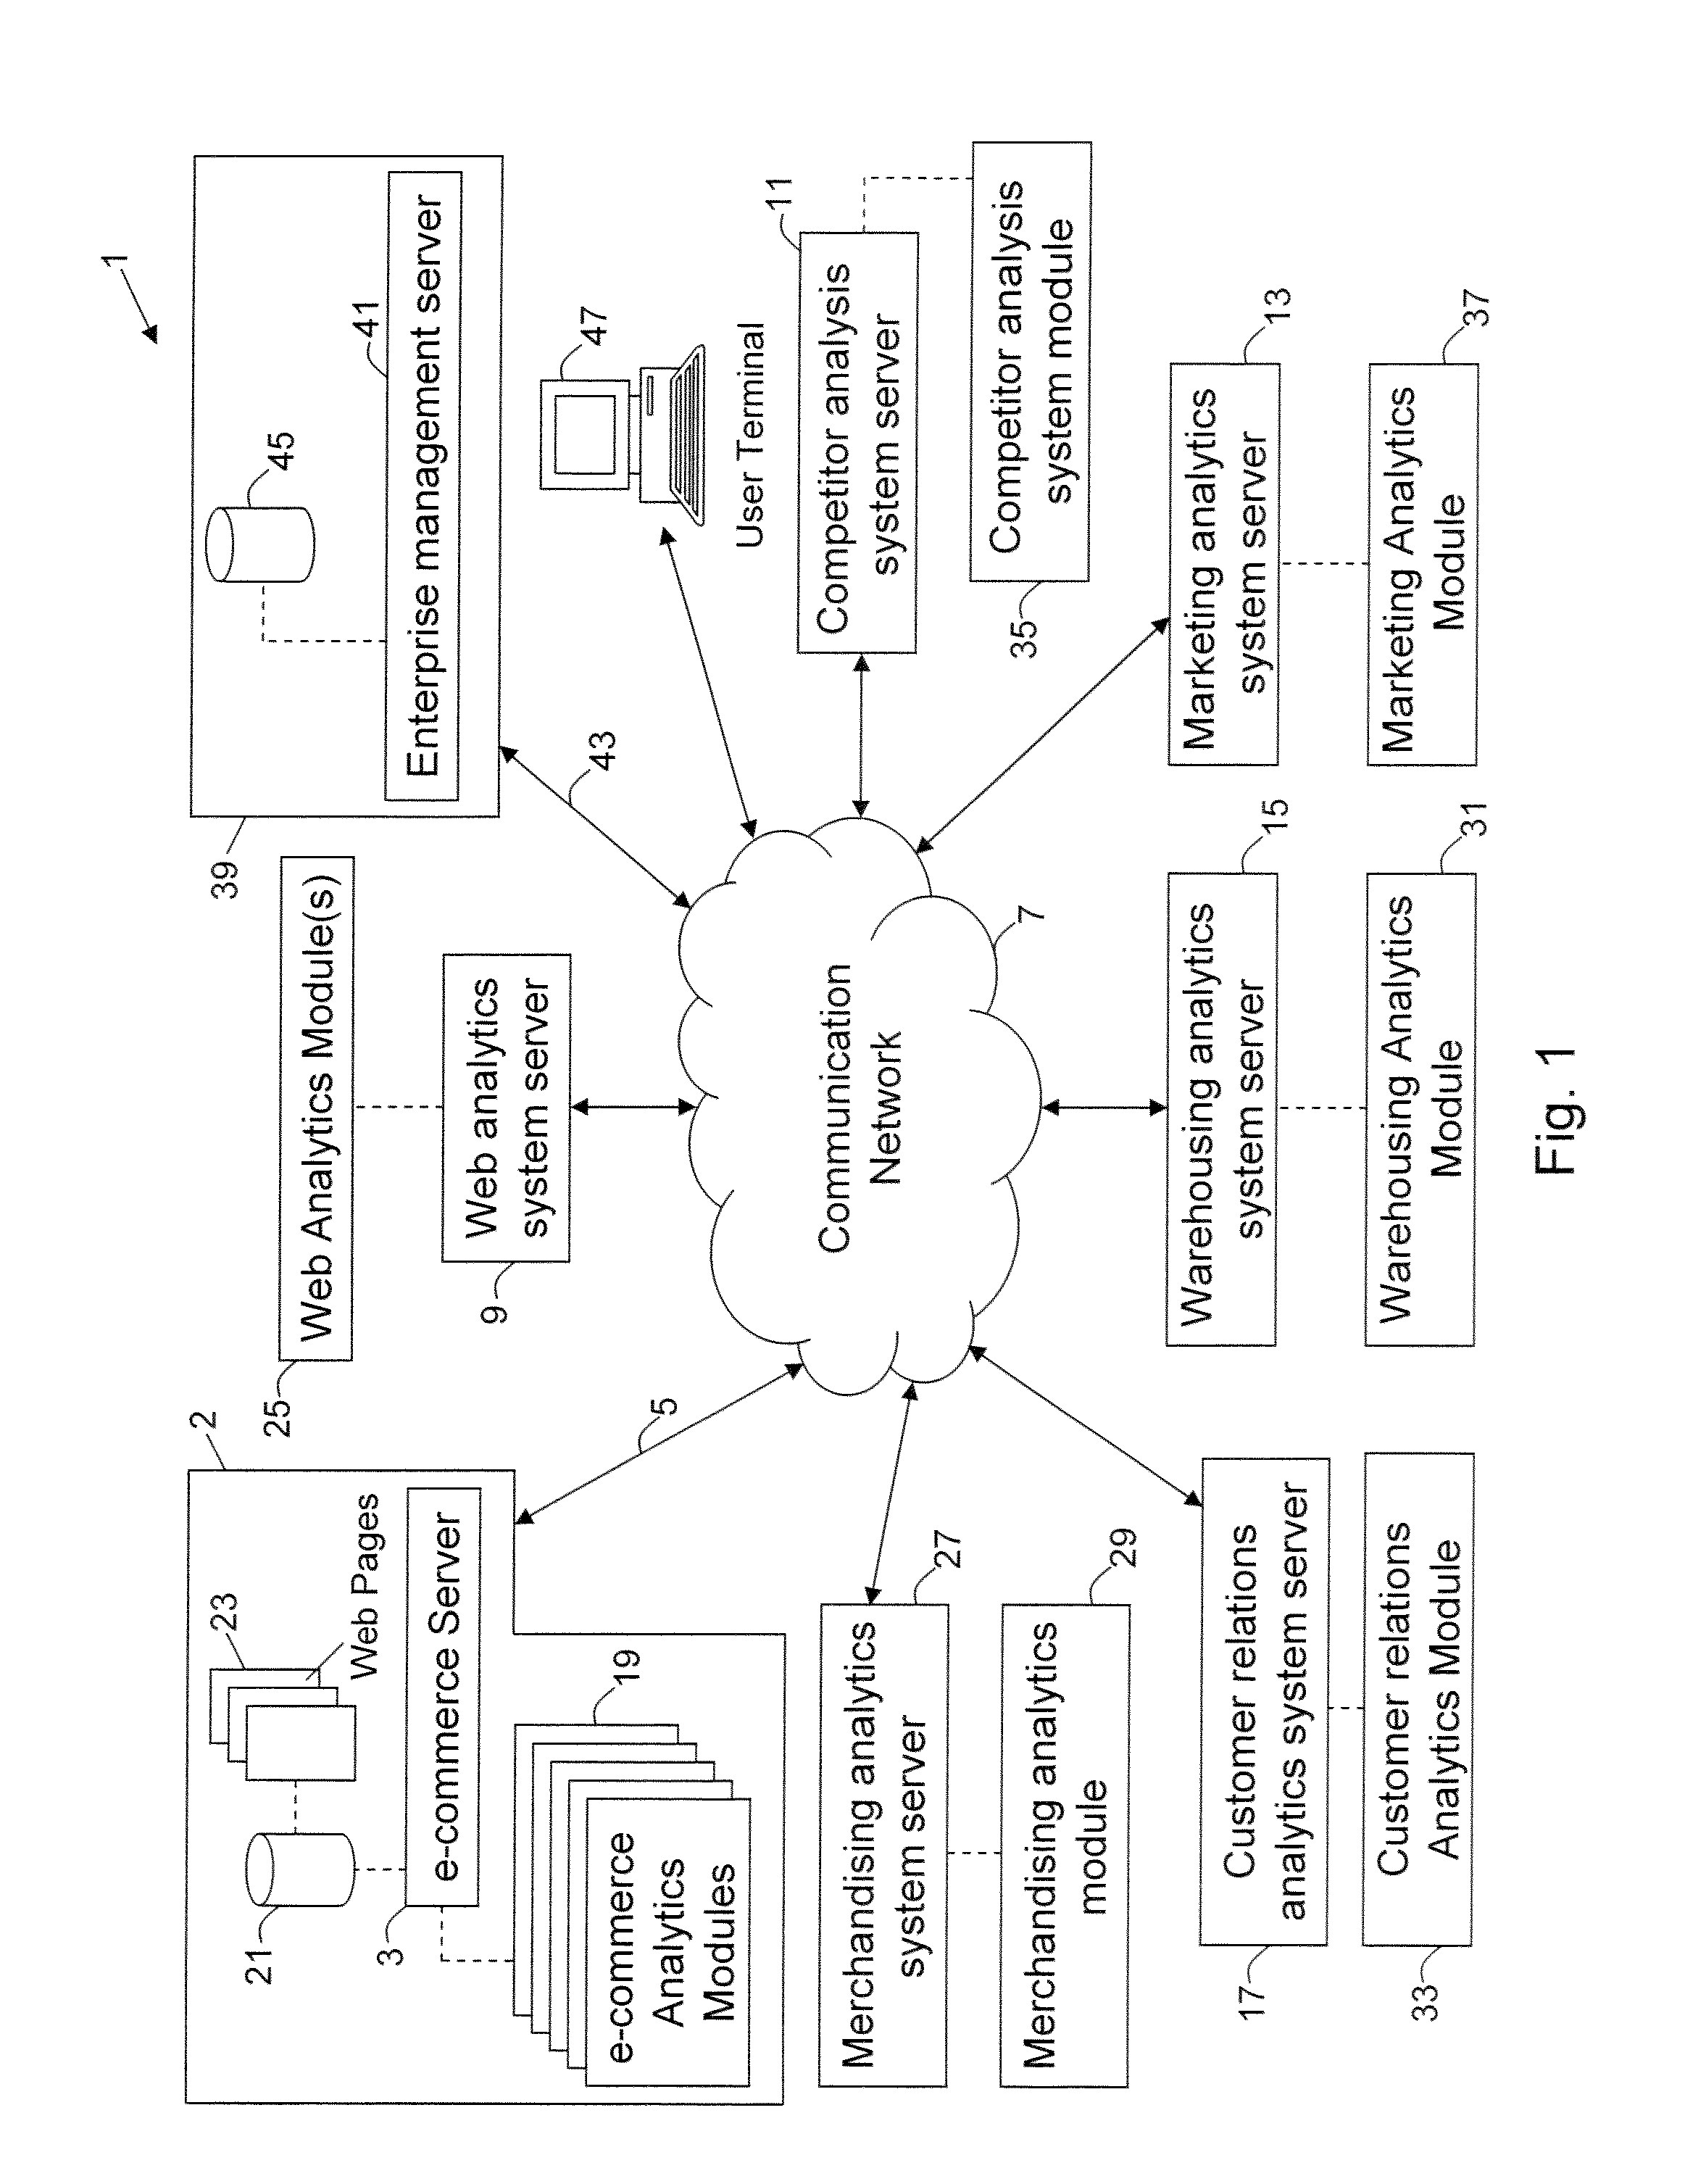
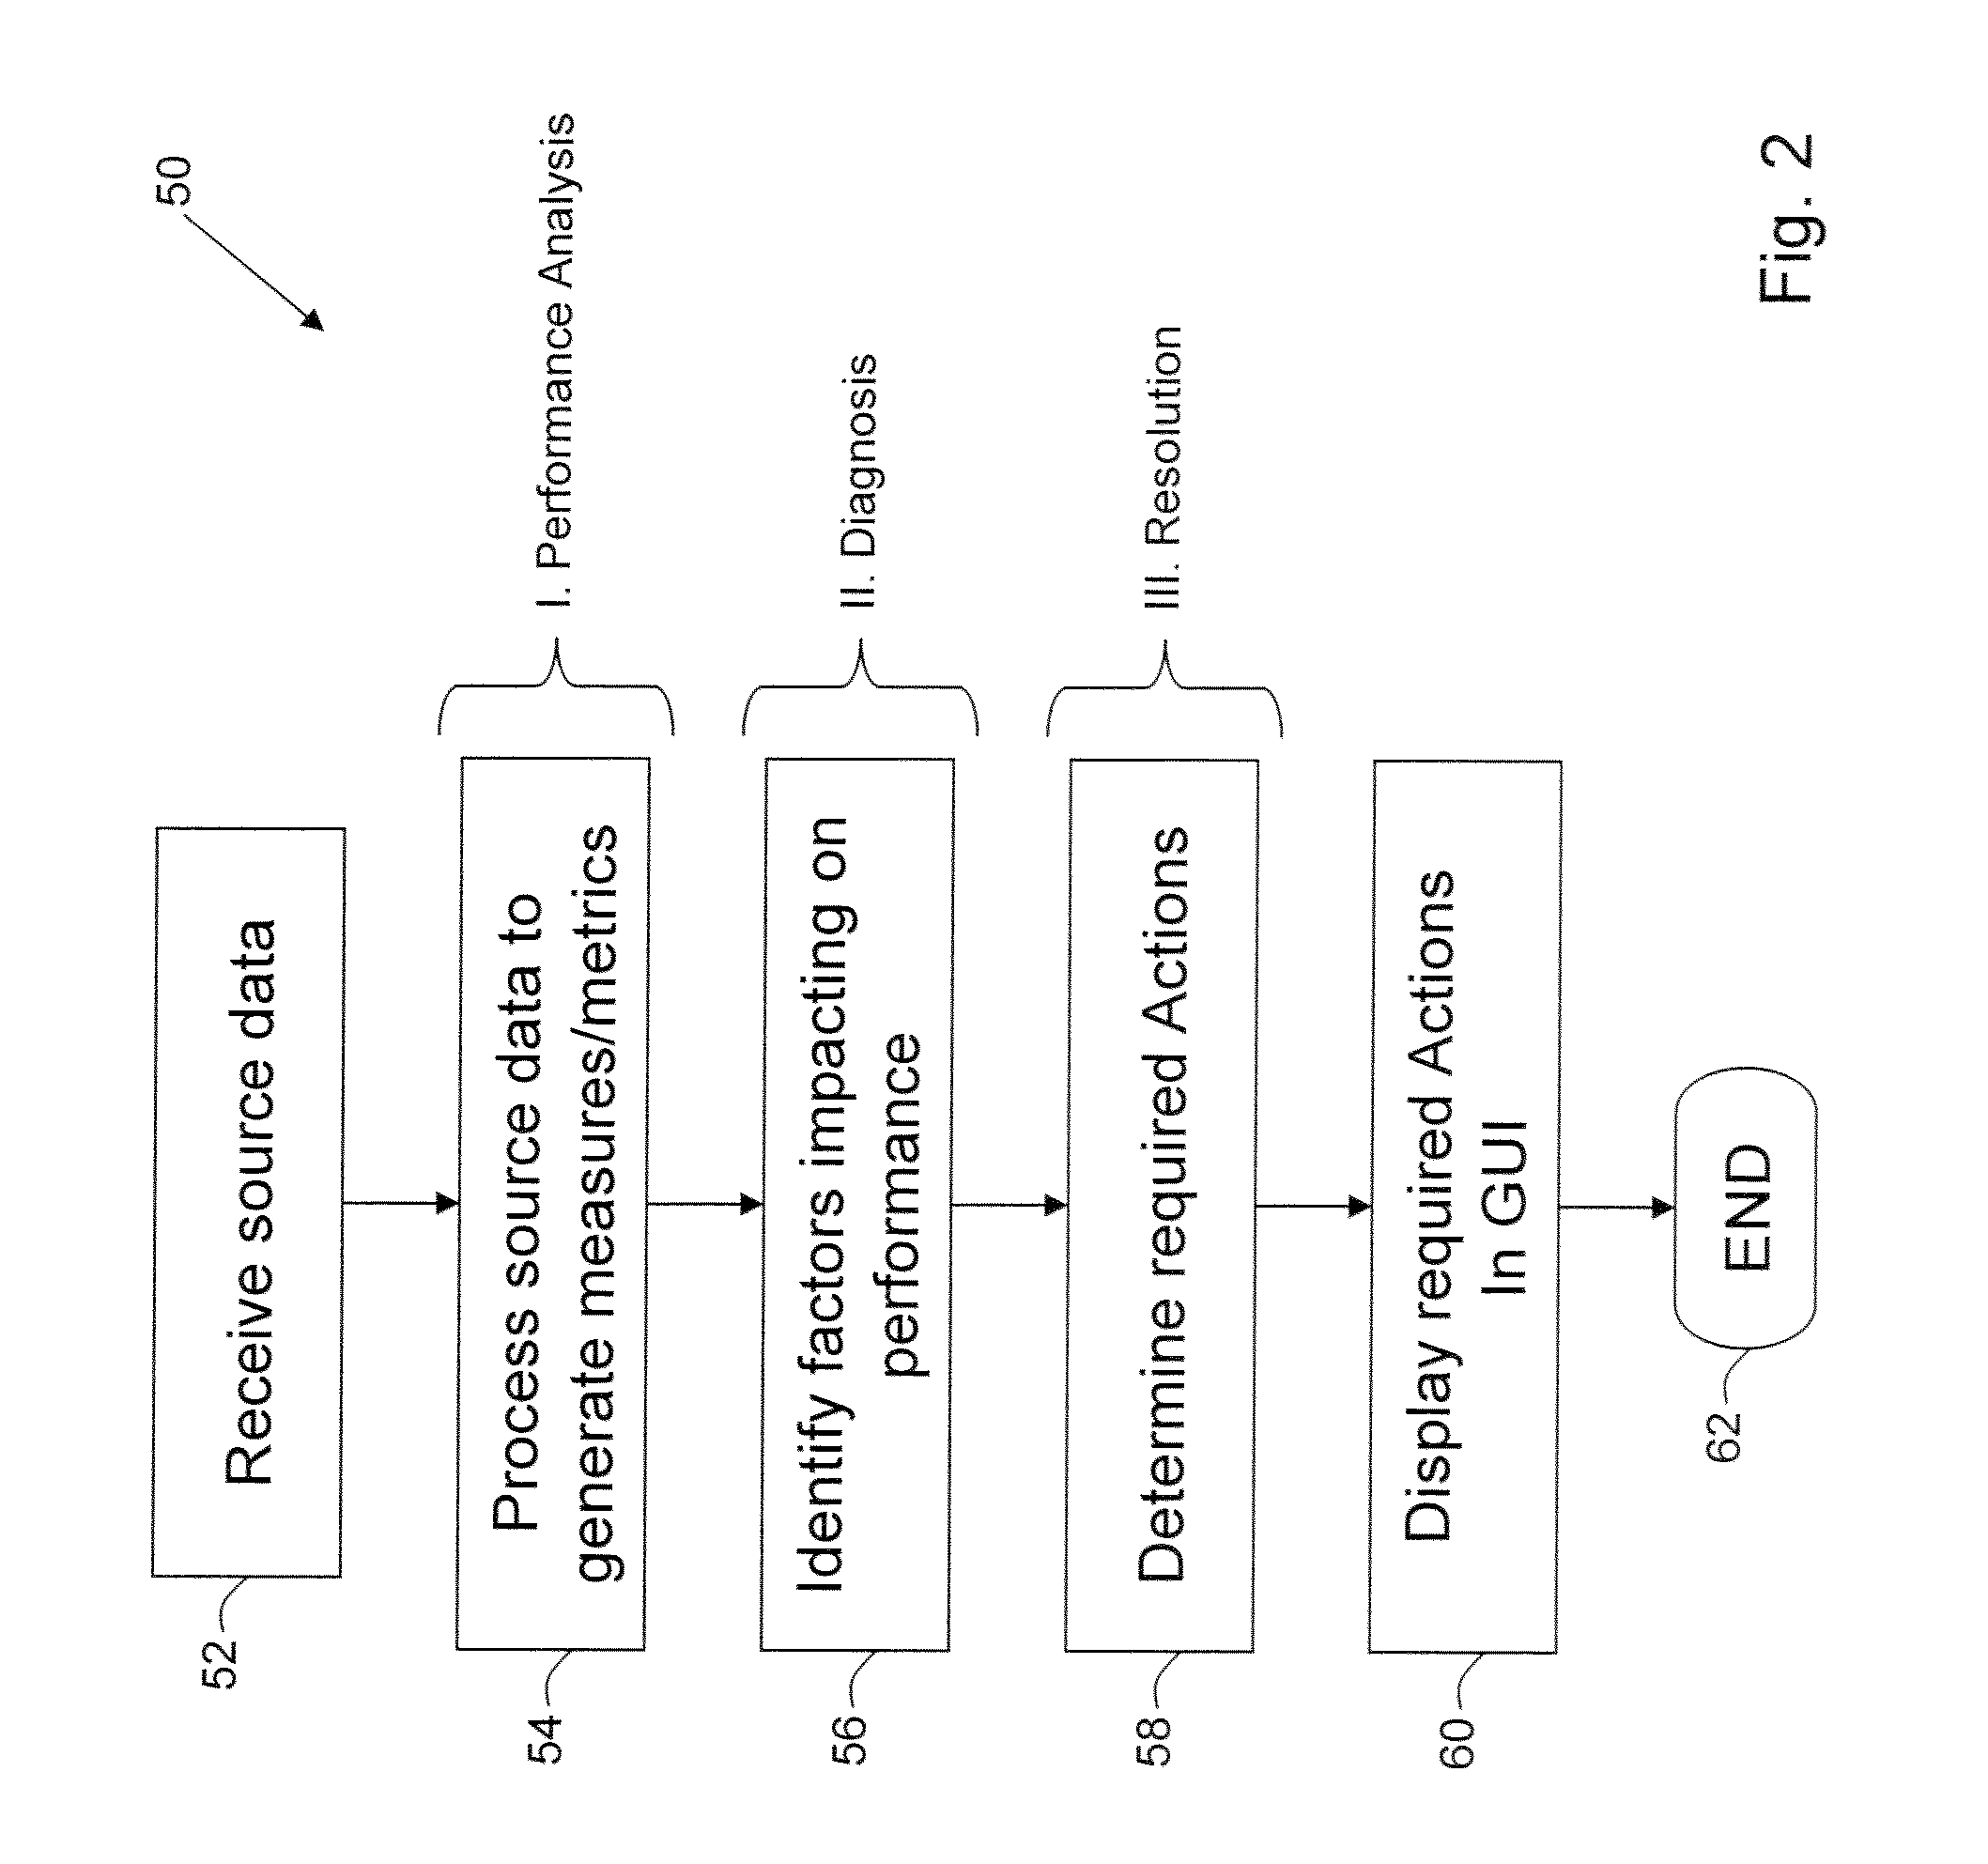
[0123]In practice a user may interact with the present enterprise management system 39 via user terminal 47. It is assumed that the e-commerce enterprise 2 has transmitted data generated by either internal analytics modules 19, or any one of the plurality of third party analytics systems 11, 13, 15, 17, 25, 27 to the enterprise management server 41, and the received data has been processed as described above, and populated into the master database 98 illustrated in FIG. 4. Upon establishing a data connection with the enterprise management system 39, the user may be presented with the Executive Dashboard screen 140 illustrated in FIG. 6a, which provides a holistic performance overview of the e-commerce enterprise 2, in region 146 of the dashboard 140. Equally, a selection of the sources having the greatest determined impact on the observed trading profit KPI variance, are presented in region 152 of the dashboard 140; and a selection of the action lists determined as likely to have the greatest impact on improving the observed performance variance are displayed in region 164.
[0124]The user is immediately able to see, without having to exercise any expertise, the source having the most significant impact on the default trading profit KPI, in addition to a selection of proposed Action Lists estimated as having the biggest impact on the trading profit KPI if implemented.
[0125]The user may then select any one of tabs 153 to access the dashboards associated with specific business areas of the e-commerce enterprise. For example. FIG. 6h illustrates the Marketing Dashboard.
[0126]In each dashboard the user may also investigate the sources contributing to any one selected performance measure related to the selected business area. For example, the user may select any performance measure displayed in region 146 in the Executive Dashboard screen 140. For example, when the trading profit KPI 156 is selected, the user may be presented with the Impact Analyser screen 190 of FIG. 8, or alternatively any one of the screens associated with tabs 198. For example, the trading profit tree tab 200, when selected presents the performance measure hierarchical relationship framework illustrated in FIG. 3, graphically displaying the relationship between the different performance measures. The input measures tab 202, when selected, presents a screen listing the set of source data associated with the selected performance measure (which in the present example is the trading profit KPI). The impact analyser screen illustrated in FIG. 8 provides a complete list of all the data sources, and their associated impact values, affecting the selected performance measure. Similarly, selecting the action lists tab 204, presents a screen listing all the action lists associated with the observed performance measure variance. Furthermore, filters may be applied to any selected screen to filter the graphically presented information. For example, within the impact analyser screen 190, the user may wish to see data sources associated with a specific data type and/or category (i.e. data sources associated with a specific enterprise business area), or sub-type/category.

PUM

no PUM

Description & Claims & Application Information

We can also present the details of the Description, Claims and Application information to help users get a comprehensive understanding of the technical details of the patent, such as background art, summary of invention, brief description of drawings, description of embodiments, and other original content. On the other hand, users can also determine the specific scope of protection of the technology through the list of claims; as well as understand the changes in the life cycle of the technology with the presentation of the patent timeline. Login to view more.

Similar technology patents

Detection of nuclear materials

InactiveUS20060284094A1Improve performanceLower costMaterial analysis by optical meansMachines/enginesSpecial nuclear materialRadioactive source
Owner:INBAR DAN

Vertical adaptive antenna array for a discrete multitone spread spectrum communications system

InactiveUS20050002440A1Improve performanceImprove signal-to-interference levelPolarisation/directional diversityMultiplex code allocationSpatially adaptiveSelf adaptive
Owner:AT&T MOBILITY II LLC

Classification and recommendation of technical efficacy words

Why Eureka
Try Eureka