Density trace measurement and triggering in frequency domain bitmaps

Active Publication Date: 2011-11-17
TEKTRONIX INC
View PDF5 Cites 8 Cited by
  • Summary
  • Abstract
  • Description
  • Claims
  • Application Information

AI Technical Summary

Benefits of technology

[0011]What is needed is a way of conveniently defining and representing the occupancy for a large number of columns. What is also needed is a way to quickly transmit density data from one instrument or computer to another using commonly-available transmission methods.
[0012]Accordingly, a “density trace” according to an embodiment of the present invention is formed by measuring the density of each column of a frequency domain bitmap above a user-specified “amplitude threshold.” The density of each column equals the sum of the densities of all of the pixels in the column that are above the amplitude threshold divided by

Problems solved by technology

The conventional density measurement described above is useful for quantifying signal occupancy in a limited number of areas of the amplitude versus frequency space, however is not convenient if a user desires to make an occupancy measurement for every column of a bitmap.
Another deficiency of the

Method used


Image

  • Density trace measurement and triggering in frequency domain bitmaps
  • Density trace measurement and triggering in frequency domain bitmaps
  • Density trace measurement and triggering in frequency domain bitmaps

Examples


Embodiment Construction

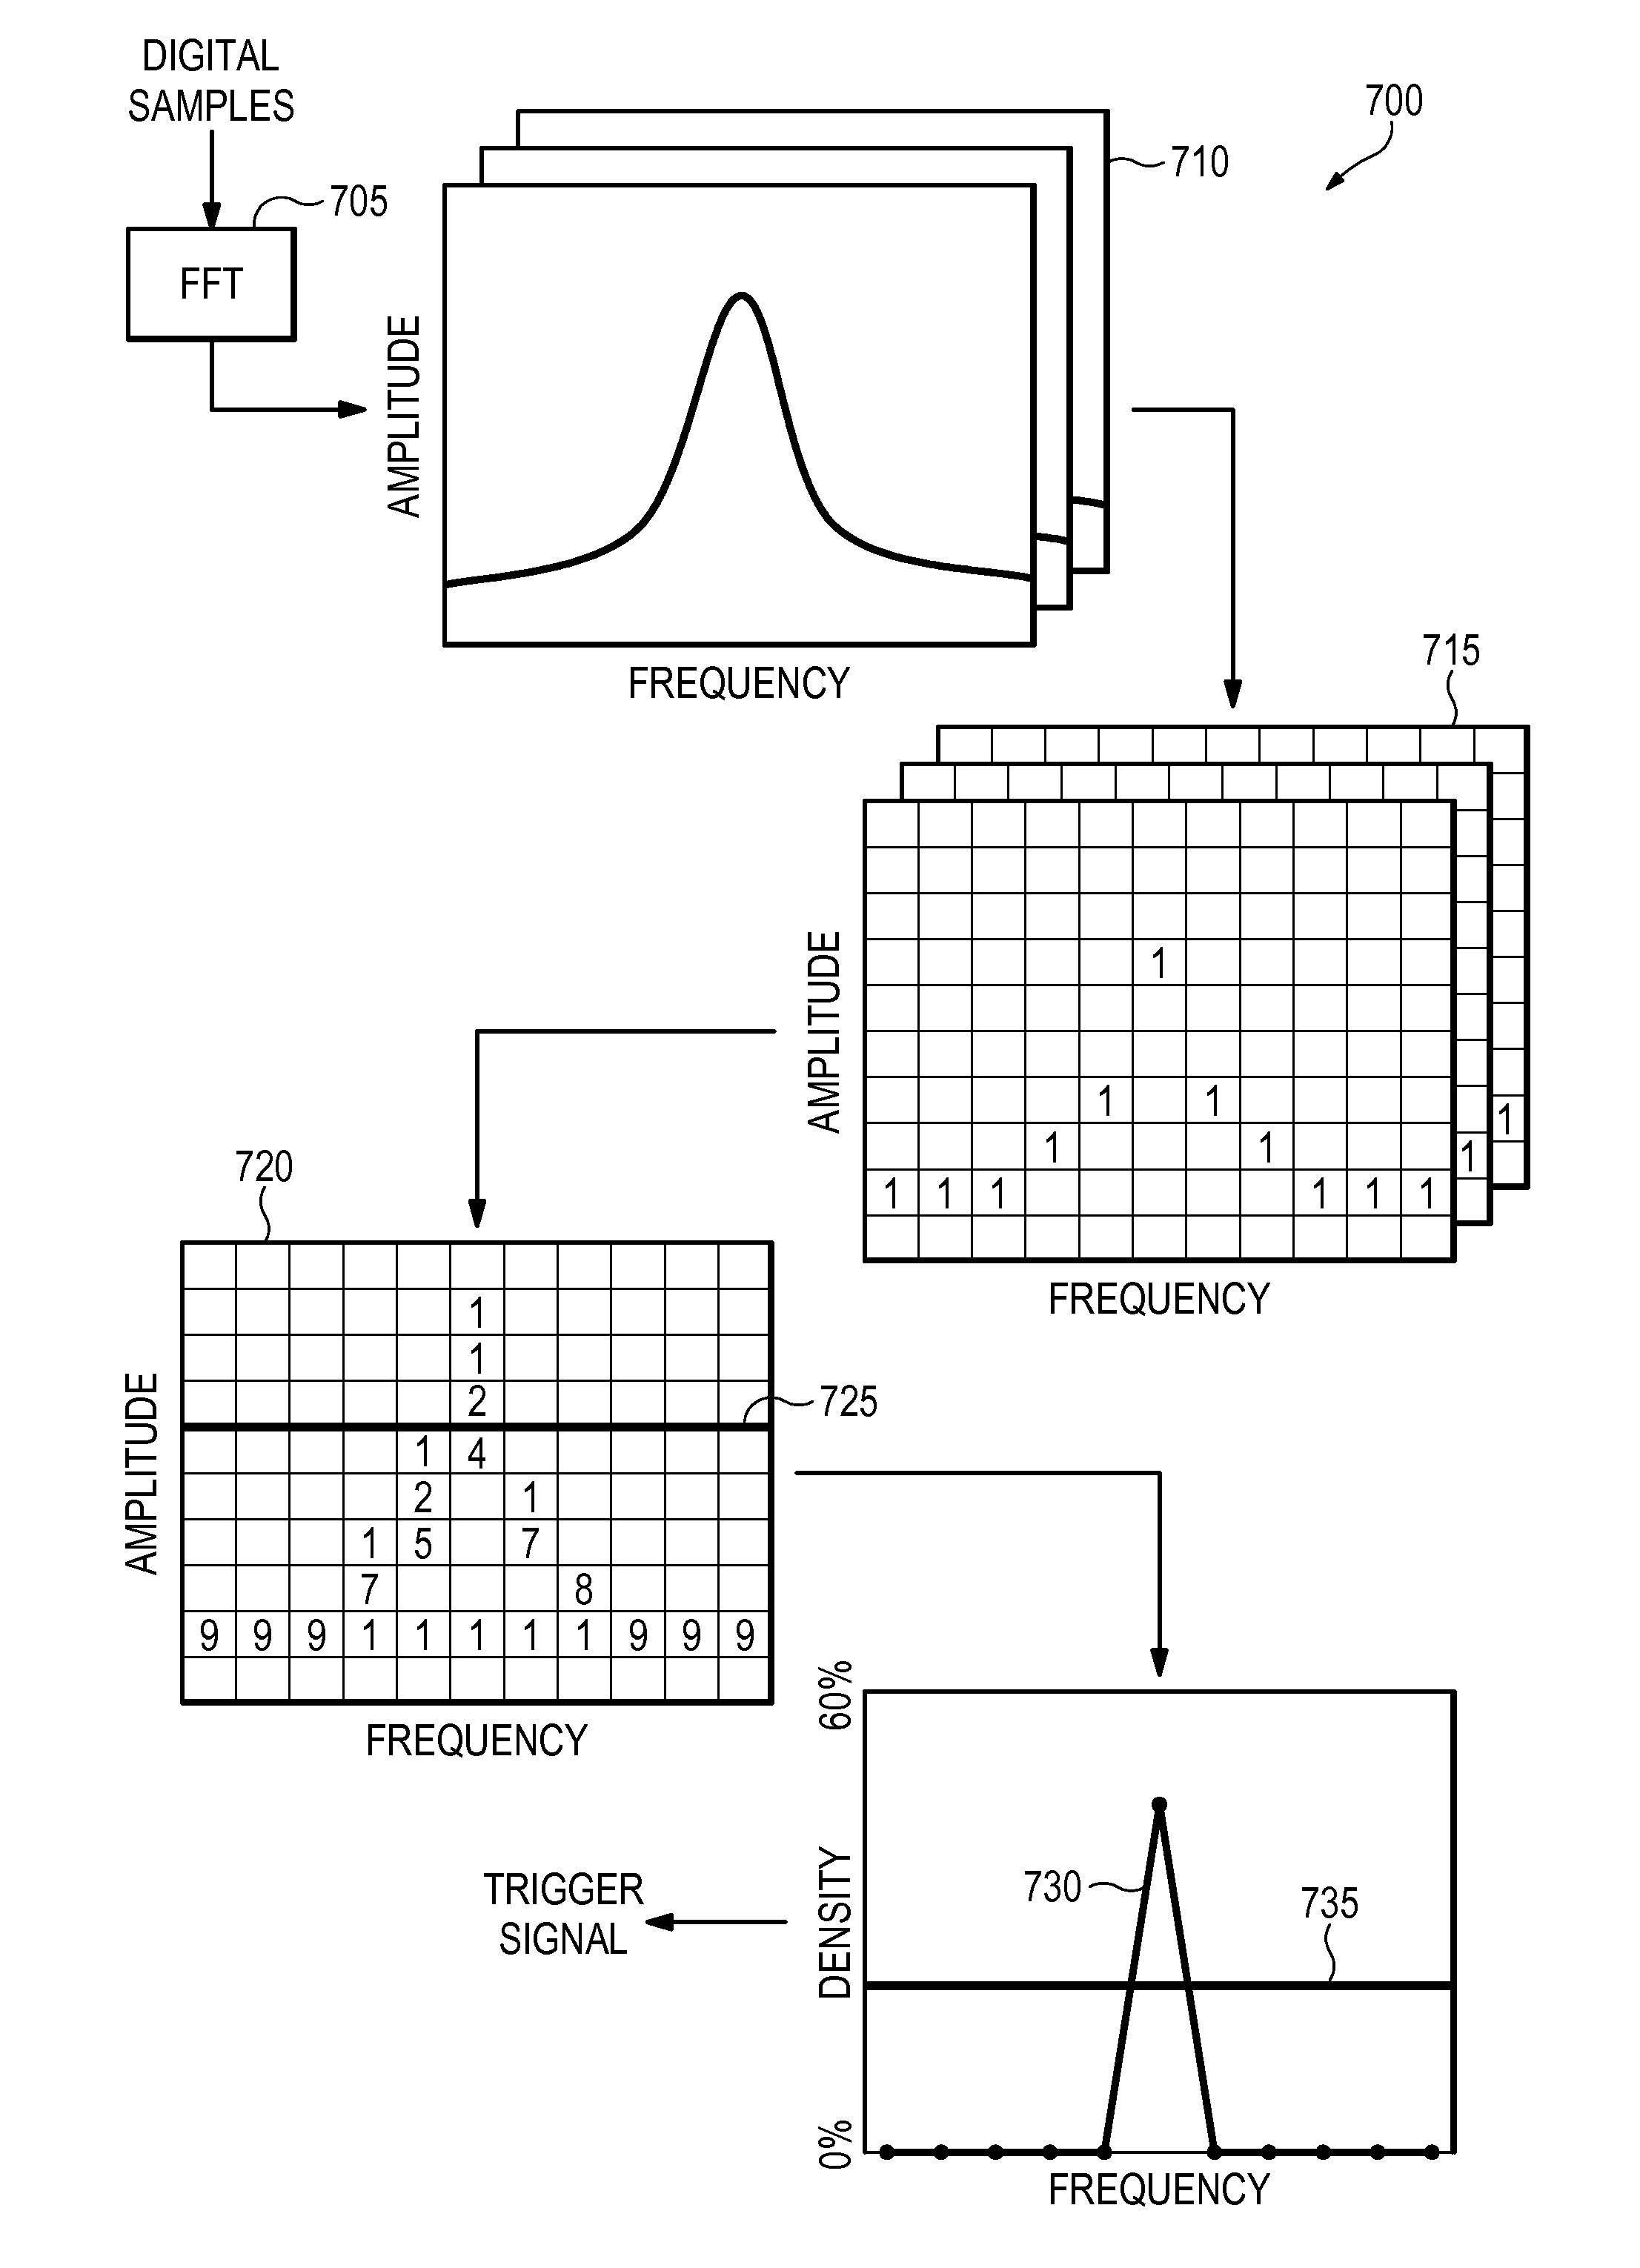
[0023]Referring now to FIG. 4, a “density trace” according to an embodiment of the present invention is formed by measuring the density of each column of a bitmap 400 above a user-specified “amplitude threshold”420. The density of each column equals the sum of the densities of all of the pixels in the column that are above the amplitude threshold divided by the sum of the densities of all of the pixels in the column:

Density of a column=Sum of densities of all pixels in column above amplitude thresholdSum of densities of all pixels in column

[0024]For example, if a particular column of the bitmap 400 has 100 pixels, 90 of which are above the amplitude threshold 420, and the density of each pixel in the column is 1%, then the density of the column equals (90×1%) / (100×1%)=90%.

[0025]Since density equals the total number of hits divided by the total number of spectra, the density of a column above an amplitude threshold may be equivalently defined as the number of hits contained within al...


PUM


Abstract

A “density trace” according to an embodiment of the present invention is formed by measuring the density of each column of a frequency domain bitmap above a user-specified “amplitude threshold.” The density of each column equals the sum of the densities of all of the pixels in the column that are above the amplitude threshold divided by the sum of the densities of all of the pixels in the column. A density trace provides a convenient way to define and represent the occupancy for a large number of columns, and also allows density data to be quickly transmitted from one instrument or computer to another. In some embodiments, a density trace is incorporated into a trigger detector of a test and measurement instrument and used to generate a trigger signal. The trigger detector compares the density trace to a user-specified “density threshold” and generates the trigger signal when the value of any point of the density trace violates the density threshold.

Description

FIELD OF THE INVENTION[0001]The present invention relates to test and measurement instruments, and more particularly to density measurements for frequency domain bitmaps.BACKGROUND OF THE INVENTION[0002]Real-time spectrum analyzers such as the RSA6100 and RSA3400 families available from Tektronix, Inc. of Beaverton, Oreg. trigger on, capture, and analyze RF signals in real-time. These instruments seamlessly capture RF signals so that, unlike conventional swept spectrum analyzers and vector signal analyzers, no data is missed within a specified bandwidth.[0003]Referring now to FIG. 1, a real-time spectrum analyzer 100 receives a radio frequency (RF) input signal and optionally down-converts it using a mixer 105, local oscillator (LO) 110, and filter 115 to produce an intermediate frequency (IF) signal. An analog-to-digital converter (ADC) 120 digitizes the IF signal to produce a continuous stream of digital samples. The digital samples are input to a circular buffer 125 and also inpu...

Claims


Application Information

Patent Timeline
IPC IPC(8): G06F19/00G01R13/02
CPCG01R23/18G01R13/0254
Inventor ENGHOLM, KATHRYN A.HILLMAN, JR., ALFRED K.TURPIN, JOHN F.EBY, DAVID H.
Owner TEKTRONIX INC
Why Eureka
Try Eureka