
Pluggable Web-Based Visualizations for Applications

a web-based visualization and pluggable technology, applied in the field of pluggable web-based visualization for applications, can solve the problems of not being able to accommodate dynamic visualizations in desktop applications, visualizations cannot be rendered, and errors in the pluggable web-based visualization technique's code (accidental or malicious) cannot harm the application process

Active Publication Date: 2011-12-01
MICROSOFT TECH LICENSING LLC
View PDF6 Cites 23 Cited by
  • Summary
  • Abstract
  • Description
  • Claims
  • Application Information

AI Technical Summary

Benefits of technology

[0004]This Summary is provided to introduce a selection of concepts in a simplified form that are further described below in the Detailed Description. This Summary is n

Problems solved by technology

However, these web-based tools display visualizations on web pages and do not have an ability to accommodate dynamic visualizations in desktop applications.
Additionally, these visualizations cannot be rendered when a user does not have an Internet connection.
For example, as to process isolation, errors in the pluggable web-based visualization technique's code (accidental or malicious) cannot harm the application process.
Those that require network access could potentially abuse the user's data by sending it to a server somewhere.
These will be presented as being more dangerous by the host application to users.
If a visualization requires, for example, a field of type “ordinal”, then mapping it to a string value may not be useful.
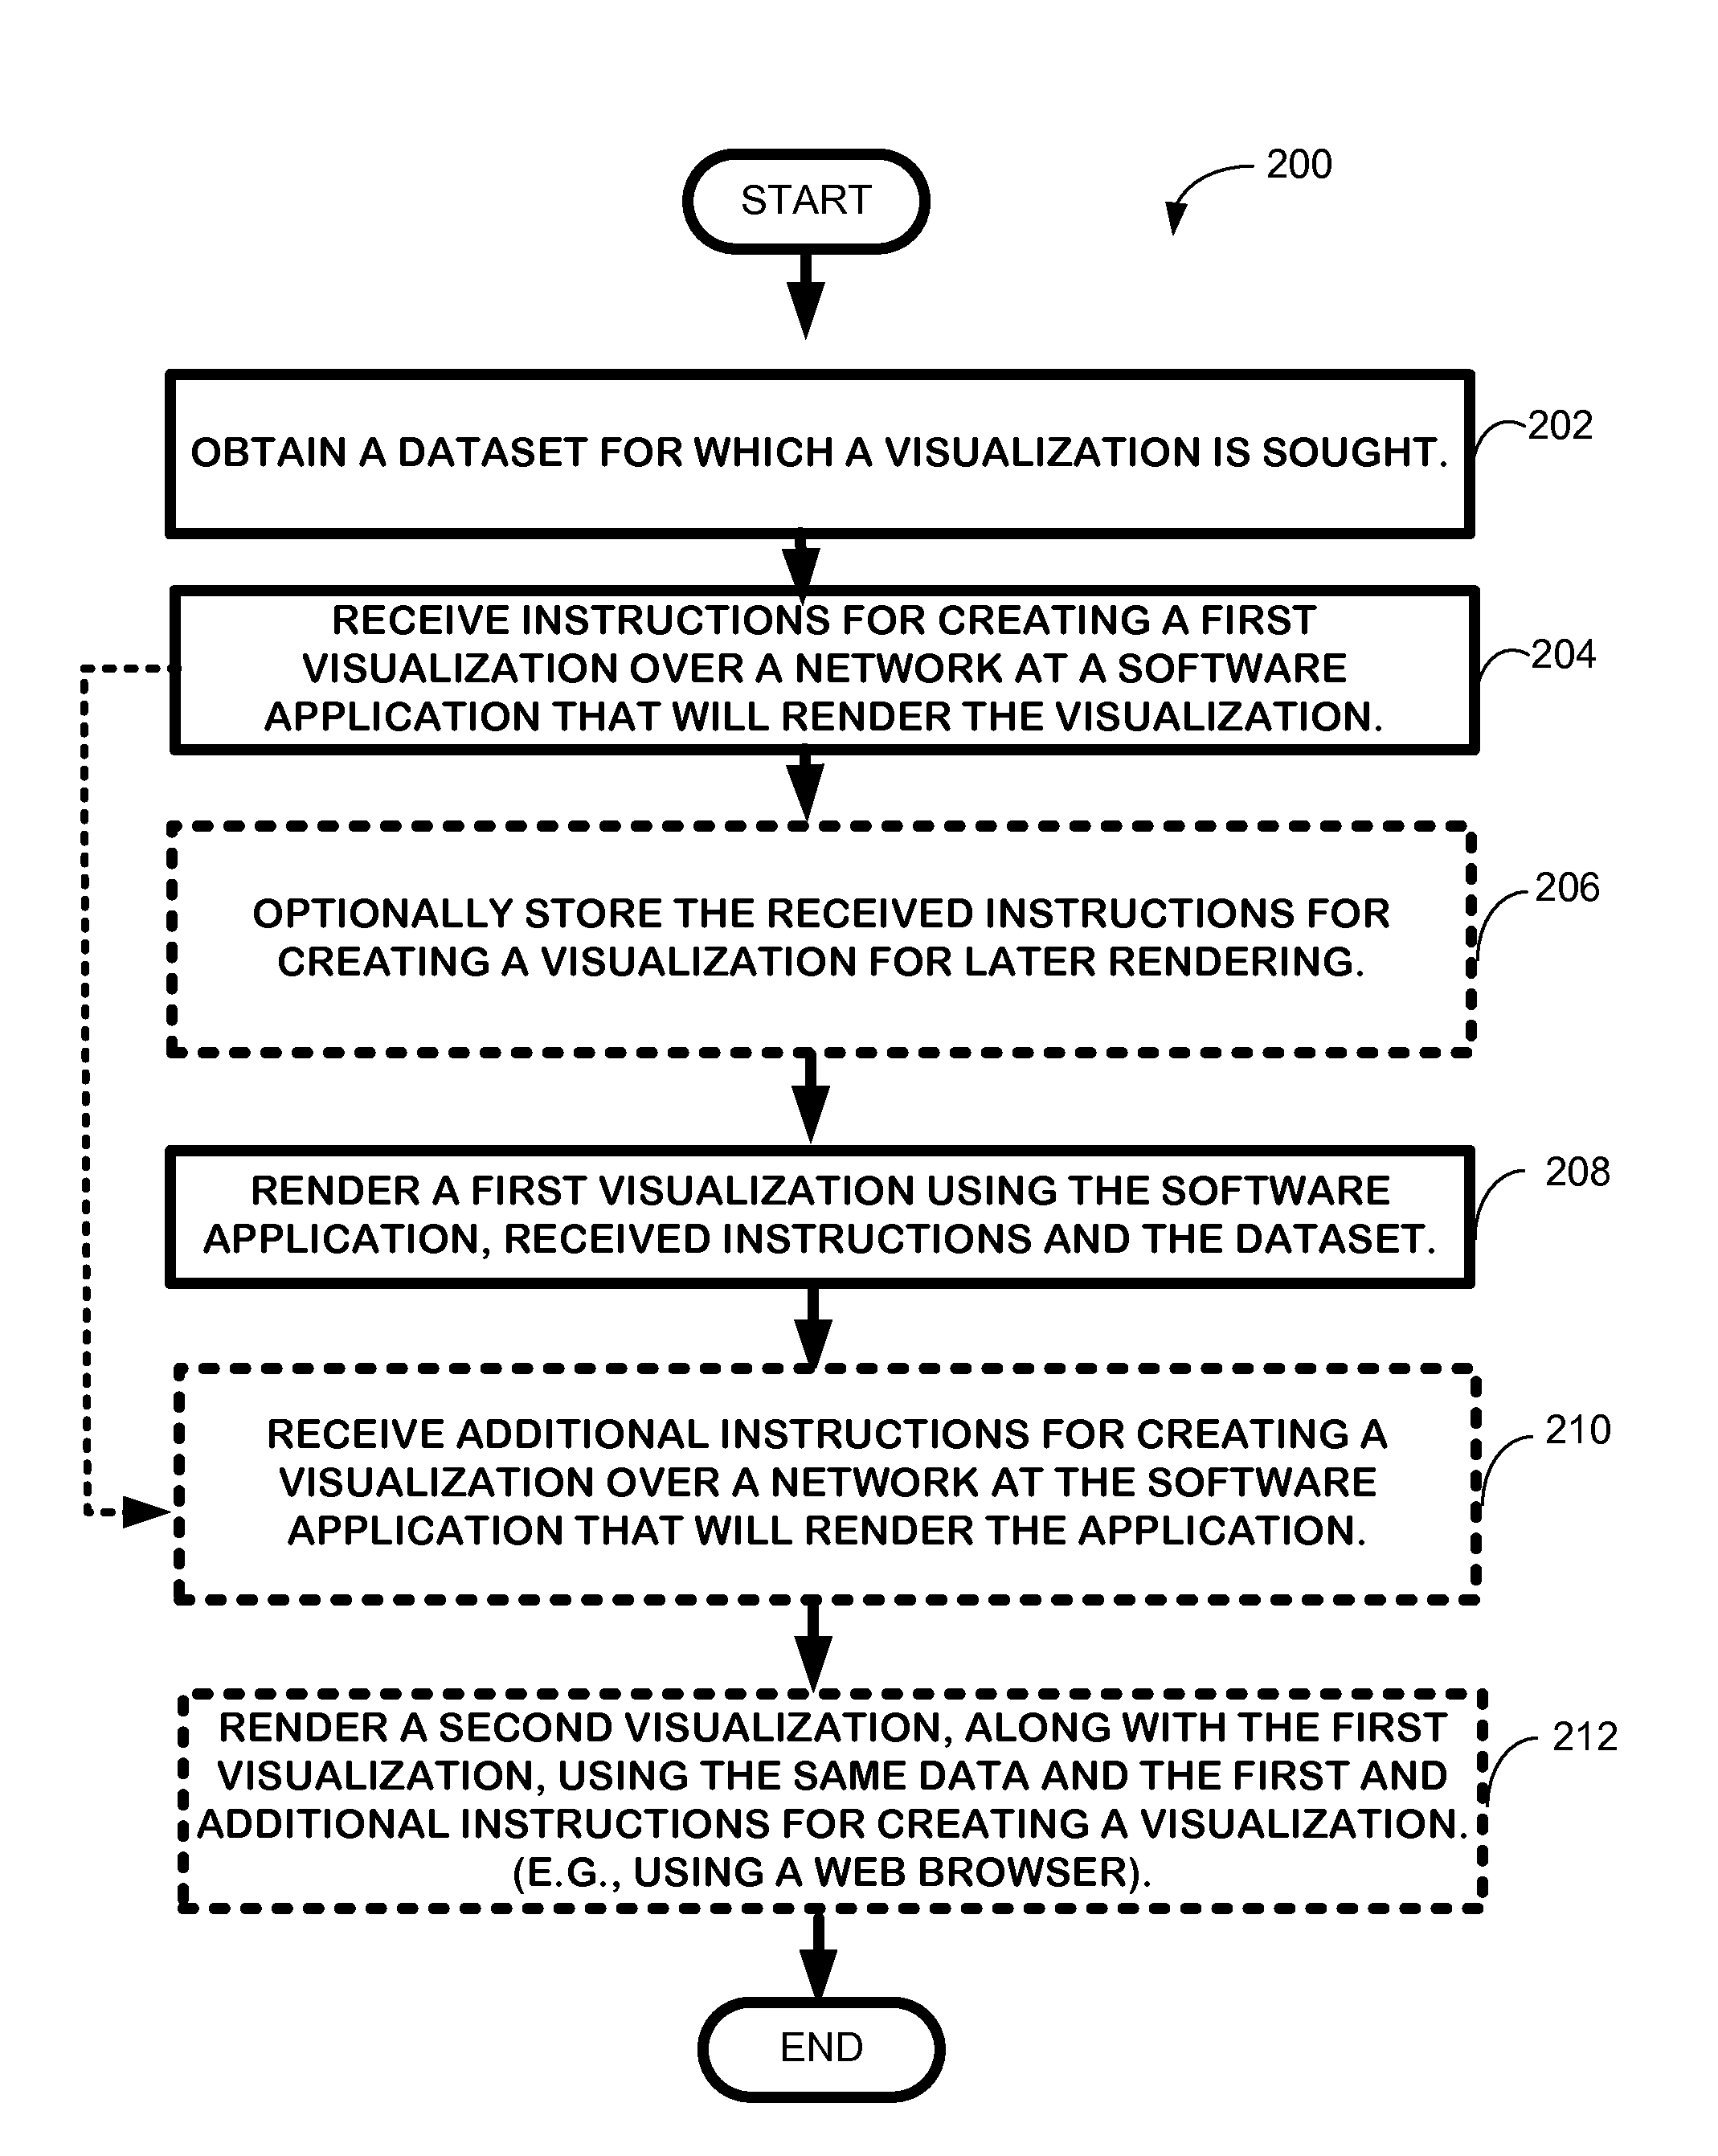
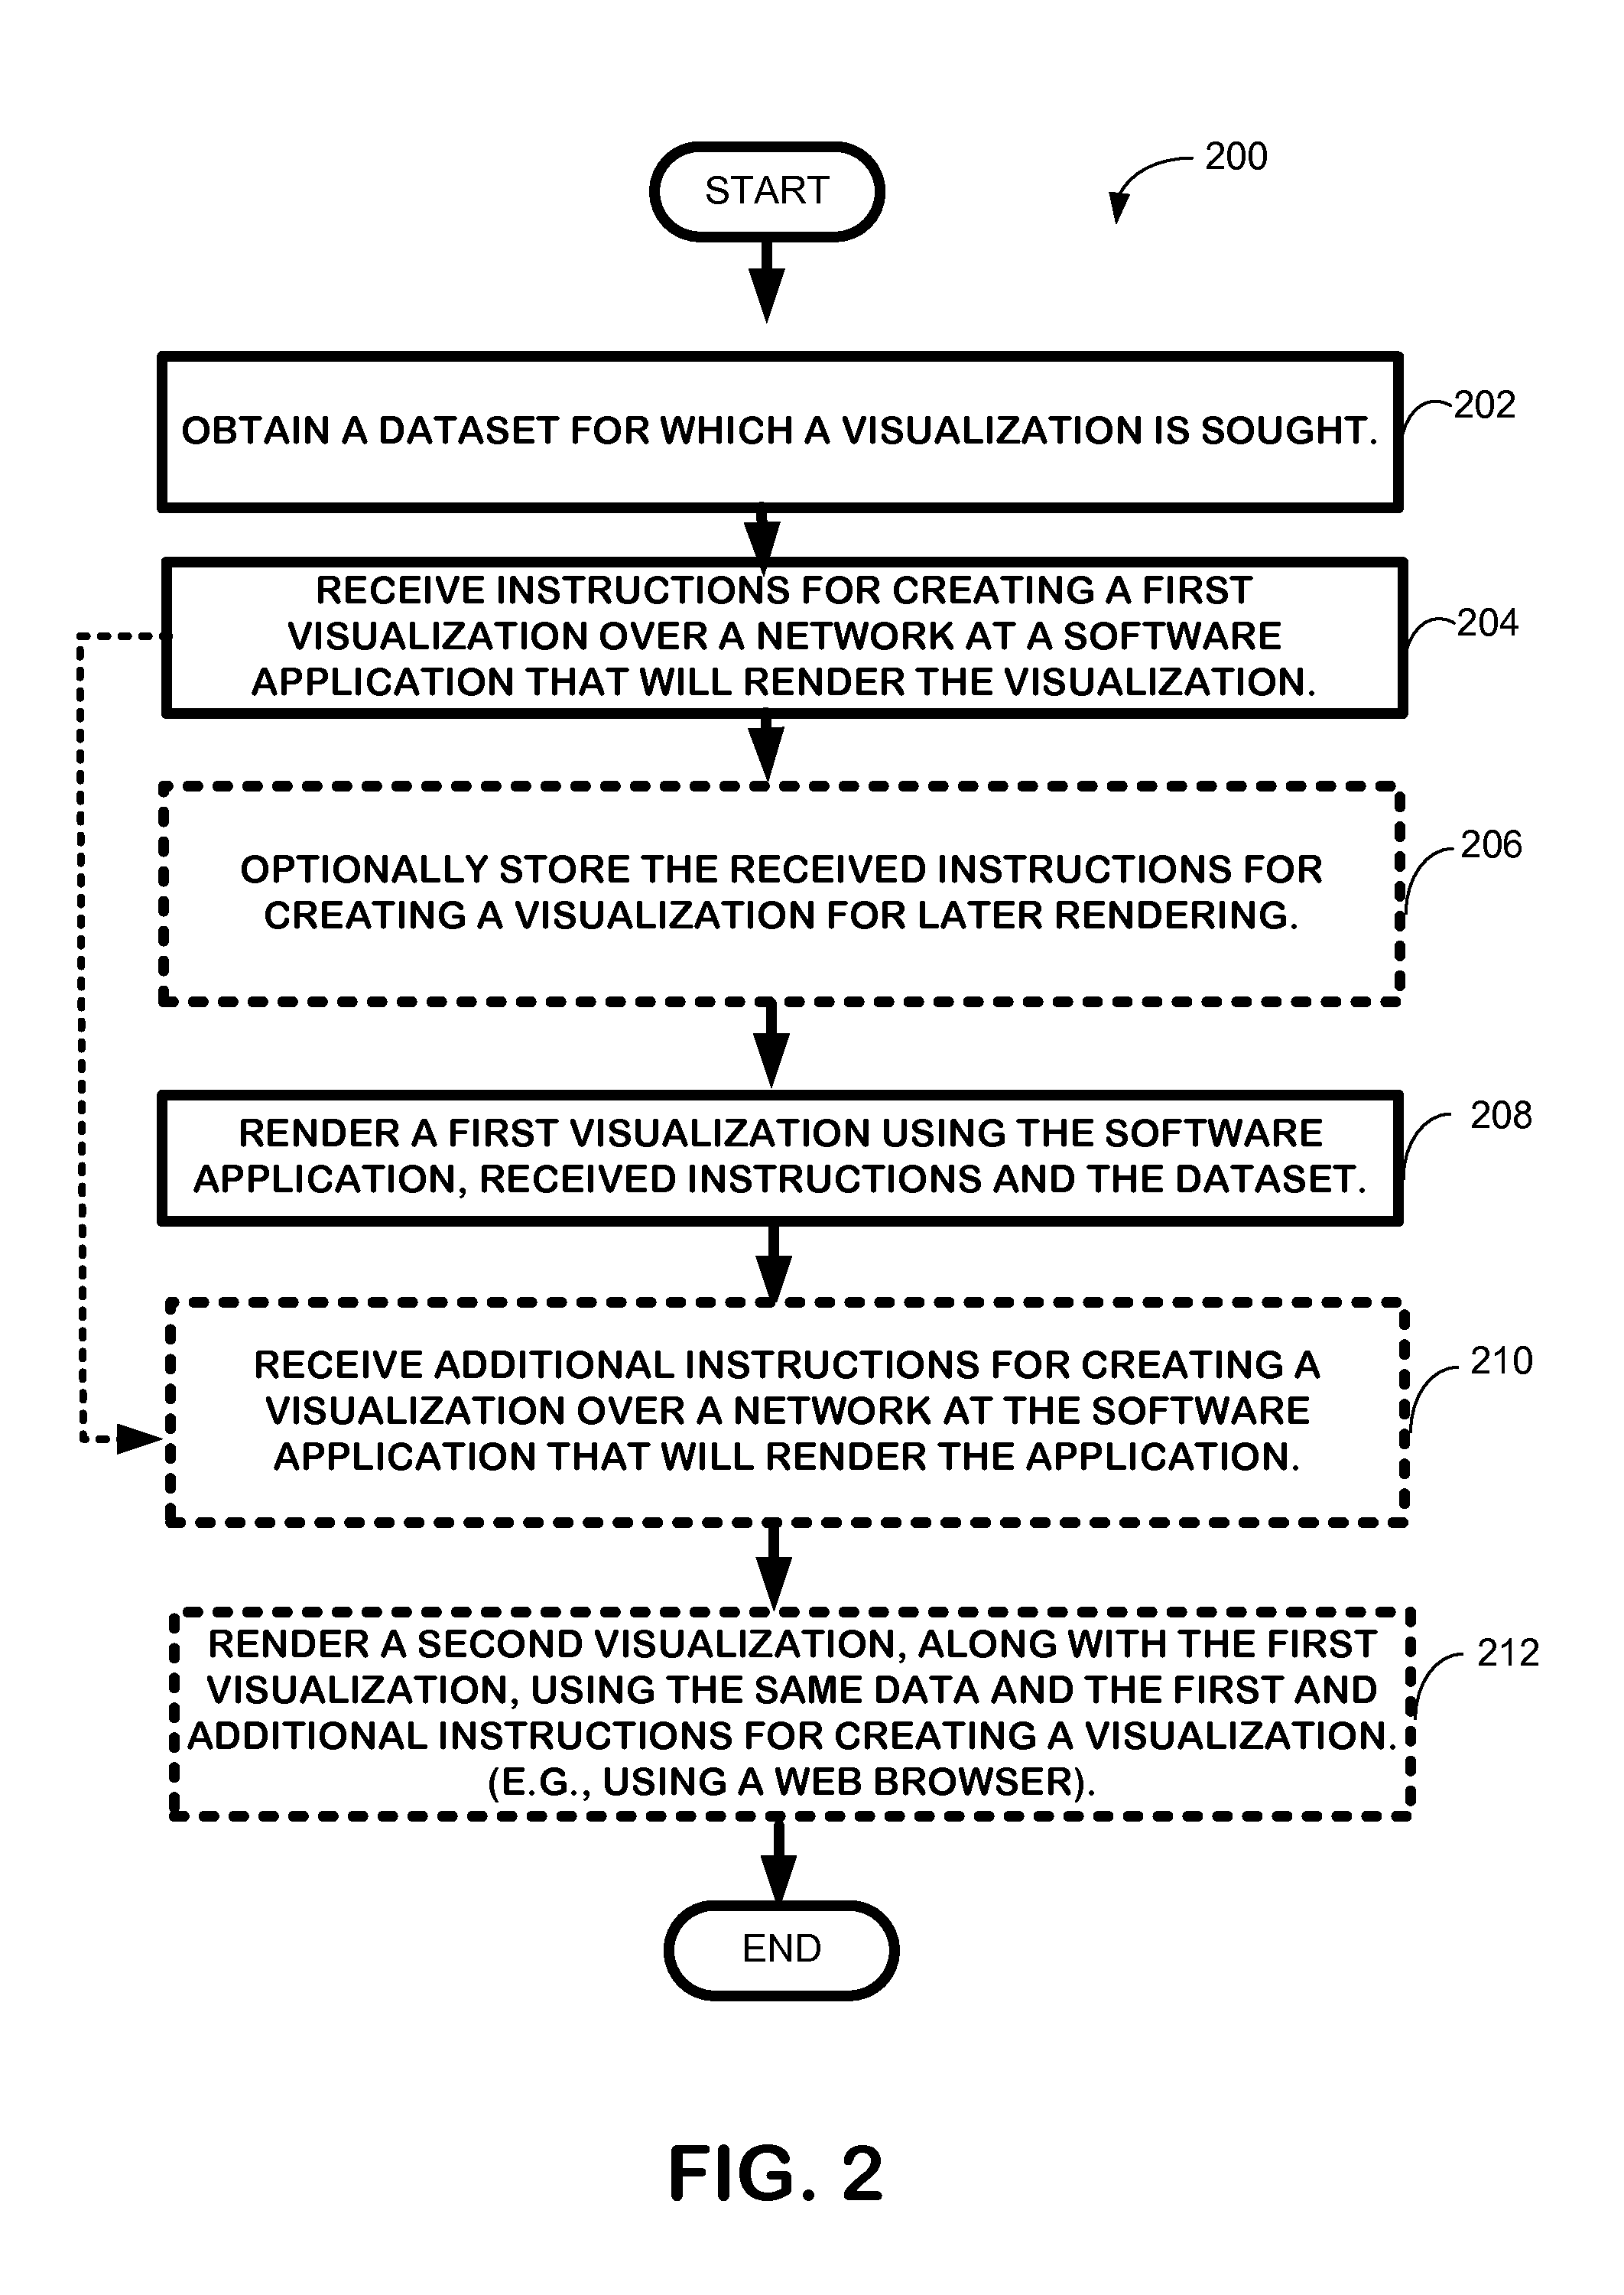
Additionally, the persistent form of a visualization can include a bitmap snapshot of the visualization, to be used as a fallback when executing the visualization is not possible, for example, when a visualization requires a network connection to build a rendering, and the network connection is not available.
Two great concerns that are associated with web-based visualizations is the ability to use the visualization when not connected to the Internet and privacy / security issues surrounding the use of visualizations.
Visualizations that do not require the Internet can be used offline, while some visualizations cannot be used when no network is available.
Any system that loads programs from the web represents potential security concerns, both with the data that is being shared and with other data resident on a local client.

Method used


Image

  • Pluggable Web-Based Visualizations for Applications
  • Pluggable Web-Based Visualizations for Applications
  • Pluggable Web-Based Visualizations for Applications

Examples


Embodiment Construction

[0012]In the following description of the pluggable web-based visualization technique, reference is made to the accompanying drawings, which form a part thereof, and which show by way of illustration examples by which the pluggable web-based visualization technique described herein may be practiced. It is to be understood that other embodiments may be utilized and structural changes may be made without departing from the scope of the claimed subject matter.

1.0 Pluggable Web-Based Visualization Technique

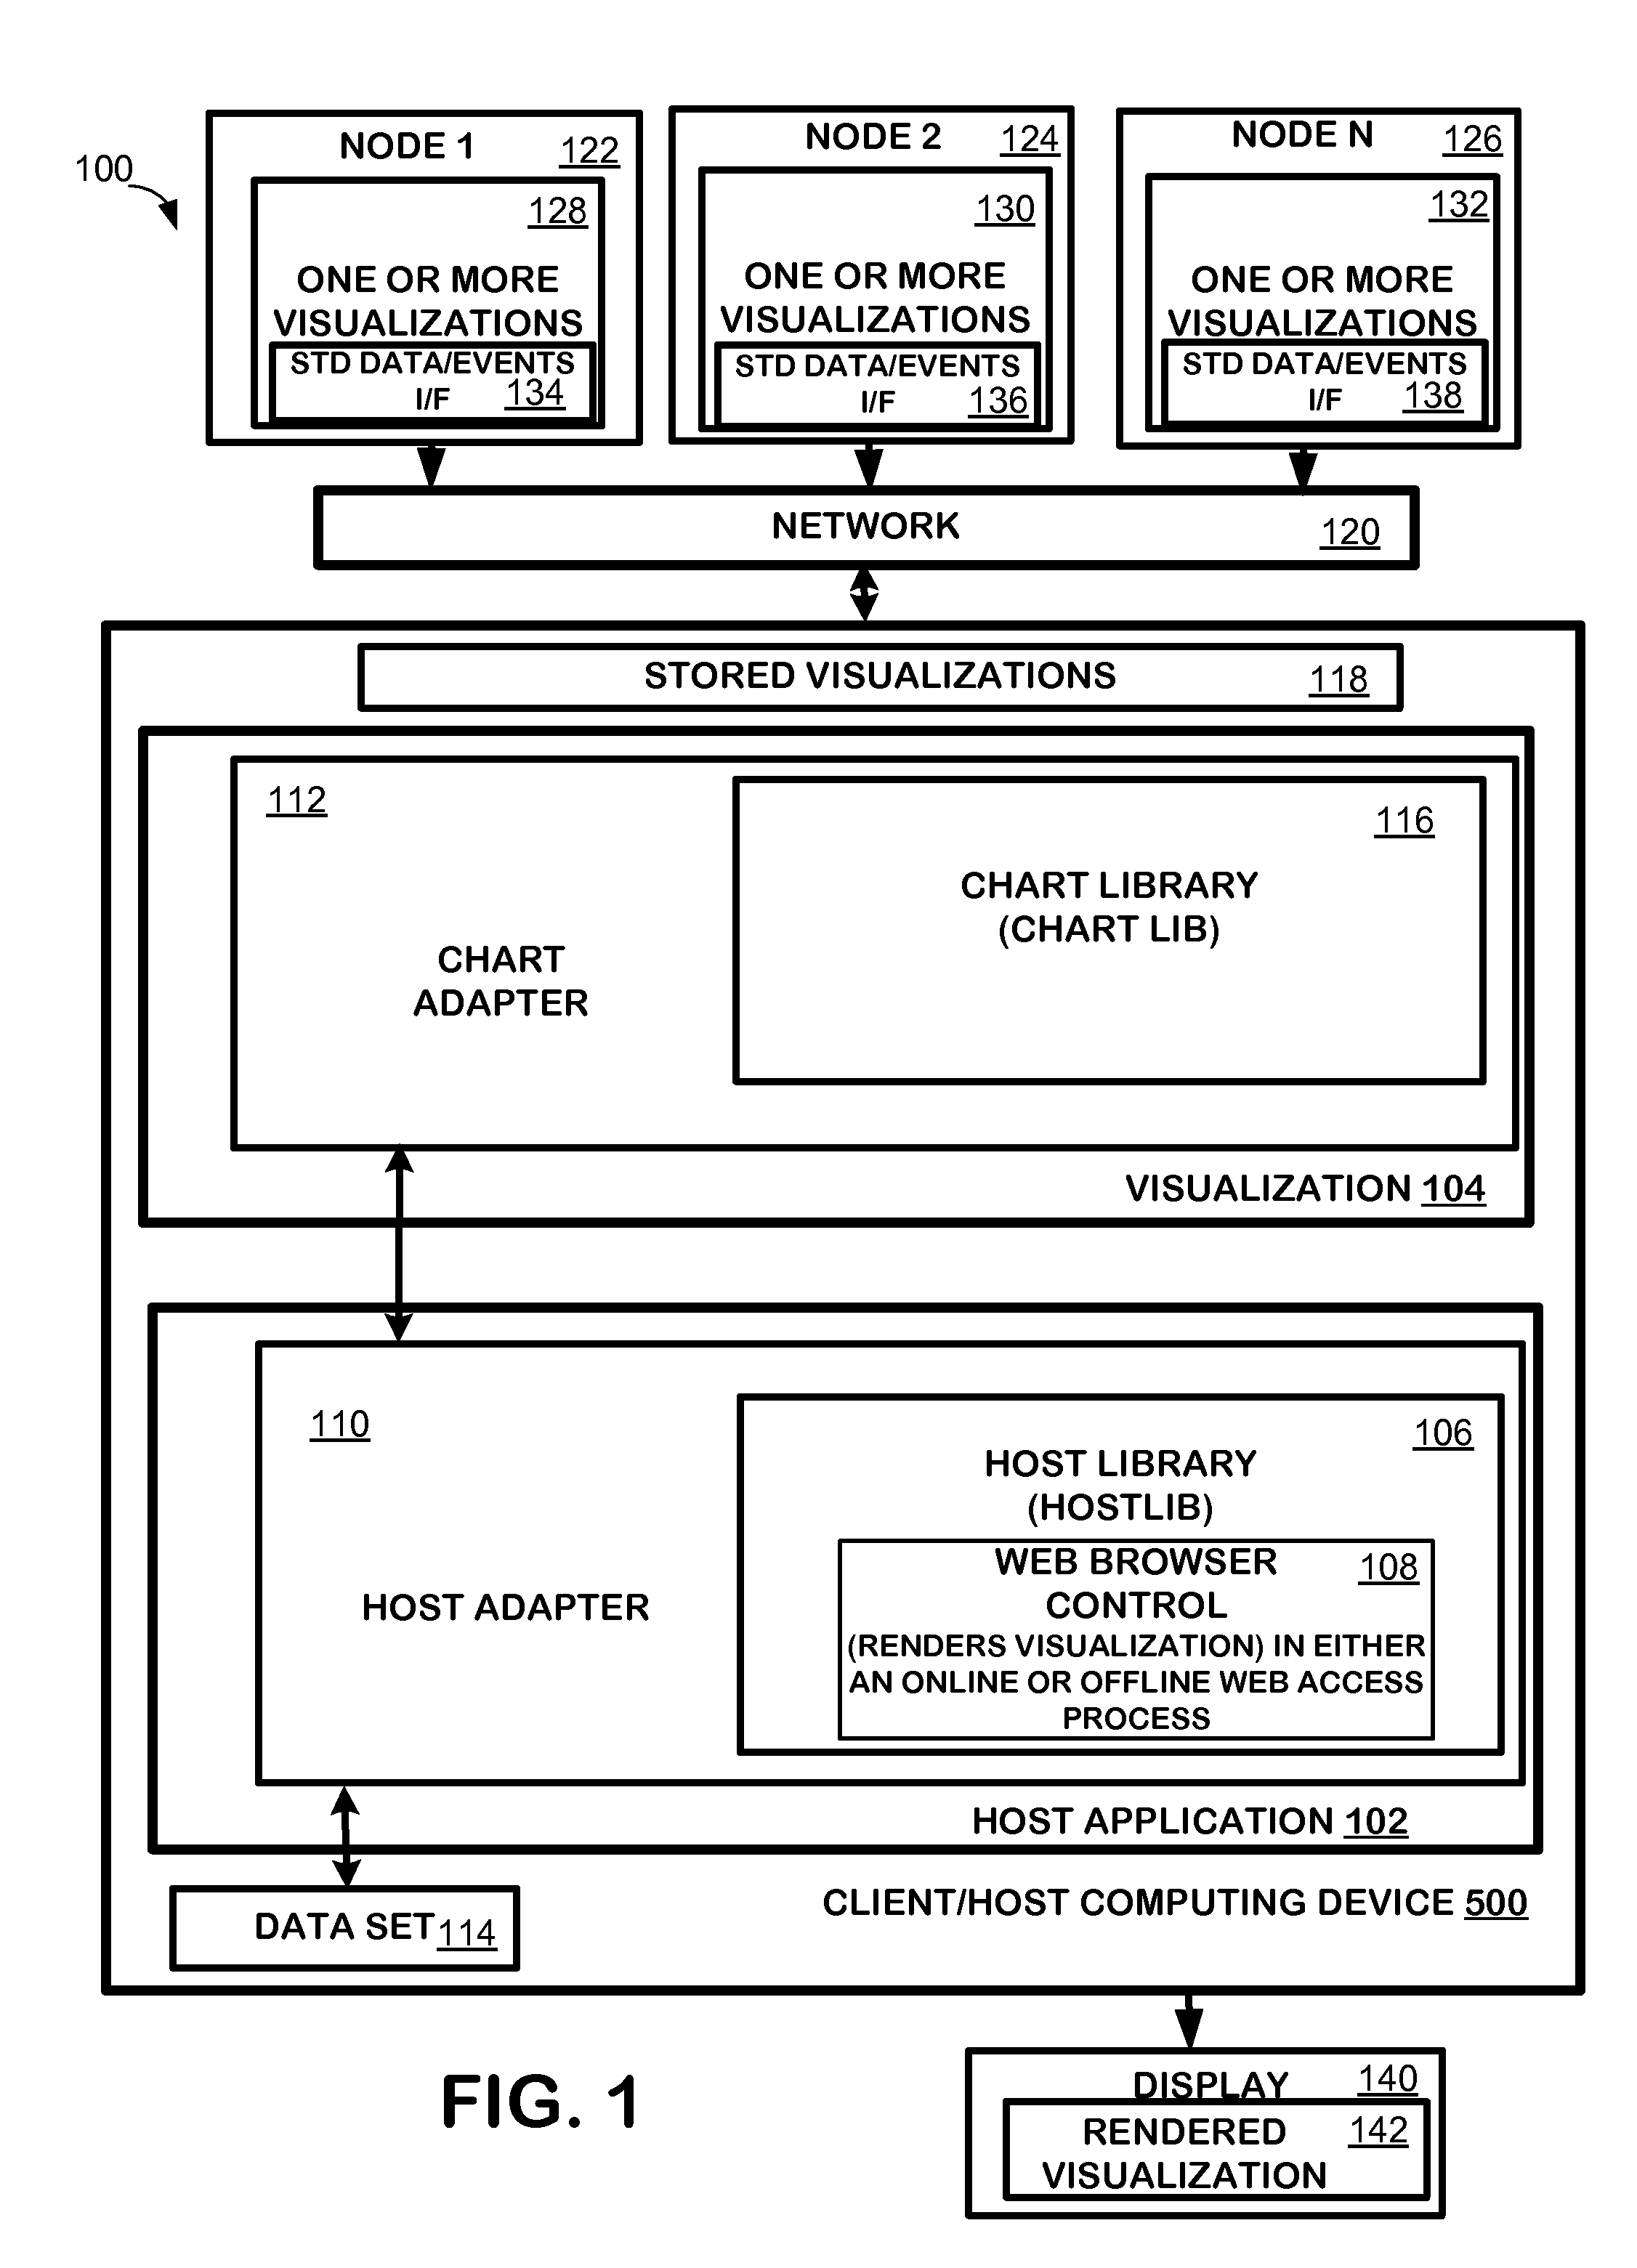
[0013]The following sections provide background information with respect to how visualizations are created and used, information on visualizations on the web, and an overview of the pluggable web-based visualization technique. An exemplary architecture and processes for employing the technique are also provided, along with details of exemplary embodiments of the technique.

1.1 Background Information on Creation and Use of Visualizations

[0014]New visualization techniques are constantly ...


PUM


Abstract

The pluggable web-based visualization technique described herein pertains to a method for providing pluggable web-based visualizations for applications. The method selects visualizations from the web to be embedded into a host application on a desktop computing device. The visualizations can be plugged in to a variety of host applications. This empowers end-users, application designers, and visualization designers by allowing greater reuse of existing code. Additionally, end-users do not have to wait for new revisions of existing applications to use the latest techniques. Designers of domain specific visualizations can work on just the visualization and have them incorporated into a variety of different host applications. Users can perform local processing and visualizations on their own machine, yet obtain new visualizations from the web where they can be updated more frequently and where special purpose visualizations are available.

Description

[0001]A visualization's purpose is to communicate data by producing an image so that the viewer can learn something from the data. For example, a visualization can be a bar chart, a pie chart or a line chart, all generated from the same data set. Some desktop applications, such as, for example, spreadsheet applications, feature fast computation of data and easy access to visualizations. However, typically the set of visualizations in a desktop application is limited to those that are supported by the application. Thus, if, for example, a spreadsheet application does not offer a tree map, then there will be no opportunity to access this type of visualization within the application.[0002]Desktop applications have comparatively slow ship cycles. It can take years from noticing an interesting visualization to including it in an application. Specialized visualizations, such as visualizations used for one particular type of business, are very unlikely to ever be added to most software app...

Claims


Application Information

Patent Timeline
IPC IPC(8): G09G5/00
CPCG06F17/30905G06T11/206G06T11/60G06F16/9577
Inventor FISHER, DANYELFERNANDEZ, ROLANDDRUCKER, STEVEN MARK
Owner MICROSOFT TECH LICENSING LLC
Learn More