The generated datasets are unsurprisingly vast.
Such a level of resolution is considered irresolvable.
Web browser-implemented techniques permit graphical representation and interaction with charts, but such current techniques take an unacceptably long time to process large datasets to render the graphs.
More specifically, current Flash Based Solutions (FBS) allow users to visualise their data, albeit in a rather restricted way in that FBS employs selectively reduced datasets that give only an illusion of interacting with the larger dataset (whereas in effect they average the data and thus compromise resolution).
Further, FBS data is subset based, with each data subset being non-
recovery in the sense that, once a particular sample has been downloaded, it is not possible to toggle / select either to another adjacent frame or to another dataset without having to select and load a new sample realised by a computationally different data subset.
And, having loaded any dataset, it is not possible to return to the previous
zoom level because the graphic representation and the subset data for that previous
zoom level has been deleted / wiped from the local computing platform.
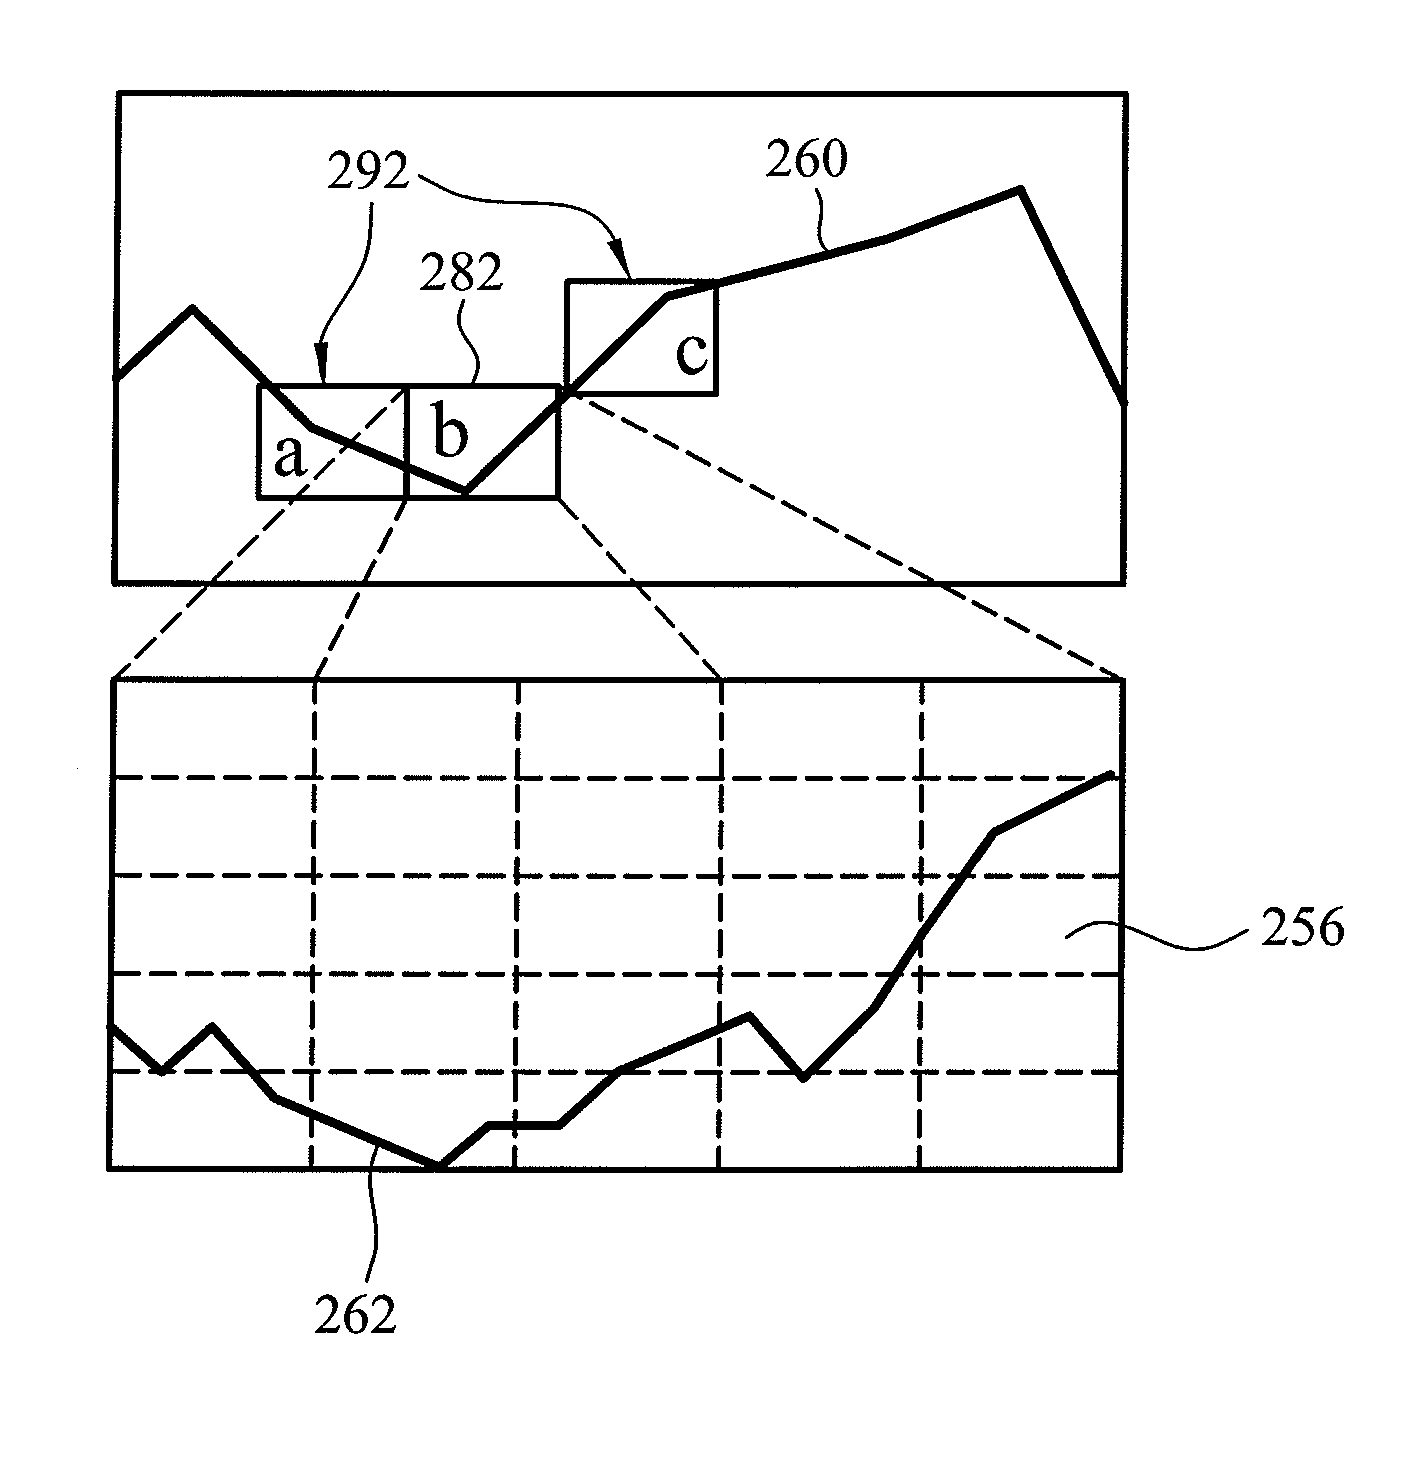
Similarly, with a graphical representations rendered on a uniquely selected subset of data, it is not possible to pan left or right to explore and easily identify further and extended temporal trends in the data.
It is therefore difficult for a user to select the “
viewport” (i.e. the fixed size
reference frame, window or area) to ensure that they have both sufficient resolution and a sufficient window of time in which to perceive and / or identify one or more relevant trends.
Delays of several seconds in the rendering of the graphs are therefore not untypical, with the
delay suggesting to the user that the local computer's processor has locked-up; this may inappropriately encourage the user to enter additional keystrokes or mouse movement.
And such additional keystroke entry or mouse movement is undesirable since it draws additional
processing resources and it may affect cursor position which may, in turn, cause an inadvertent selection of a new window parameter and the associated download of another data subset.
Consequently FBS-based systems are unable to fully harness the capabilities of high performance client computers for processing larger datasets.
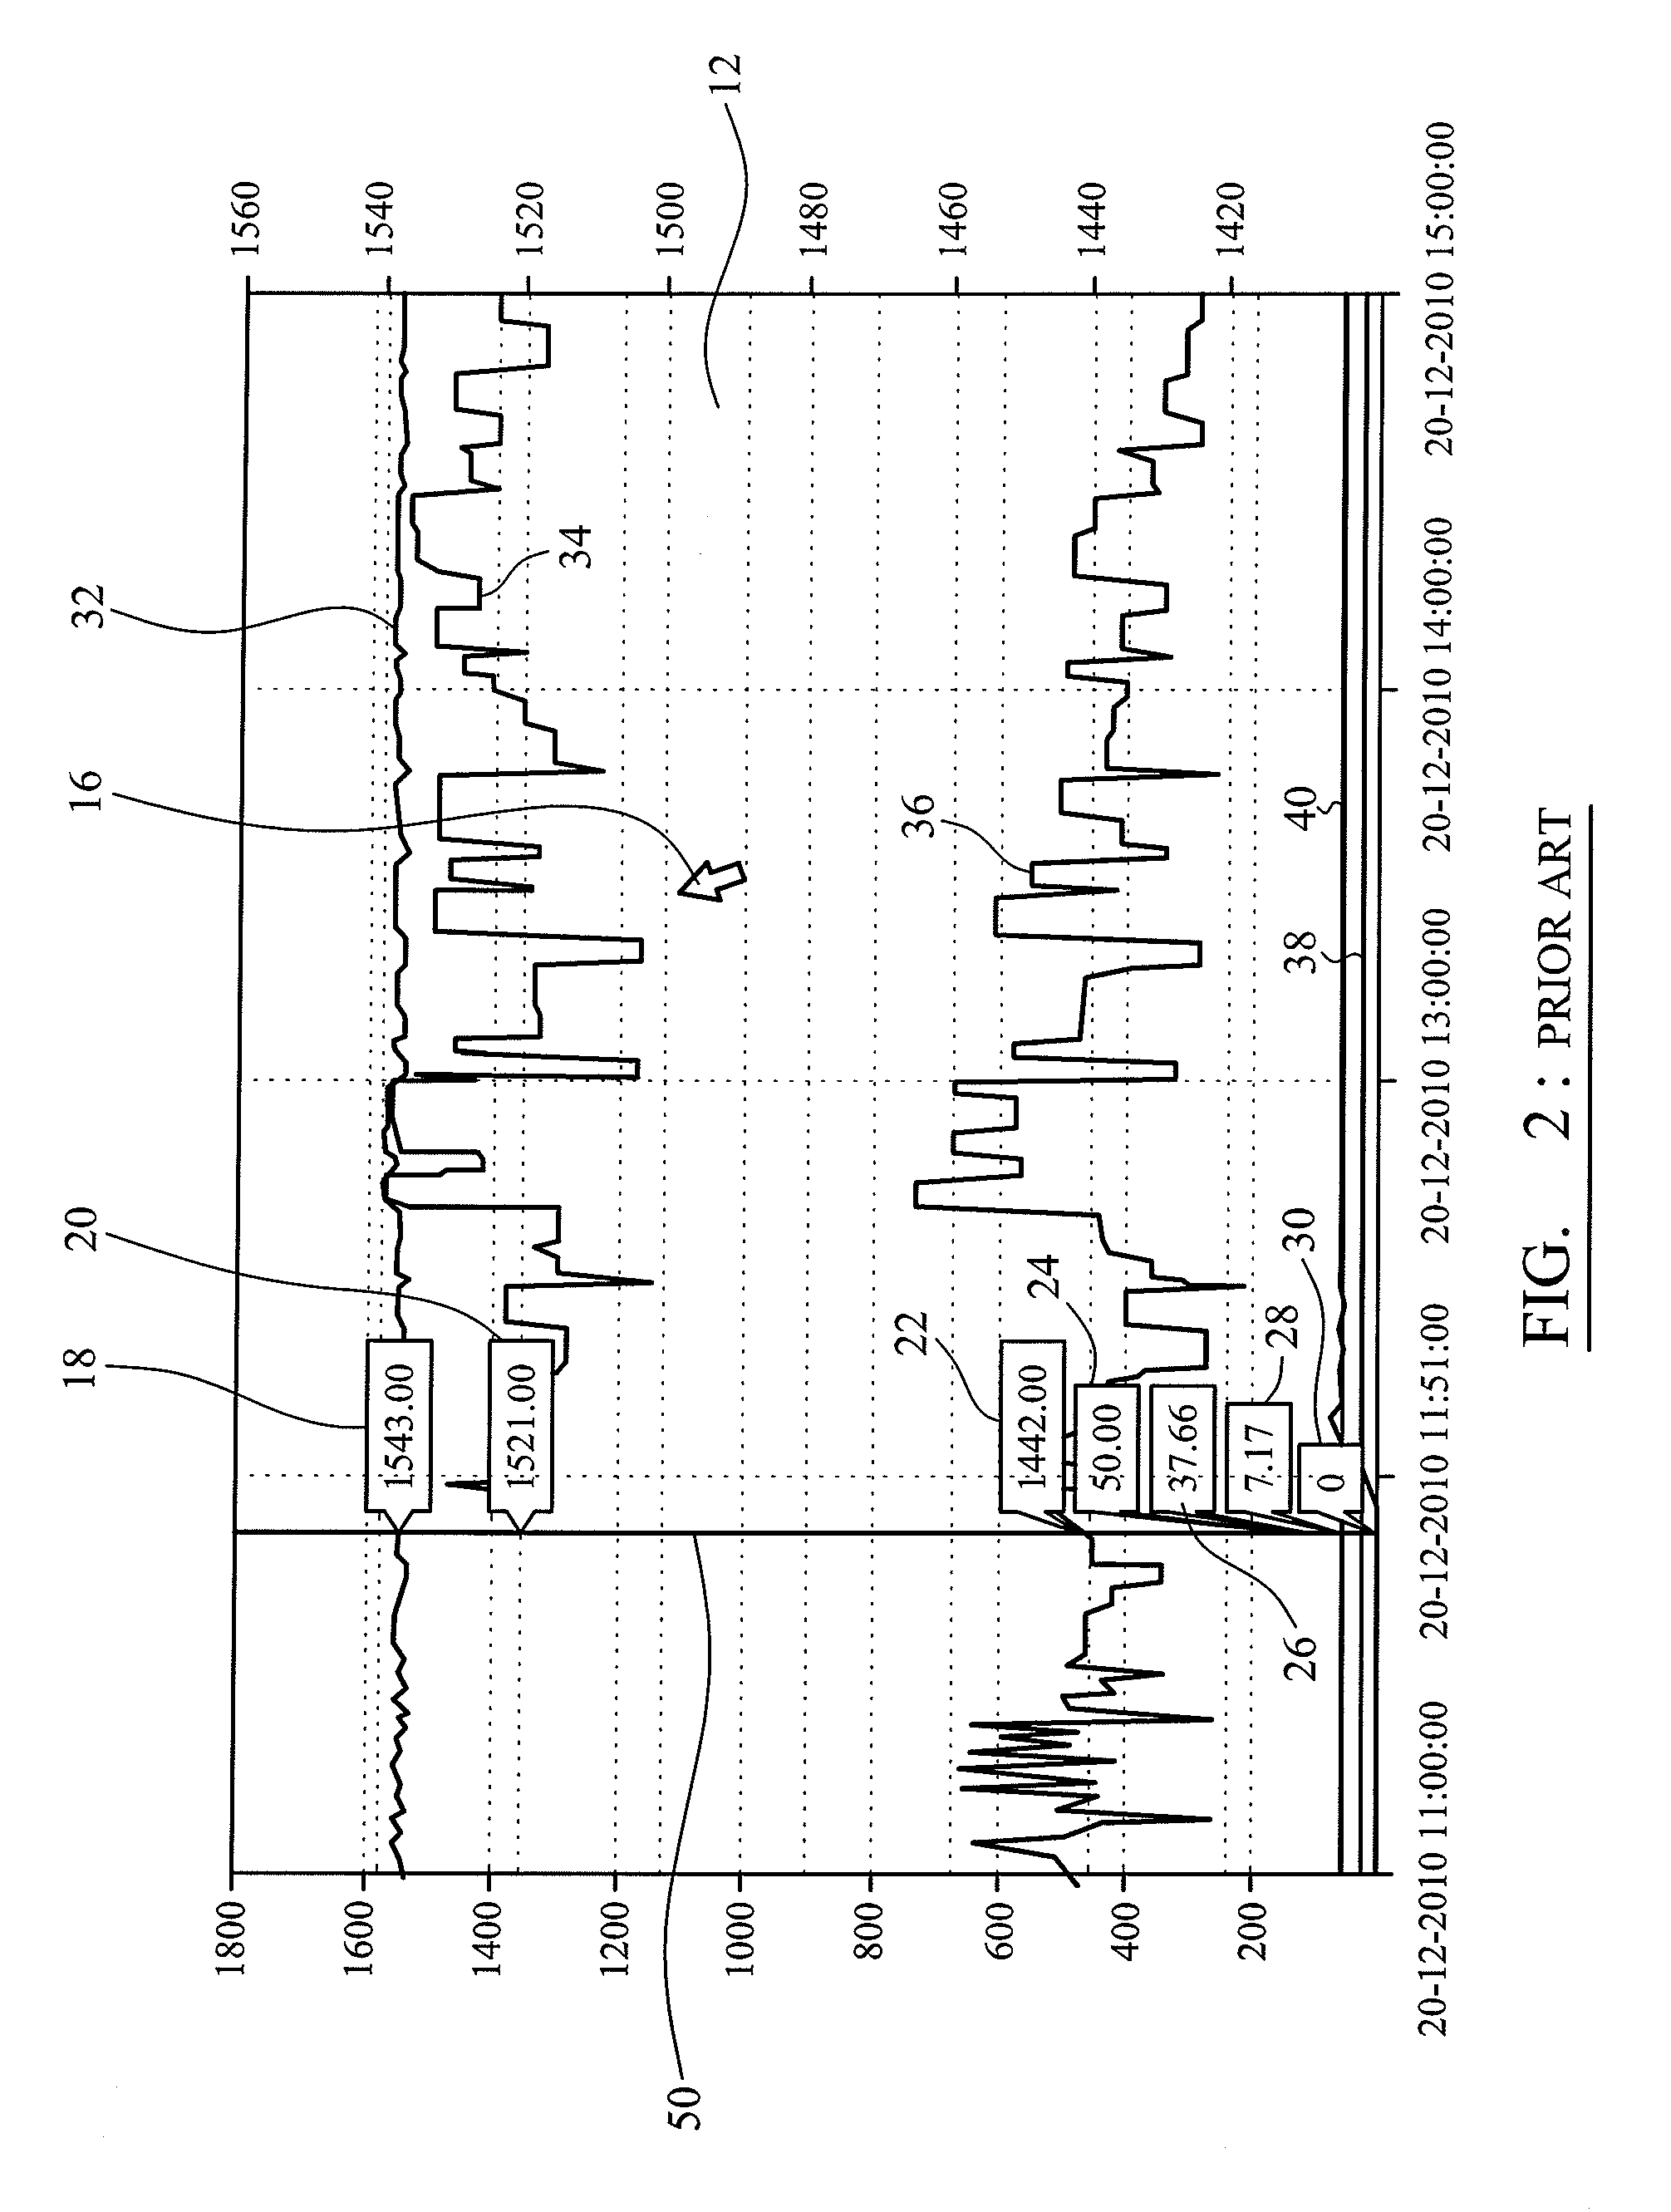
The generation and display of these pop-ups actually inhibits responsiveness of the
computer mouse and thus diminishes selectivity and external control for the user.
Unfortunately, using an FBS with irregularly spaced data leads to a very misleading representation of the dataset because FBS processes are programmed to assume that data will always be linearly spaced, i.e. without irregular time entries that occur, for example, when the nominal sampling rate changes from once per minute to, say, once per second.
FBS excludes the appropriate handling of non-linear interval sampling because the additional processing overhead required to interpret, scale and display such non-linear data would result in unacceptably long rendering times.
FBS is therefore deficient in that it is unable to deal with real-life situations where: i) an alarm (in an
telemetry measurement system) could cause a time offset to occur, say, twenty seconds into a five minute cycle; and ii) a change in data
logging granularity is triggered by an alarm events that causes data (for a variety of selected parameters) to be logged every second (or at least higher
granularity) relative to normal data
logging regimes.
Combining alarm-related data with normally logged data also leads to a large dataset with irregular intervals and the potential for the aforementioned
skew in visual representation.
In fact, empirical evidence shows that FBS slows down unacceptably when
parsing large datasets with
time information.
For example, even calculating “zero” data requires processing consideration within an FBS environment, with this slowing down graph rendering and graph responsiveness.
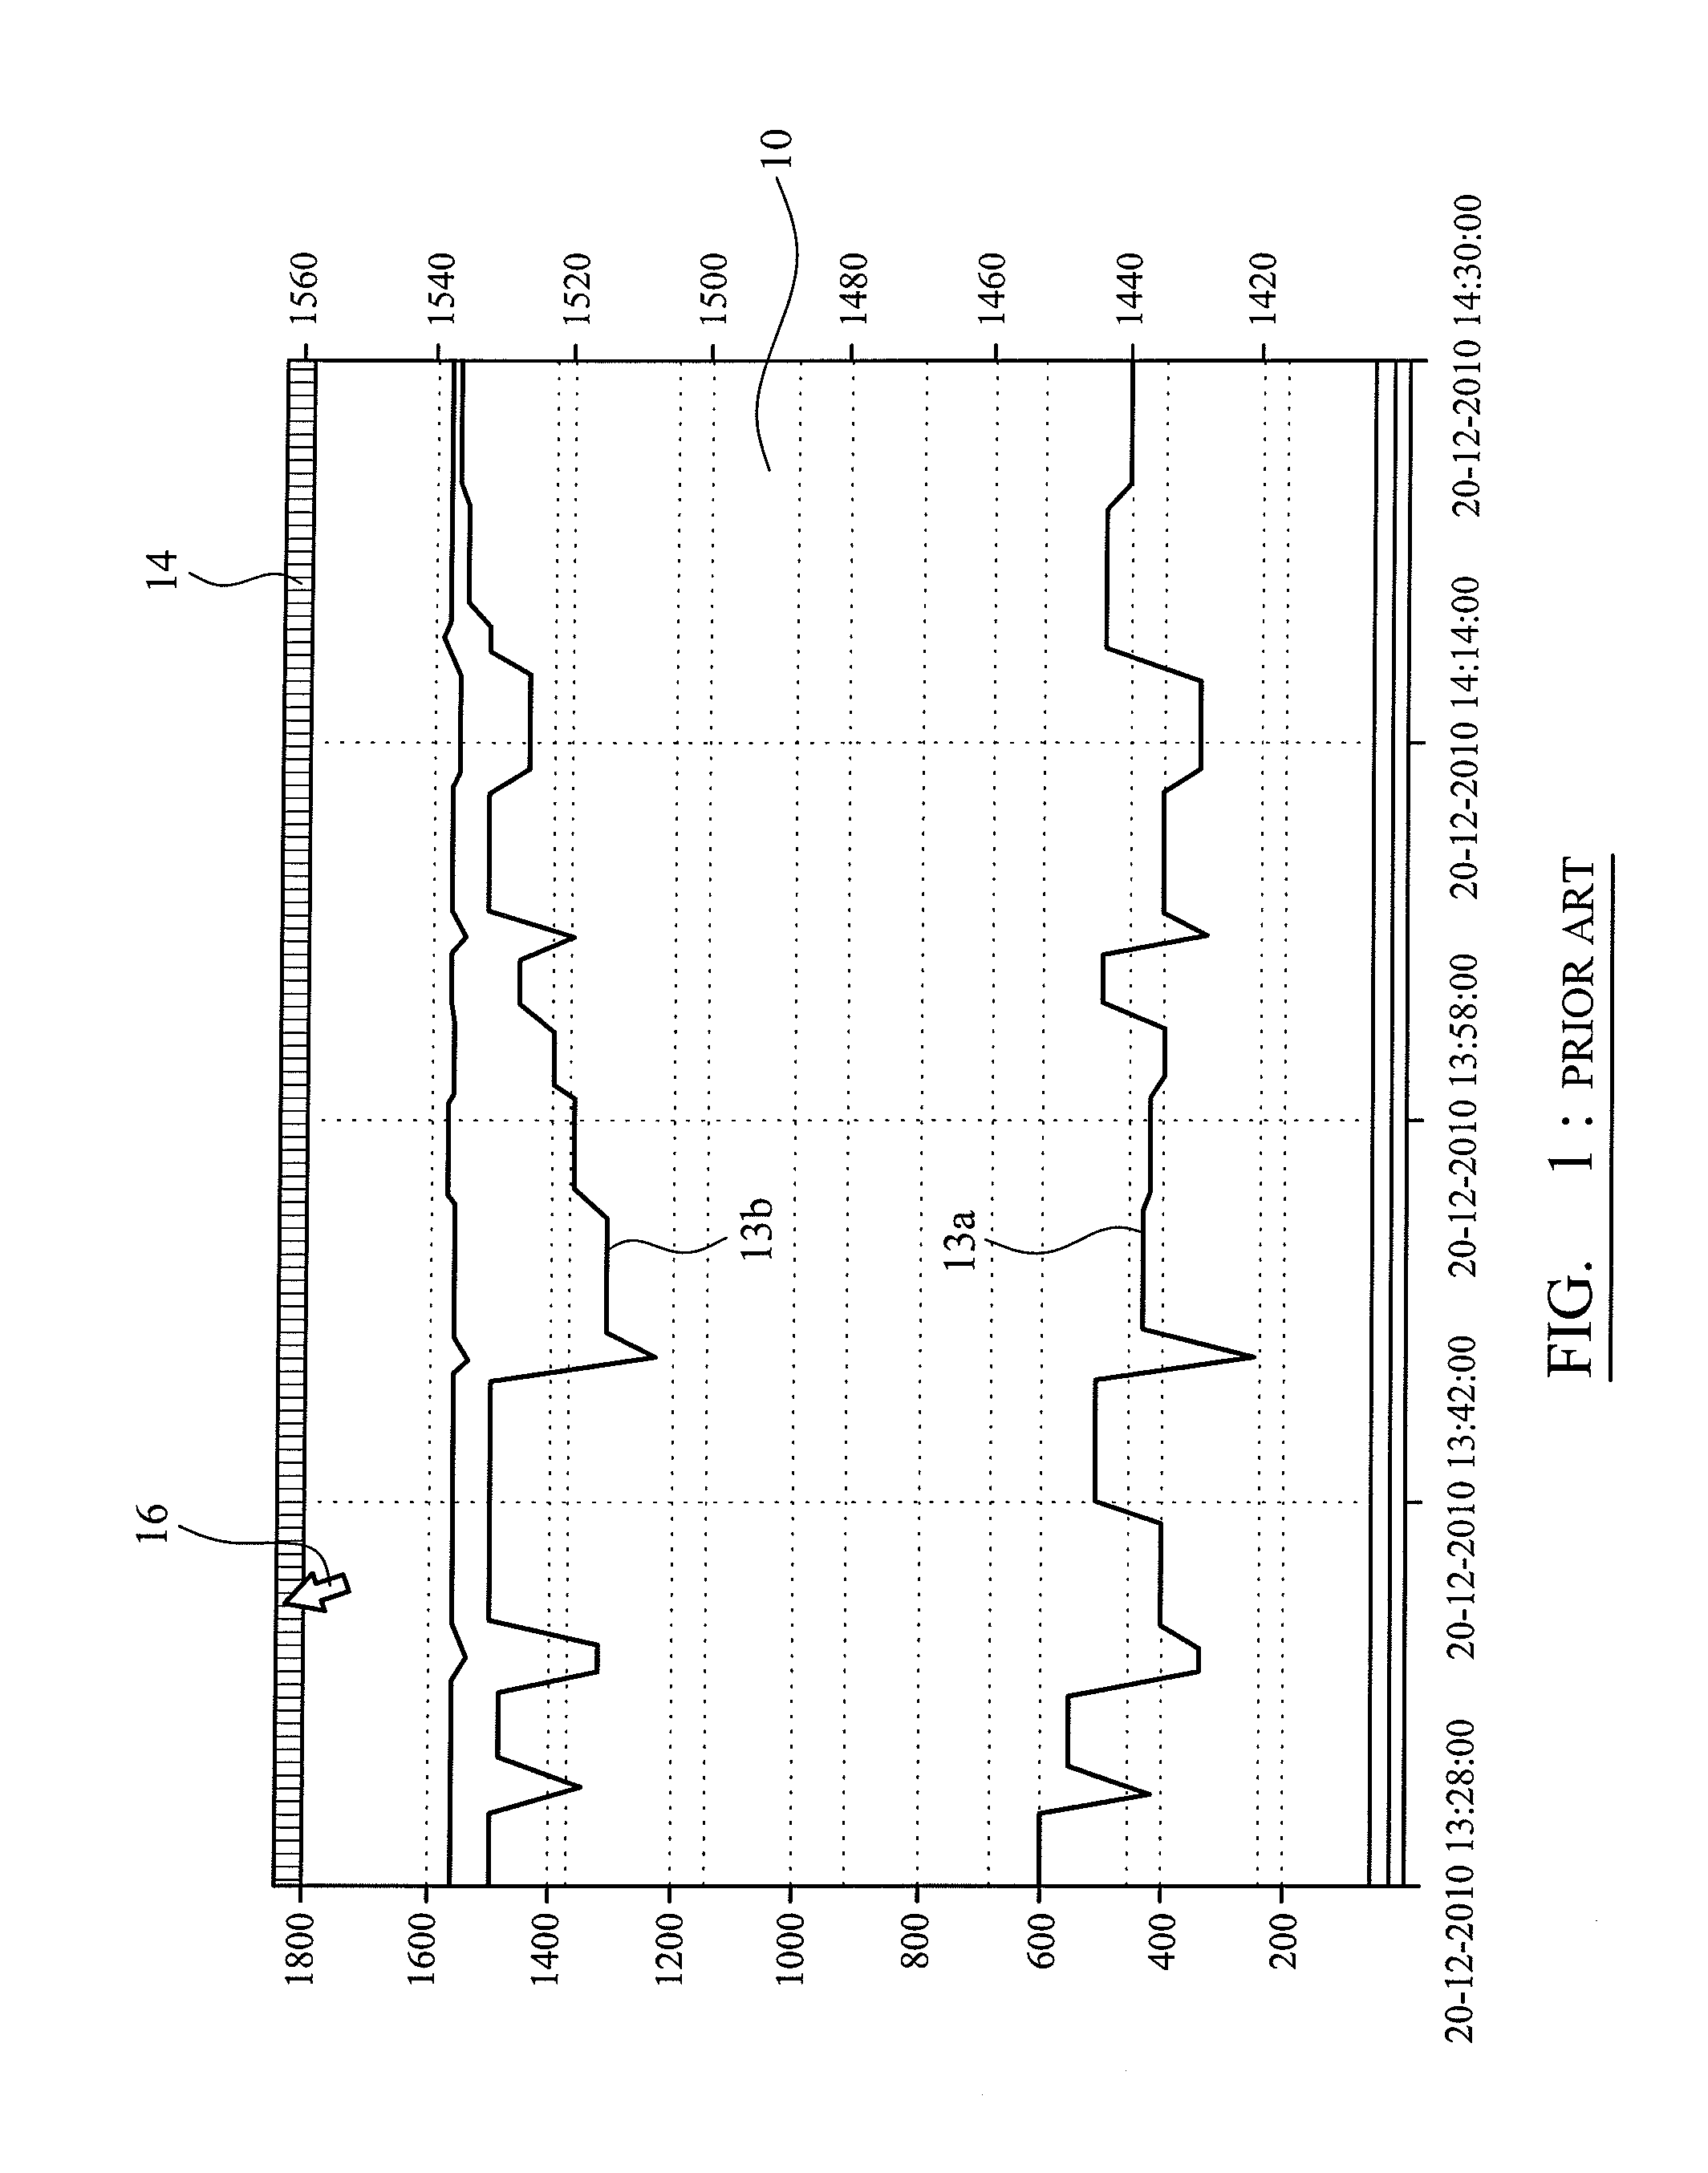
Further, in viewing an FBS-generated graph covering a six-month window of time and a nominal thirty minute sampling rate, data might well be averaged to a one-week window of resolution which provides no meaningful
trend analysis.
In fact, using an FBS solution means that it is not possible to resolve
individual data points without selecting a detailed level, and then this more detailed level provides no overall trend-context and further requires explicit recalculation of all relevant data points.
FBS application charting modules (such as employed at http: / / www.xe.com / ucc / ) become both increasingly unwieldy and difficult to process and render as the dataset increases in size and the responsiveness of the output (and particularly the generation of charts or graphs) is reduced.
Existing FBS charting module application therefore have a
user interface that is considered highly granular and non-intuitive in that data precise data points are not easily resolvable within a
viewport of the conventional display unit and delays inherently arise from a disjointed processing and presentation of subsets of data points.
Consequently, FBS-based representation is from the outset compromised in telemetry or remote monitoring systems where logged data contains large quantities of time-based information.

