Quality control of sub-surface and wellbore position data

a position data and quality control technology, applied in the field of quality control of subsurface position data and wellbore position data, can solve the problems of unexpected positional inconsistency, incorrect assumptions about the parameters of seismic velocity model, and large and small parts of observation data accuracy, so as to improve the position accuracy of the subsurface positional model, improve the probability of missing drilling targets, and improve the accuracy of the output

Inactive Publication Date: 2013-12-19
DEN NORSKE STATS OLJESELSKAP AS
View PDF23 Cites 12 Cited by
  • Summary
  • Abstract
  • Description
  • Claims
  • Application Information

AI Technical Summary

Benefits of technology

[0018]The position accuracy of the subsurface positional model is improved by adding wellbore positional information. Several geostatistical software packages provide such functionality. Sub-surface and wellbore position data can be combined and adjusted according to certain adjustment principles, such as the method of least squares. Detection of gross errors is vital in order to ensure optimal accuracy of the output from all kinds of subsurface positional estimation. A gross error in either a well-pick or the sub-surface model will lead to unexpected positional inconsistency. This might for instance increase the probability of missing drilling targets. QC of input data is especially important when the estimation principle is based on the method of least squares, since this method is particularly sensitive to gross errors in observation data. Most software for subsurface position uses the principle of least squares to combine and adjust data from wells and the sub-surface model. Statistical testing is based on objective evaluation criteria. Consequently, the QC method which is developed can therefore be applied with minor human intervention. The method therefore has the potential of being carried out automatically.

Problems solved by technology

A mismatch can for instance be an error affecting the 3D coordinates of several well-picks in the same well equally, such as an error in the measured length of the drill-string.
Other examples are wrong assumptions about the accuracy of larger and smaller parts of the observation data and incorrect assumptions of the parameters of the seismic velocity model.
A gross error in either a well-pick or the sub-surface model will lead to unexpected positional inconsistency.
This might for instance increase the probability of missing drilling targets.

Method used


Image

  • Quality control of sub-surface and wellbore position data
  • Quality control of sub-surface and wellbore position data
  • Quality control of sub-surface and wellbore position data

Examples


Embodiment Construction

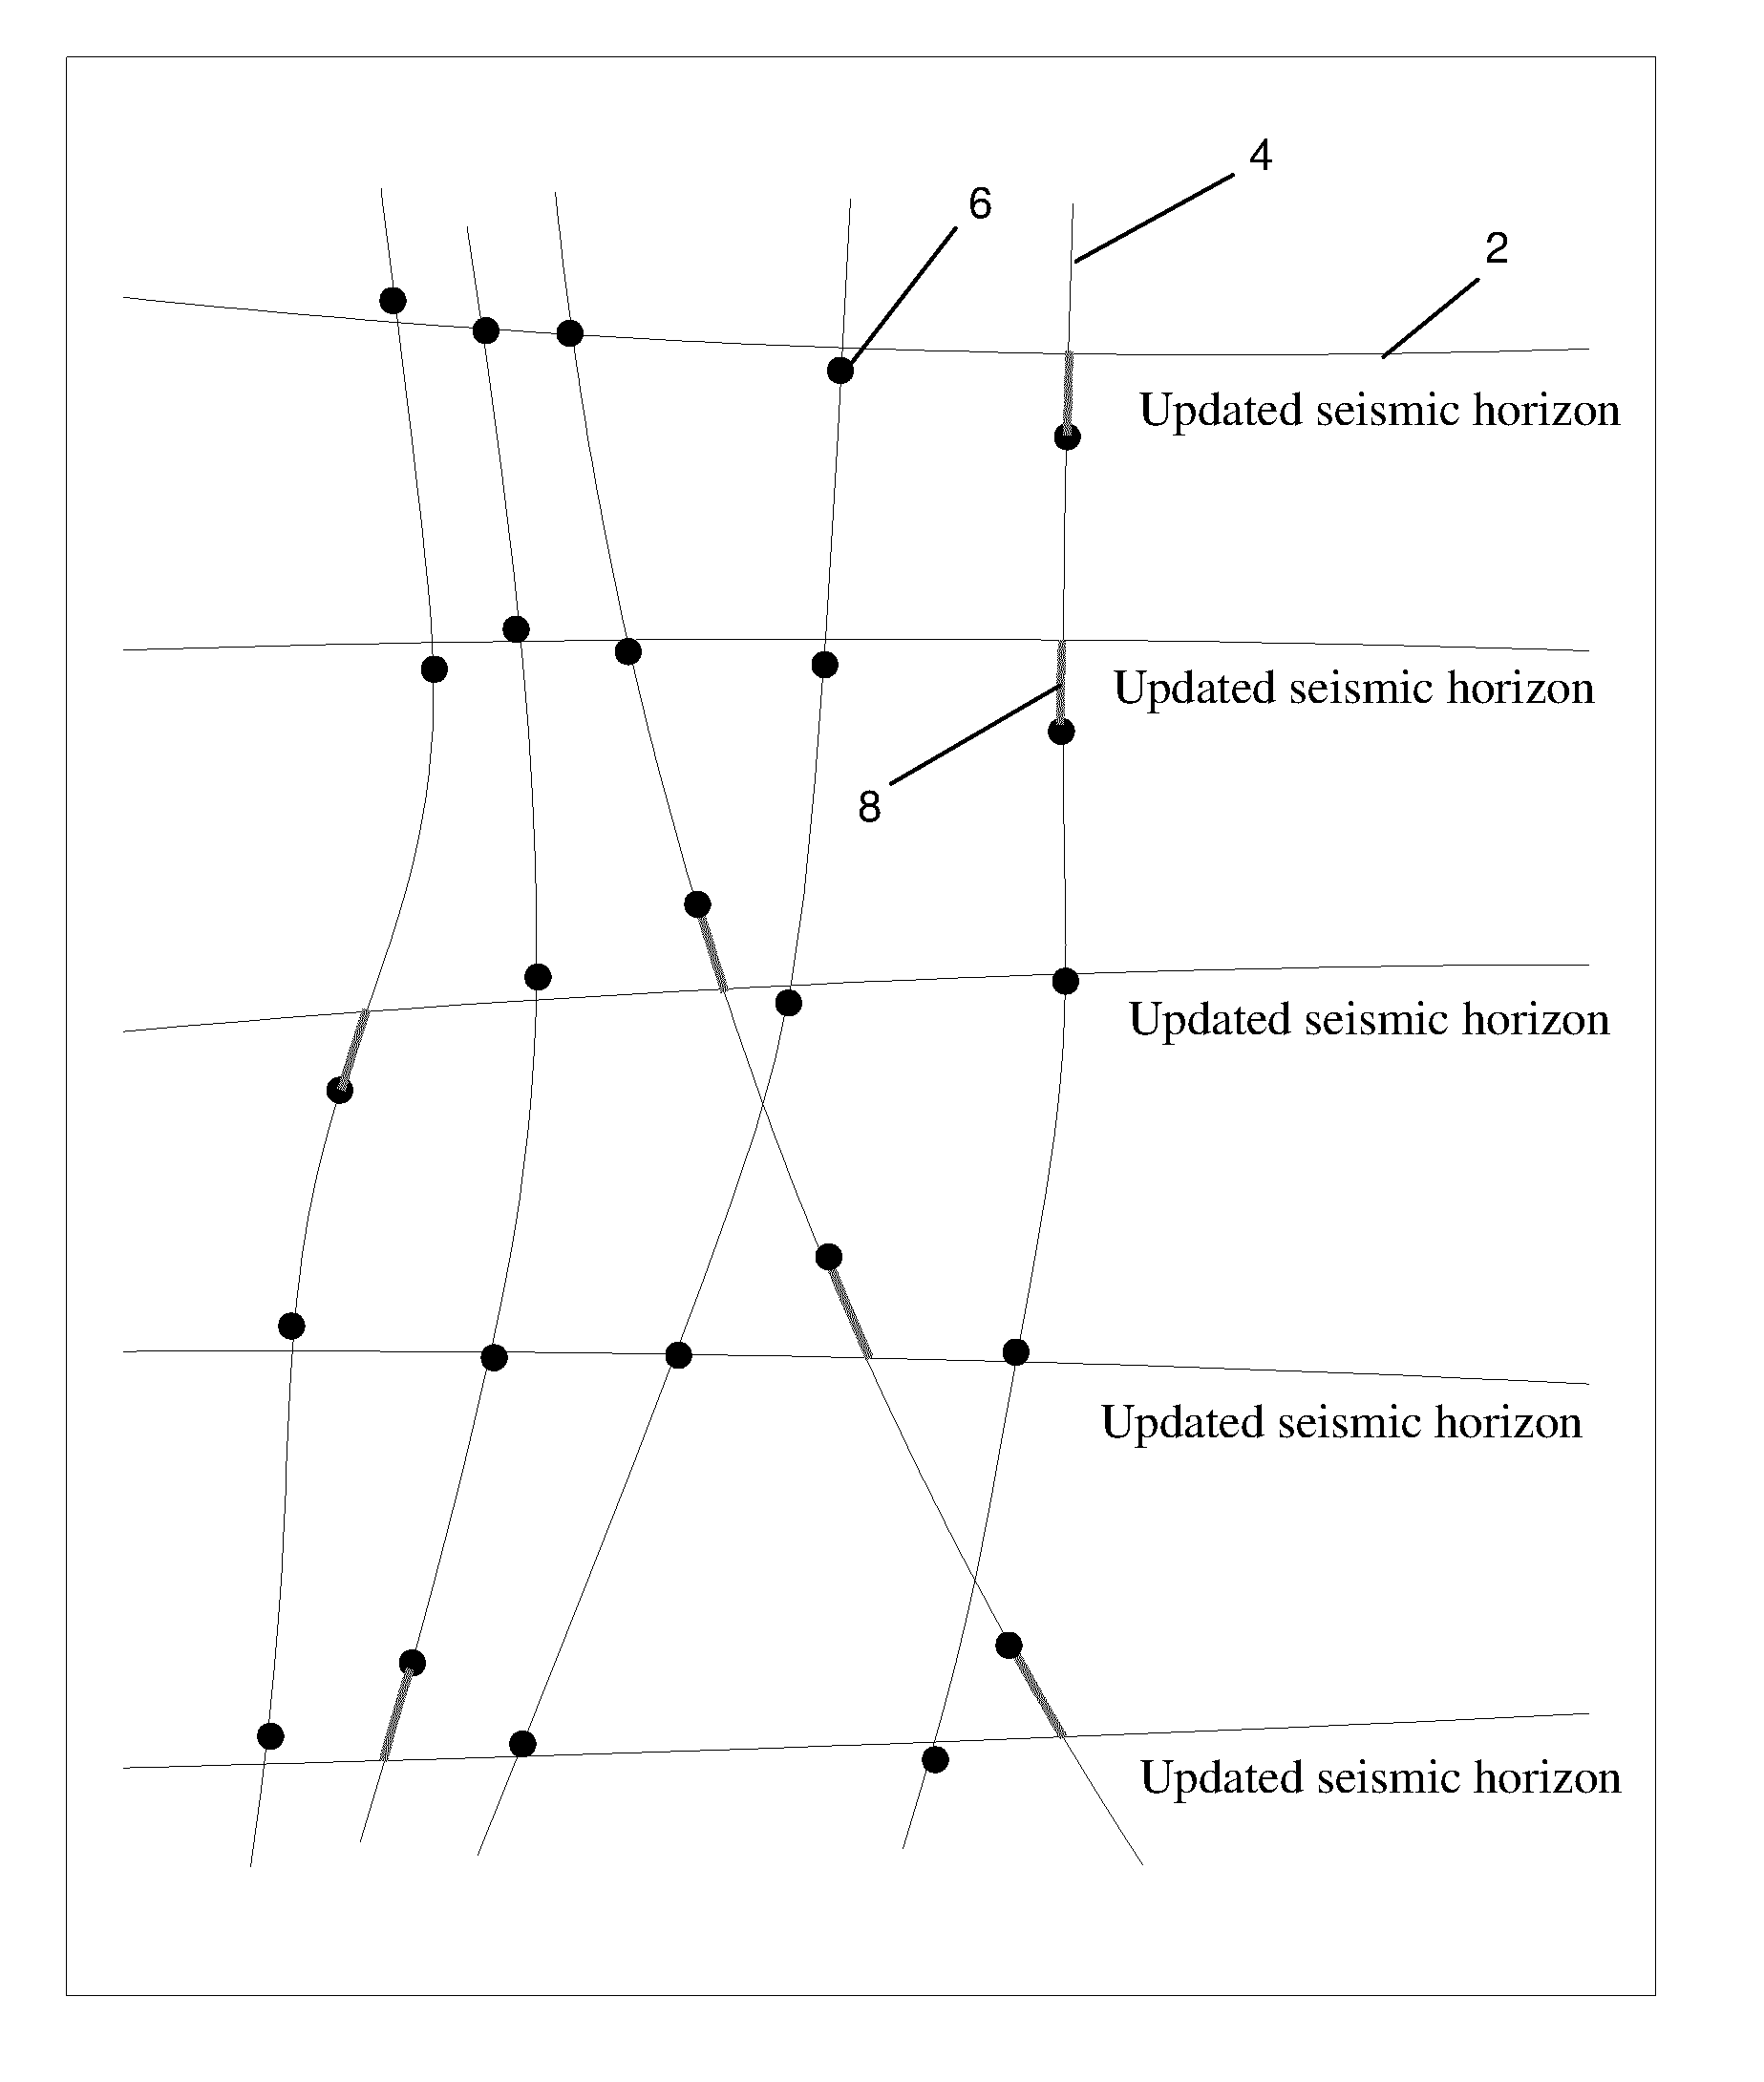
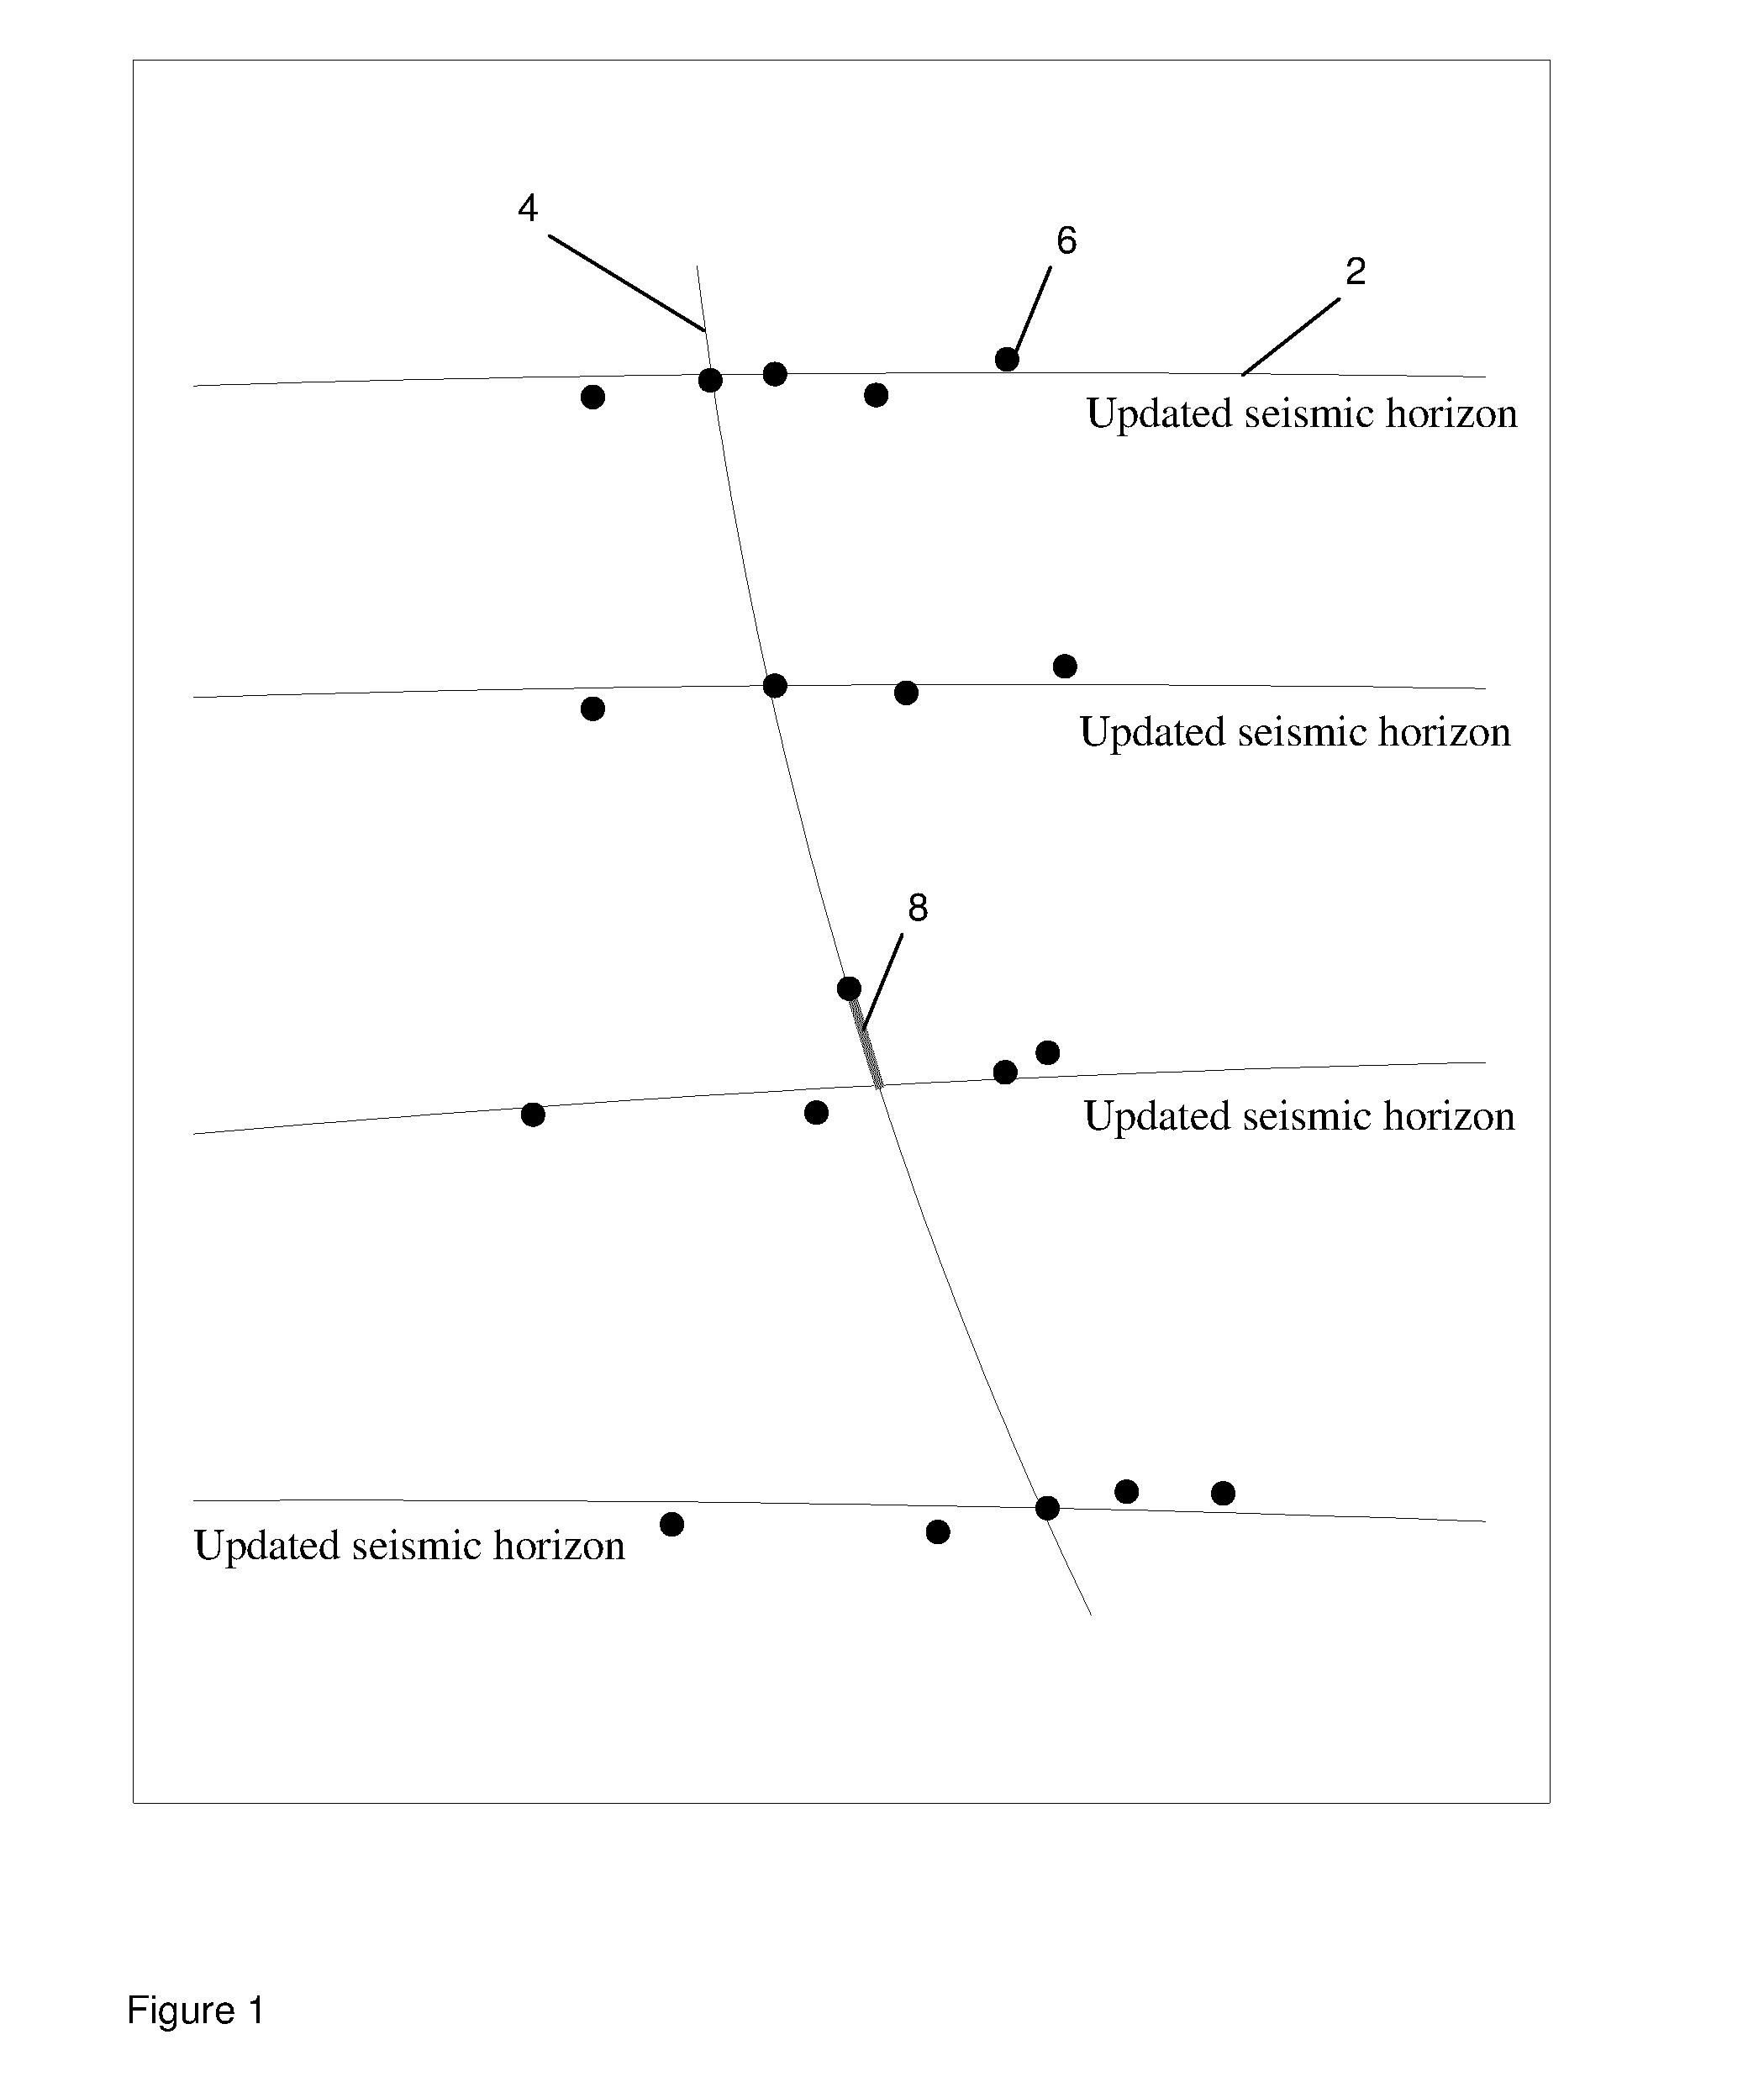
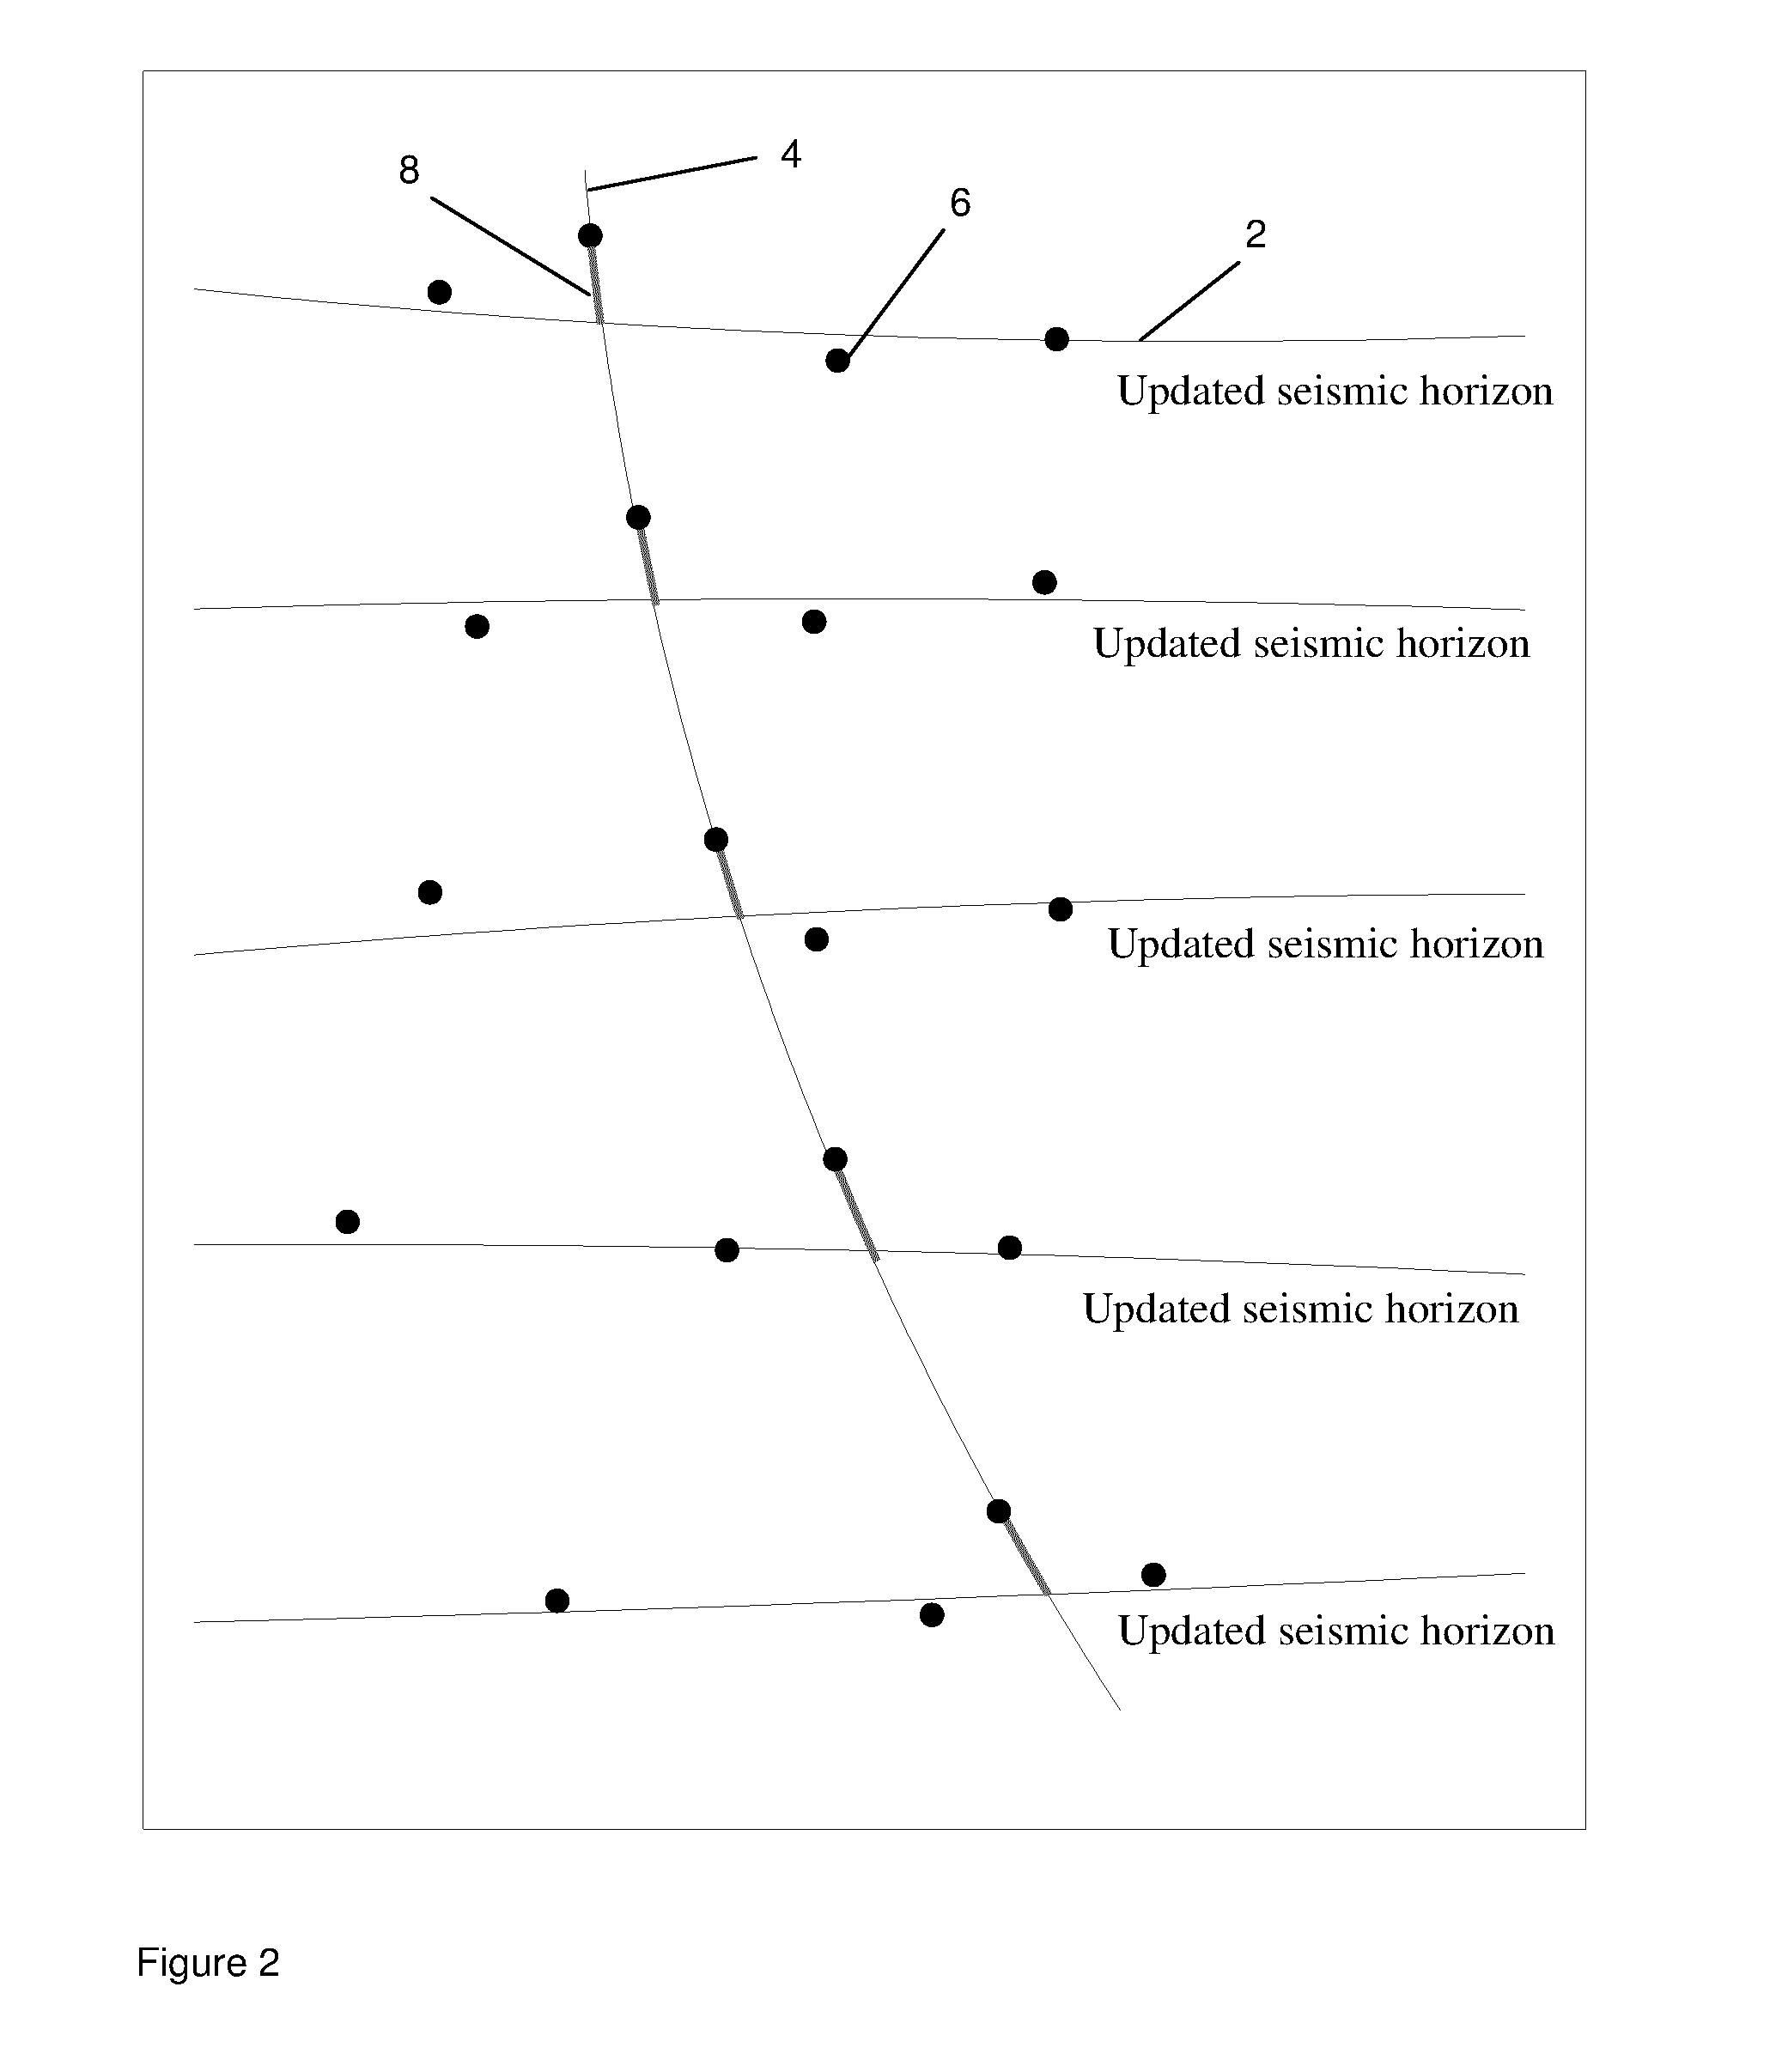
[0023]Our starting point is that we have a sub-surface model and a wellbore position model, which effectively represent two different models of reality, with the former being based for example on seismic data and the latter being based on positional data derived from a wellbore.

[0024]The method for QC evaluates the match between predefined test criteria and parameters calculated from observation data to decide whether geological common points are affected by gross errors. In this section the goal is to explain how the QC parameters are calculated, without using mathematical expressions. The methods for detection of gross errors presented here are based on utilizing outputs from an adjustment (e.g. least squares adjustment) of sub-surface and wellbore positional data. The outputs of interest are the updated positions of the subsurface and wellbore positional data and the corresponding covariance matrix (or variance matrix) which represents the quantified uncertainties of the updated ...


PUM


Abstract

There is provided a method of assessing the quality of subsurface position data and wellbore position data, comprising: providing a subsurface position model of a region of the earth including the subsurface position data, wherein each point in the subsurface position model has a quantified positional uncertainty represented through a probability distribution; providing a wellbore position model including the wellbore position data obtained from well-picks from wells in the region, each well-pick corresponding with a geological feature determined by a measurement taken in a well, wherein each point in the wellbore position model has a quantified positional uncertainty represented through a probability distribution; identifying common points, each of which comprises a point in the subsurface position model which corresponds to a well-pick of the wellbore position data; deriving for each common point a local test value representing positional uncertainty: selecting some but not all of the common points and deriving a test value from the local test values of the selected common points; providing a positional error test limit for the selected common points; and comparing the test value with the test limit to provide an assessment of data quality.

Description

FIELD OF THE INVENTION[0001]The invention relates to methods of assessing the quality of subsurface position data and wellbore position data.BACKGROUND OF THE INVENTION[0002]This document aims at highlighting the main differences between the methodology for data quality assurance presented in the patent application and existing technology implemented as a part of commercial software or published.[0003]In any problem where an unknown quantity is to be predicted with the help of known or measured other (explanatory) quantities, it is of crucial importance to pay particular attention to the calibration between the two sets of variables. In many cases, this calibration is achieved by statistical methods (e.g. least squares regression) with the help of a pool of experimental data (training set) where both predicted and explanatory variables are present. Ideally, data values from the training set should be dispersed enough and be related in a clear way along a functional relationship, so ...

Claims


Application Information

Patent Timeline
Patent Type & Authority Applications(United States)
IPC IPC(8): G06F17/50
CPCG06F17/5009G01V1/36G01V2200/14E21B47/00G01V11/00G01V2210/6169G06F30/20
Inventor NYRNES, ERIKSMISETH, JOBRUUN, BJORN TORSTEINNIVET, PHILIPPE
Owner DEN NORSKE STATS OLJESELSKAP AS
Why Eureka
Try Eureka