System, method and apparatus for computing, monitoring, measuring, optimizing and allocating power and energy for a rod pumping system

a technology of power and energy allocation and system, applied in the field of control of rod pumping systems, can solve the problems of inductive loads such as transformers and motors, and consuming both real power and reactive power, and the ideal operation of motor b>53/b> is usually never achieved

Pending Publication Date: 2014-11-20
LONG MEADOW TECH
View PDF4 Cites 20 Cited by
  • Summary
  • Abstract
  • Description
  • Claims
  • Application Information

AI Technical Summary

Benefits of technology

[0028]In one embodiment, a system for controlling a motor having a plurality of phases and a switch connected to a rod pumping system and to an electricity meter comprises a network server having a first processor and a first memory, an energy monitoring device having a second processor and a second memory connected to the network server, to the motor, and to the electricity meter the second processor programmed to execute a motor control process, a data acquisition process, and an alert generation process.

Problems solved by technology

Inductive loads such as transformers and motors consume reactive power with current waveform lagging the voltage.
Electrical loads consuming alternating current power that are not purely resistive consume both real power and reactive power.
However, such an ideal operation of motor 53 is usually never attained because of the elasticity of rod string 58 and the geometry of rod pumping system 51.
Most oil and gas production companies experience negative loads, and consequently low power factors, caused by induction motors powering rod pumping systems.
It has been estimated that a lagging power factor, mostly caused by the induction motor, is responsible for as much as one-fifth of all grid losses in the United States, equivalent to 1.5% of total national power generation and costs on the order of $2 billion per year.
Further, heating from high current flow causes transformers on both sides of electricity meters to fail.
Further, rod pumping system 51 does not produce identical surface dynagraph cards throughout the day.
As a result, the method of the prior art is unreliable and inaccurate to measure and calculate the power and energy consumption, and power factor of for rod pumping system 51 for well 67.
The prior art has attempted to address these problems, with limited success.
However, the methods in Opal do not control the motor voltage by calculating a predicted RPM of the motor.
Further, the methods do not correct a power factor of the motor or allocate energy consumption or energy generation among a plurality of rod pumping systems or determine electrical motor loading by calculating the RMS current on all three phases on a per stroke basis of the pumping unit and comparing the RMS current on all three phases to the full load current rating of the motor.
However, the determination of failure conditions in Turner is not useful in managing the energy consumption of the motor or the energy generation of the motor by controlling the motor voltage.
However, the Kueck method requires the use of an equivalent circuit that requires manual confirmation to evaluate the performance of the motor and thereby leads to a time consuming and costly method.
Further, the method and apparatus in Kueck only detects and calculates deficient motor operating characteristics and provides no means for correcting such deficient motor operating characteristics.
However, the generated surface cards and downhole cards are inconsistent over time and thereby are prone to providing unreliable and inaccurate energy consumption data.
The prior art fails to disclose or suggest an apparatus and methods for accurately controlling a motor of a rod pumping system by measuring the current and voltage of the motor on a per stroke basis.

Method used


Image

  • System, method and apparatus for computing, monitoring, measuring, optimizing and allocating power and energy for a rod pumping system
  • System, method and apparatus for computing, monitoring, measuring, optimizing and allocating power and energy for a rod pumping system
  • System, method and apparatus for computing, monitoring, measuring, optimizing and allocating power and energy for a rod pumping system

Examples


example 1

[0120]The following is an example of motor control process 700. In this example, the motor is rotating with the voltage supply to the motor applied at an RPM less than a synchronous speed of 1,200 RPM. A determination must be made whether or not the motor will be running faster than the synchronous speed at the next detected revolution before the next detected revolution occurs.

[0121]Let the time increments, in seconds, and corresponding RPMs be defined by:[0122]x0=0, x1=0.050675, x2=0.101181, and x3=0.151432, y1=1184, y2=1188, and y3=1194.

[0123]Thus,

P(x)=1182.03+18.612x+398.982x2,[26]Px=18.612+797.965x,and[27]2Px2=797.965.[28]

[0124]Therefore, at x3:

Pxx3>0and2Px2x3>0.[29]

[0125]Since

y3=1194and2Px2x3>0,usePxx3

to determine what the motor RPM will be when the motor completes its next revolution. Thus,

(x-x3)2Pxx3+(x-x3)P(x3)-60=0[30]

is solved to obtain

{tilde over (x)}=0.201392.

[0126]This implies that Δ{tilde over (x)}=0.04996. Therefore, the predicted RPM is {tilde over (y)}=1200.97. Sin...

example 2

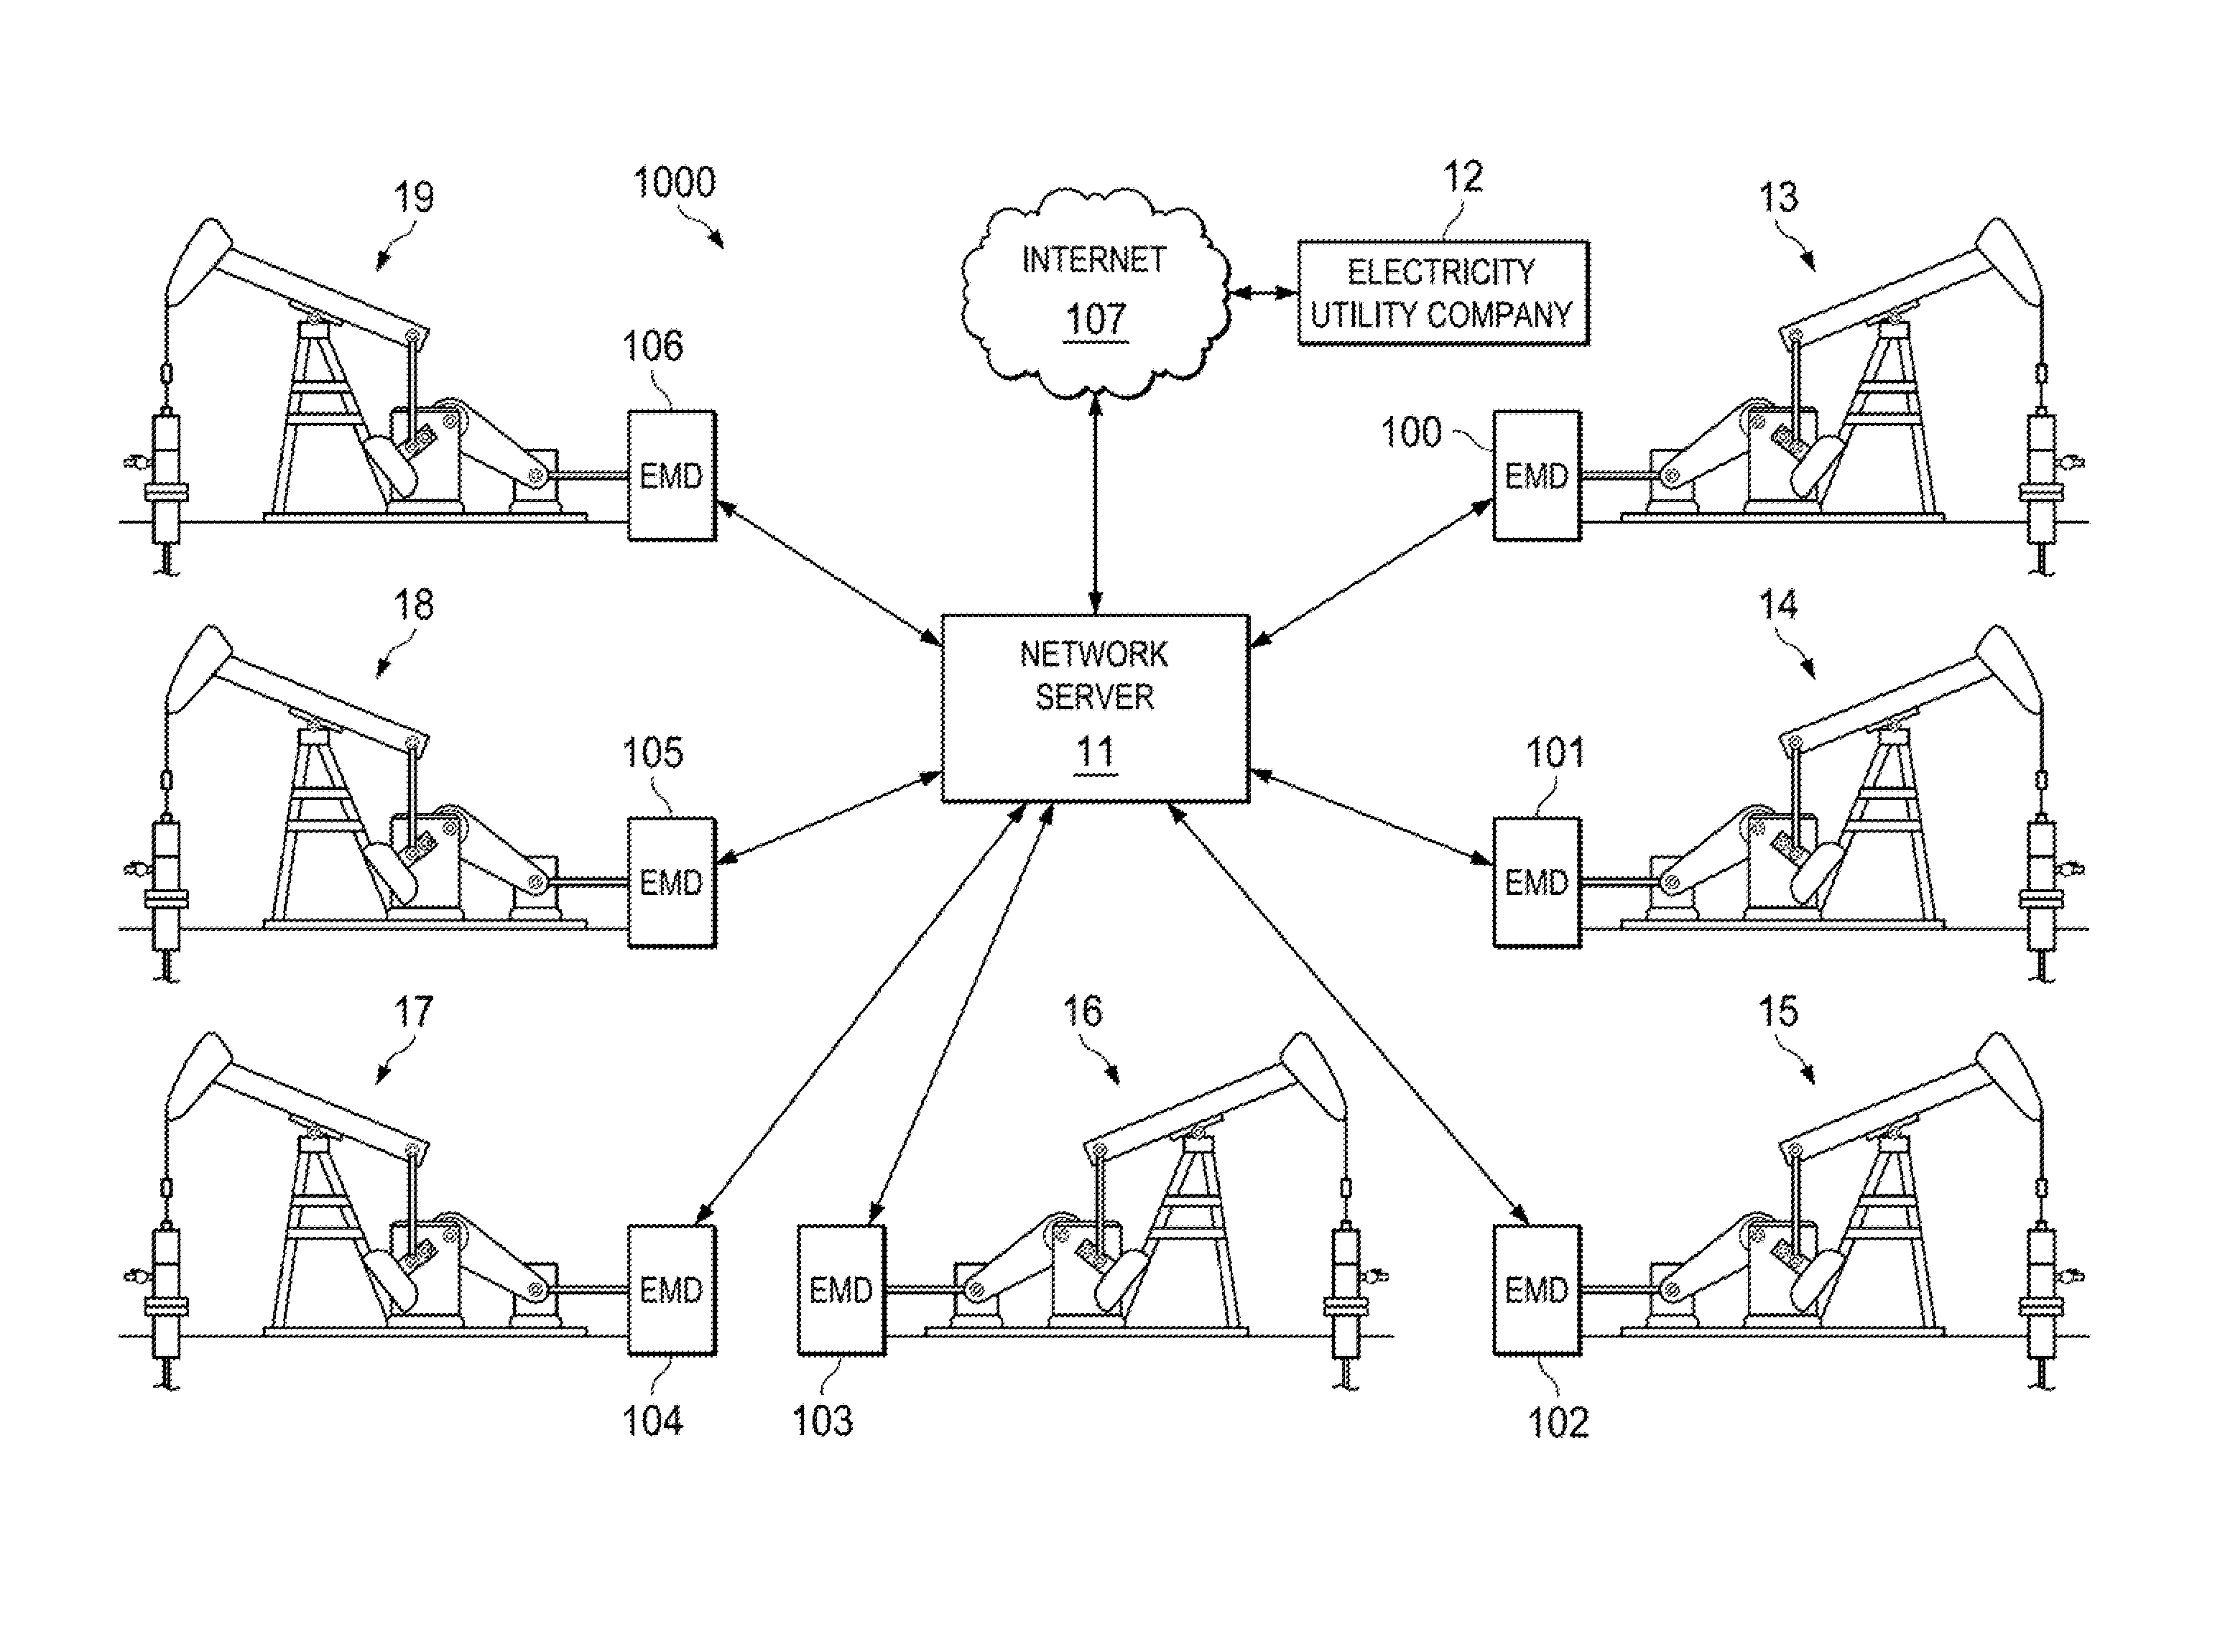
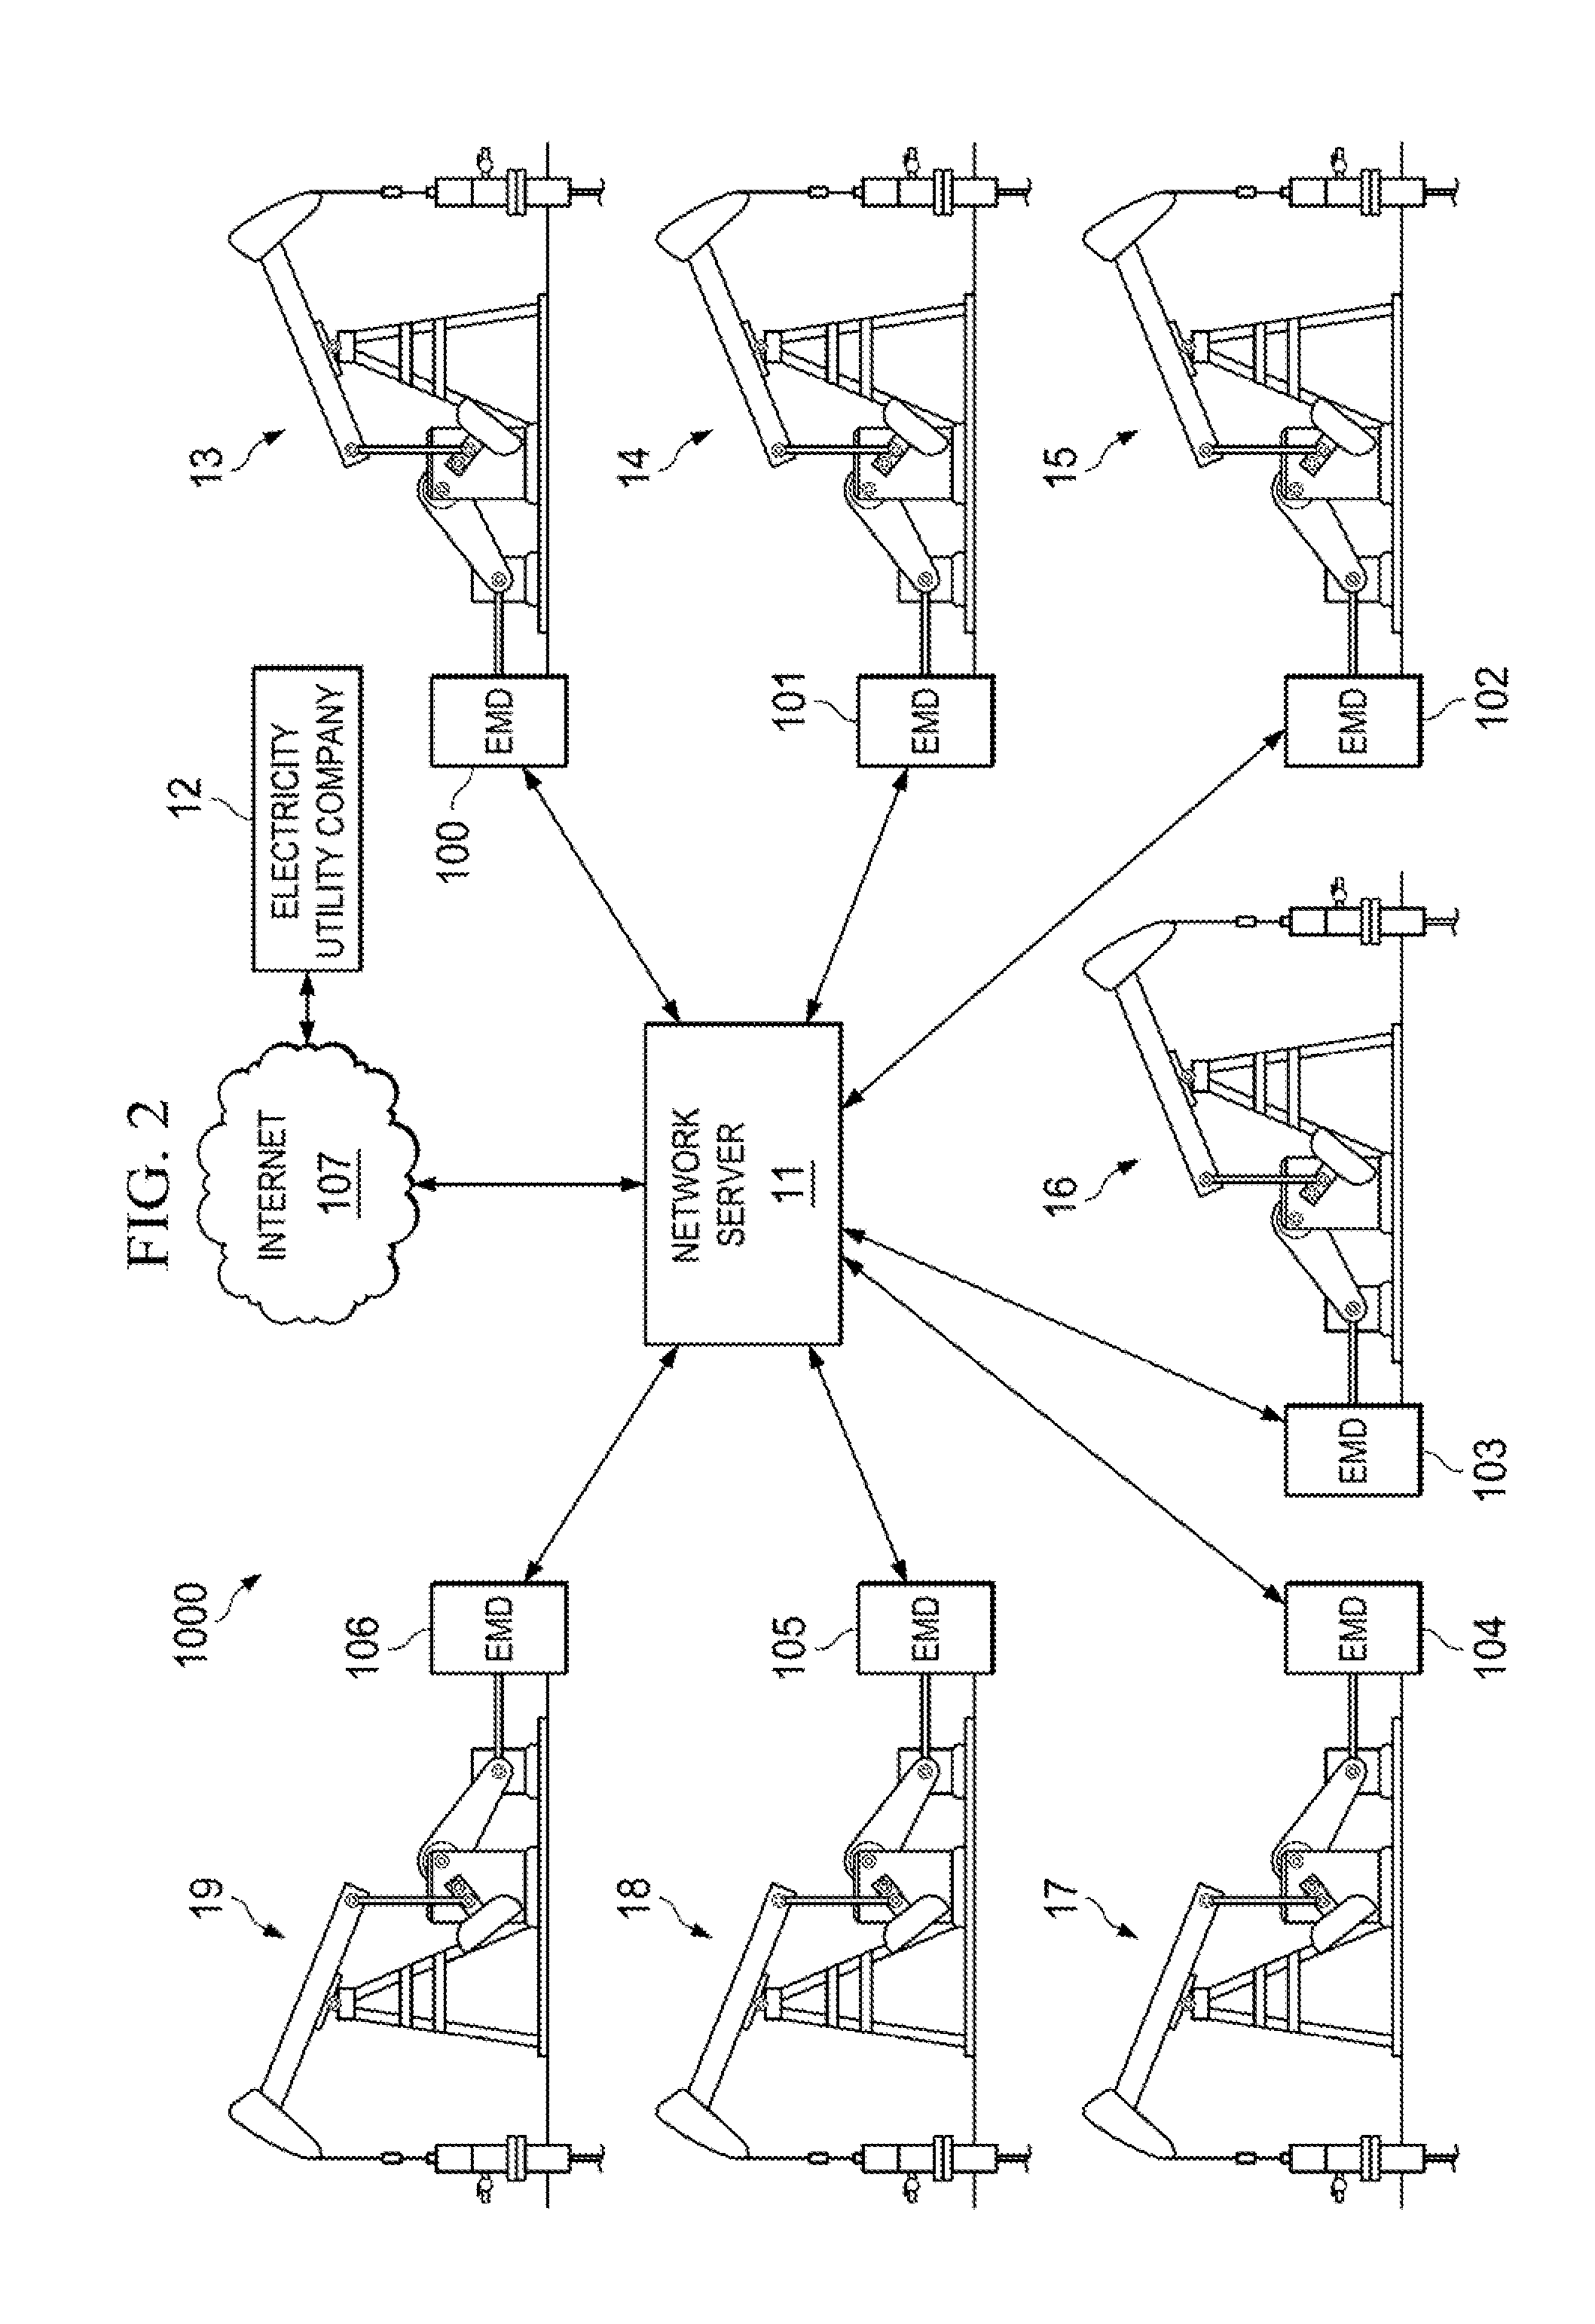
[0143]As an example of data acquisition process 1001 of FIGS. 10A and 10B, well A, well B, and well C are connected to a single electricity meter that measures the energy consumed for wells A, B, and C. For a period of time, the electricity meter reading is determined to be 14379.52 kWh in step 1003. In step 1006, the amount of energy consumed for per well is measured: 5000 kWh for well A, 6400 kWh for well B, and 4200 kWh for well C. In step 1007, the amount of energy generated per well is measured: 1200 kWh for well A, 200 kWh for well B, and 200 kWh for well C. In step 1009, the total amount of energy consumed of 15600 kWh for wells A, B, and C is calculated. In step 1010, the total amount of energy generated of 1600 kWh for wells A, B, and C is calculated. In step 1011, the net energy for each of the set of wells is calculated: 3800 kWh for well A, 6200 kWh for well B, and 4000 kWh for well C. In step 1012, the total net energy across the set of wells is calculated as 14000 kWh....

example 3

[0144]In another useful example, the report generated in step 1016 and shown in Table 1 can be used to negotiate a lower electricity bill. Typically, electricity utility companies set electricity price rates throughout a day by a statistical demand curve with higher demand in the middle of the day and lower demand at night. Thus, the statistical curve results in higher electricity rates in the middle of the day and lower electricity rates at night. A customer of an electricity utility company operating a set of wells can use the data from the report in Table 1 to show the electricity utility company that the demand of the set of wells does not follow the statistical demand curve and can negotiate a lower price resulting in a lower electricity bill and thereby a savings in operating costs to the customer.

[0145]Referring to FIG. 11A, alert generation process 1100 is described. Energy monitoring device 100 constantly measures data in step 1101. For example, the measurements include, bu...


PUM


Abstract

A system and method for correcting energy consumption for a set of loads in an oil and gas field lease includes a network, a network server connected to the network, a set of energy monitoring devices connected to the network, the set of loads connected to the set of energy monitoring devices, an electricity meter connected to the set of loads and the set of energy monitoring devices, a power supply connected to the electricity meter, and an electricity utility company connected to the network and to the power supply. The method includes the steps of receiving an electricity meter reading, receiving an amount of energy consumed by each load, receiving an amount of energy generated by each load, and determining a correct net energy consumption for each load of the set of loads from the electricity meter reading, the amount of energy consumed, and the amount of energy generated.

Description

CROSS REFERENCE TO RELATED APPLICATION[0001]This application is a continuation in part of U.S. application Ser. No. 13 / 601,830 filed on Aug. 31, 2012, which claims priority to U.S. Provisional Application No. 61 / 529,432 filed on Aug. 31, 2011. Each of the patent applications identified above is incorporated herein by reference in its entirety to provide continuity of disclosure.FIELD OF THE INVENTION[0002]The field of the invention relates to the control of rod pumping systems for oil and gas wells. In particular, the field of the invention relates to a system and method for computing, monitoring, measuring, optimizing, controlling and allocating power and energy for a rod pumping system.BACKGROUND OF THE INVENTION[0003]As energy costs rise, energy companies are increasingly concerned with optimizing their pumping unit systems, including reducing the amount of energy that a rod pumping system requires to operate and properly allocating costs between various wells. Referring to FIG. ...

Claims


Application Information

Patent Timeline
Patent Type & Authority Applications(United States)
IPC IPC(8): G06F1/28G06Q50/06
CPCG06Q50/06G06F1/28E21B43/127G01R22/10H02P25/024E21B47/009
Inventor DACUNHA, JEFFREY J.MYERS, RICHARD M.
Owner LONG MEADOW TECH
Why Eureka
Try Eureka