Multiple biomarker panels to stratify disease severity and monitor treatment of depression
a biomarker and disease technology, applied in the field of material and method for stratifying disease severity and monitoring the effectiveness of treatment in a subject, can solve the problems of difficult diagnosis and treatment, subjective methods, and often unreliable methods, and achieve the effect of accurately stratifying disease severity and monitoring patient respons
- Summary
- Abstract
- Description
- Claims
- Application Information
AI Technical Summary
Benefits of technology
Problems solved by technology
Method used
Image
Examples
example 1
Identification of Pharmacodynamic Biomarkers Associated with MDD
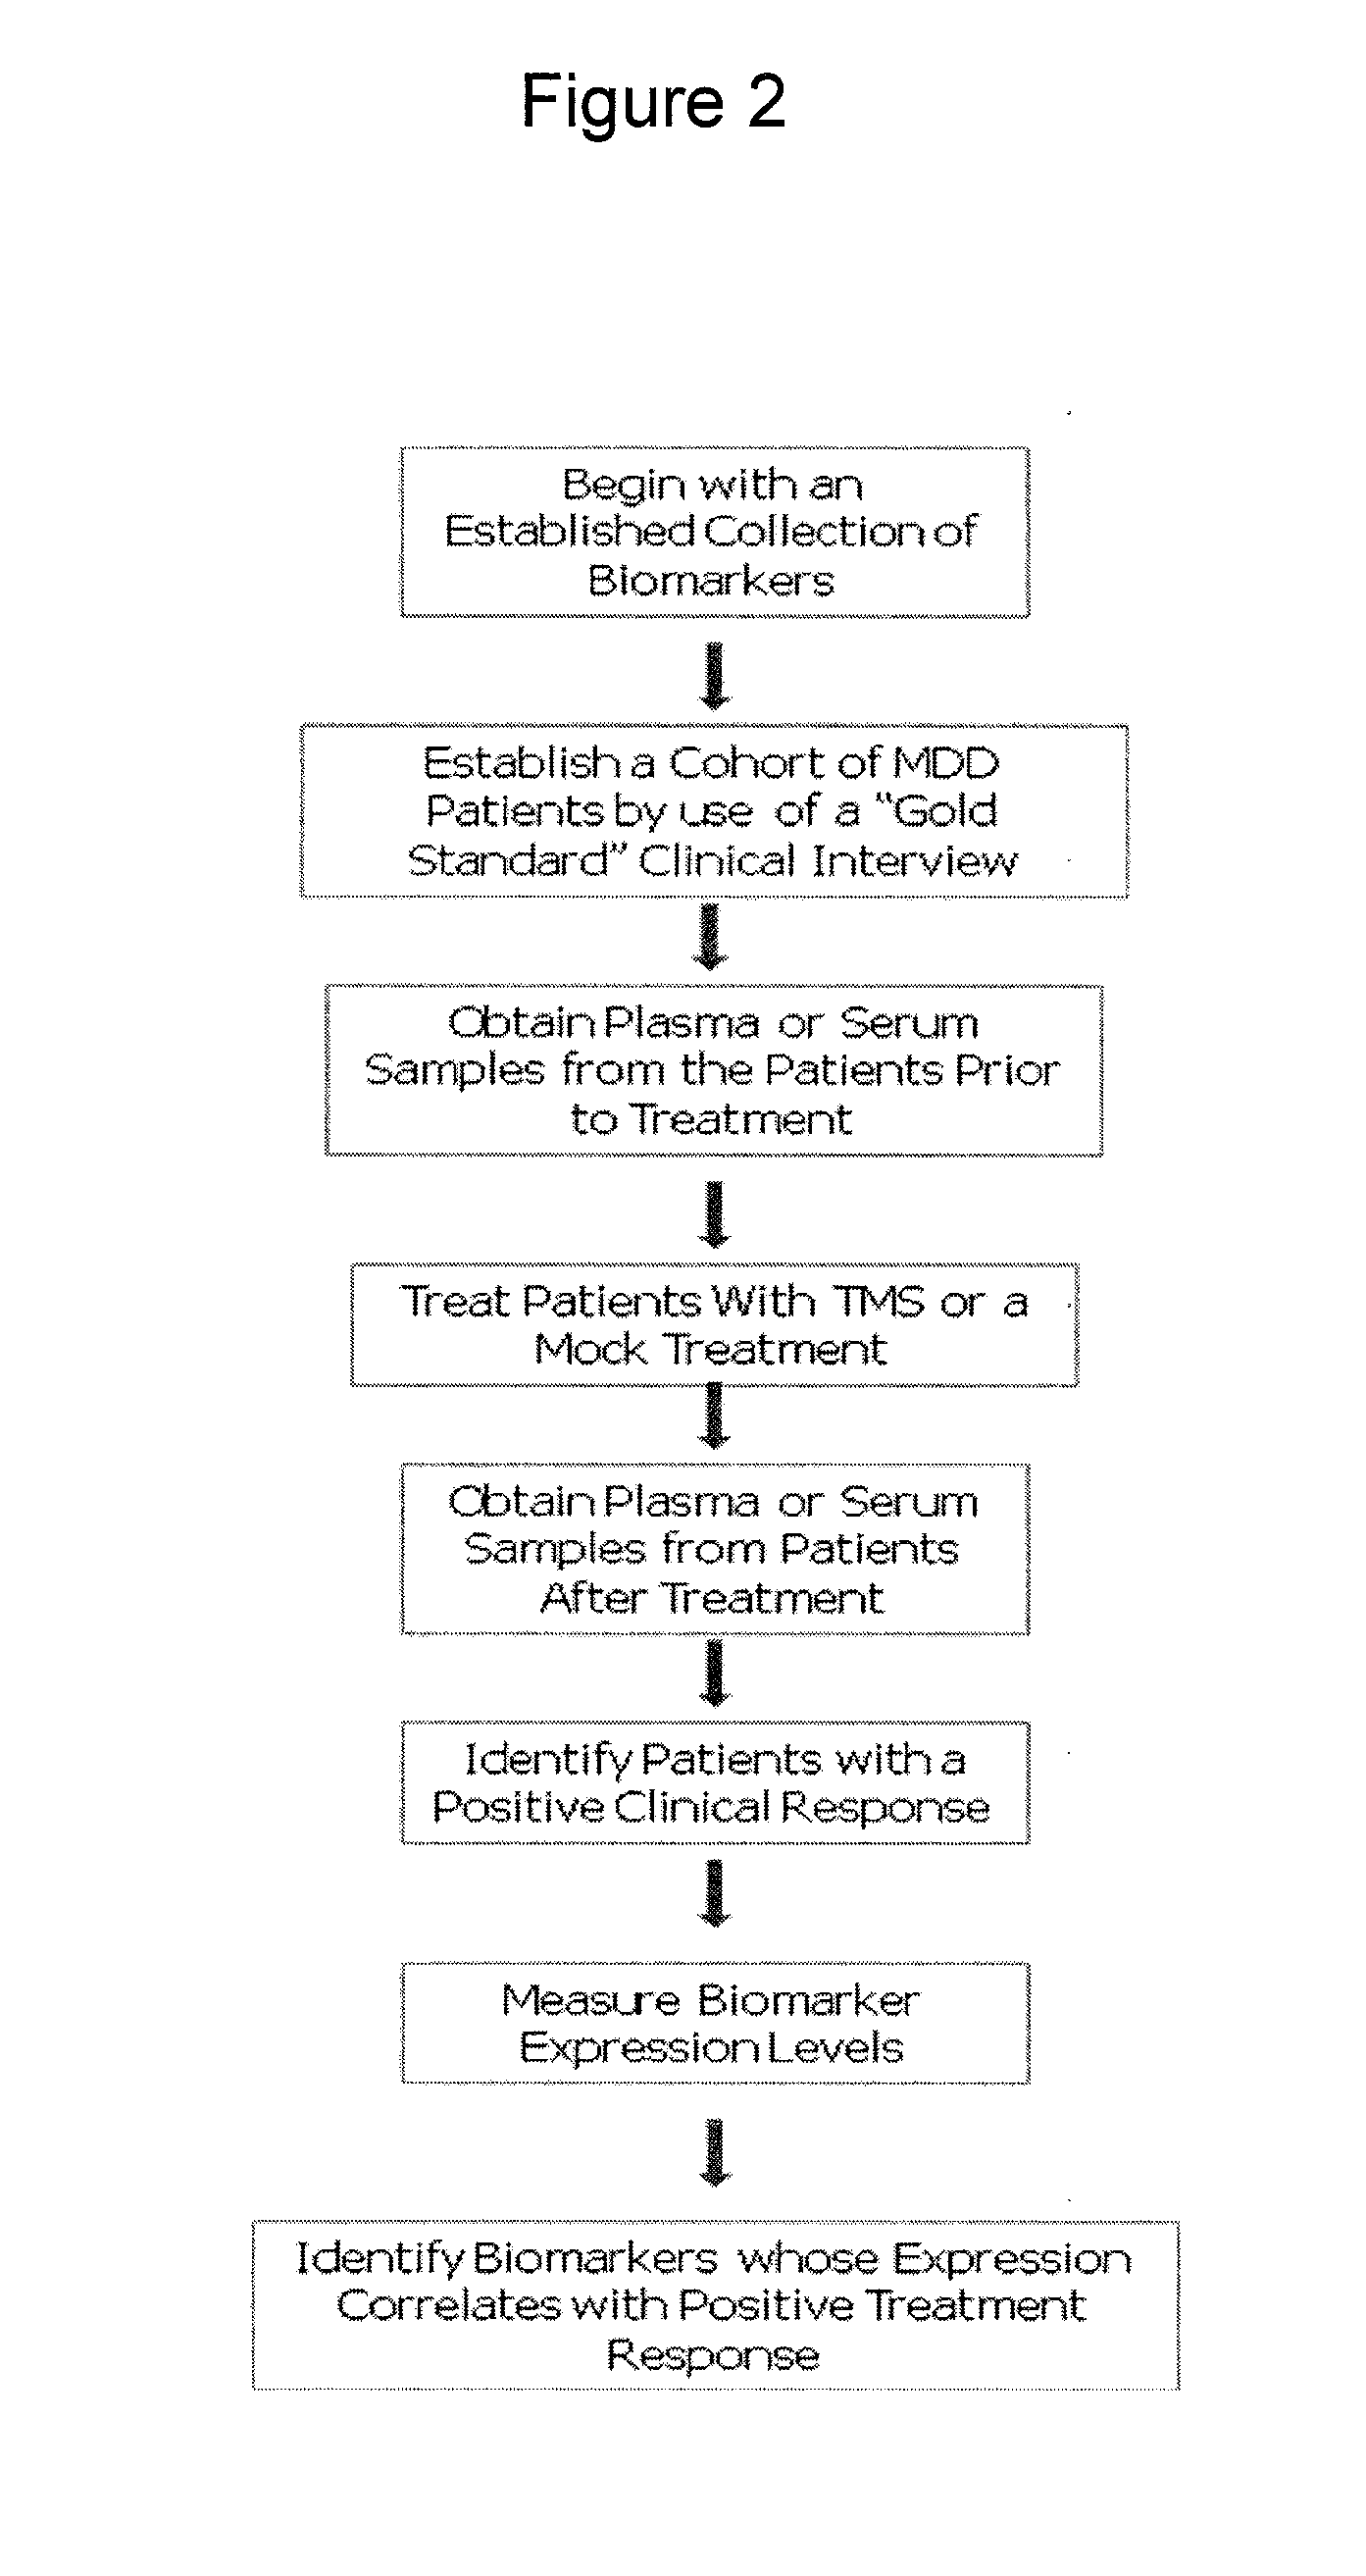
[0138]FIG. 2 illustrates a process of identifying pharmacodynamic biomarkers for MDD. A collection of biomarkers that have a potential association with MDD is selected based on the result of earlier studies, from a literature search, from genomic or proteomic analysis of biological pathways, or from molecular imaging studies. A cohort of MDD patients are identified using a “gold standard” method of interview-based clinical assessment. Plasma or serum samples are collected from each patient. Patients are then subjected to TMS or VNS stimulation or mock stimulation (placebo). Post-treatment plasma or serum samples are collected from each patient over a period of time (e.g., minutes, hours, days, and / or weeks after treatment). Expression levels of the selected biomarkers are measured for each sample. The patient's response to treatment, as determined by conducting additional structured clinical interviews and assigning pos...
example 2
Using Proteomics to Analyze Multiple Biomarkers
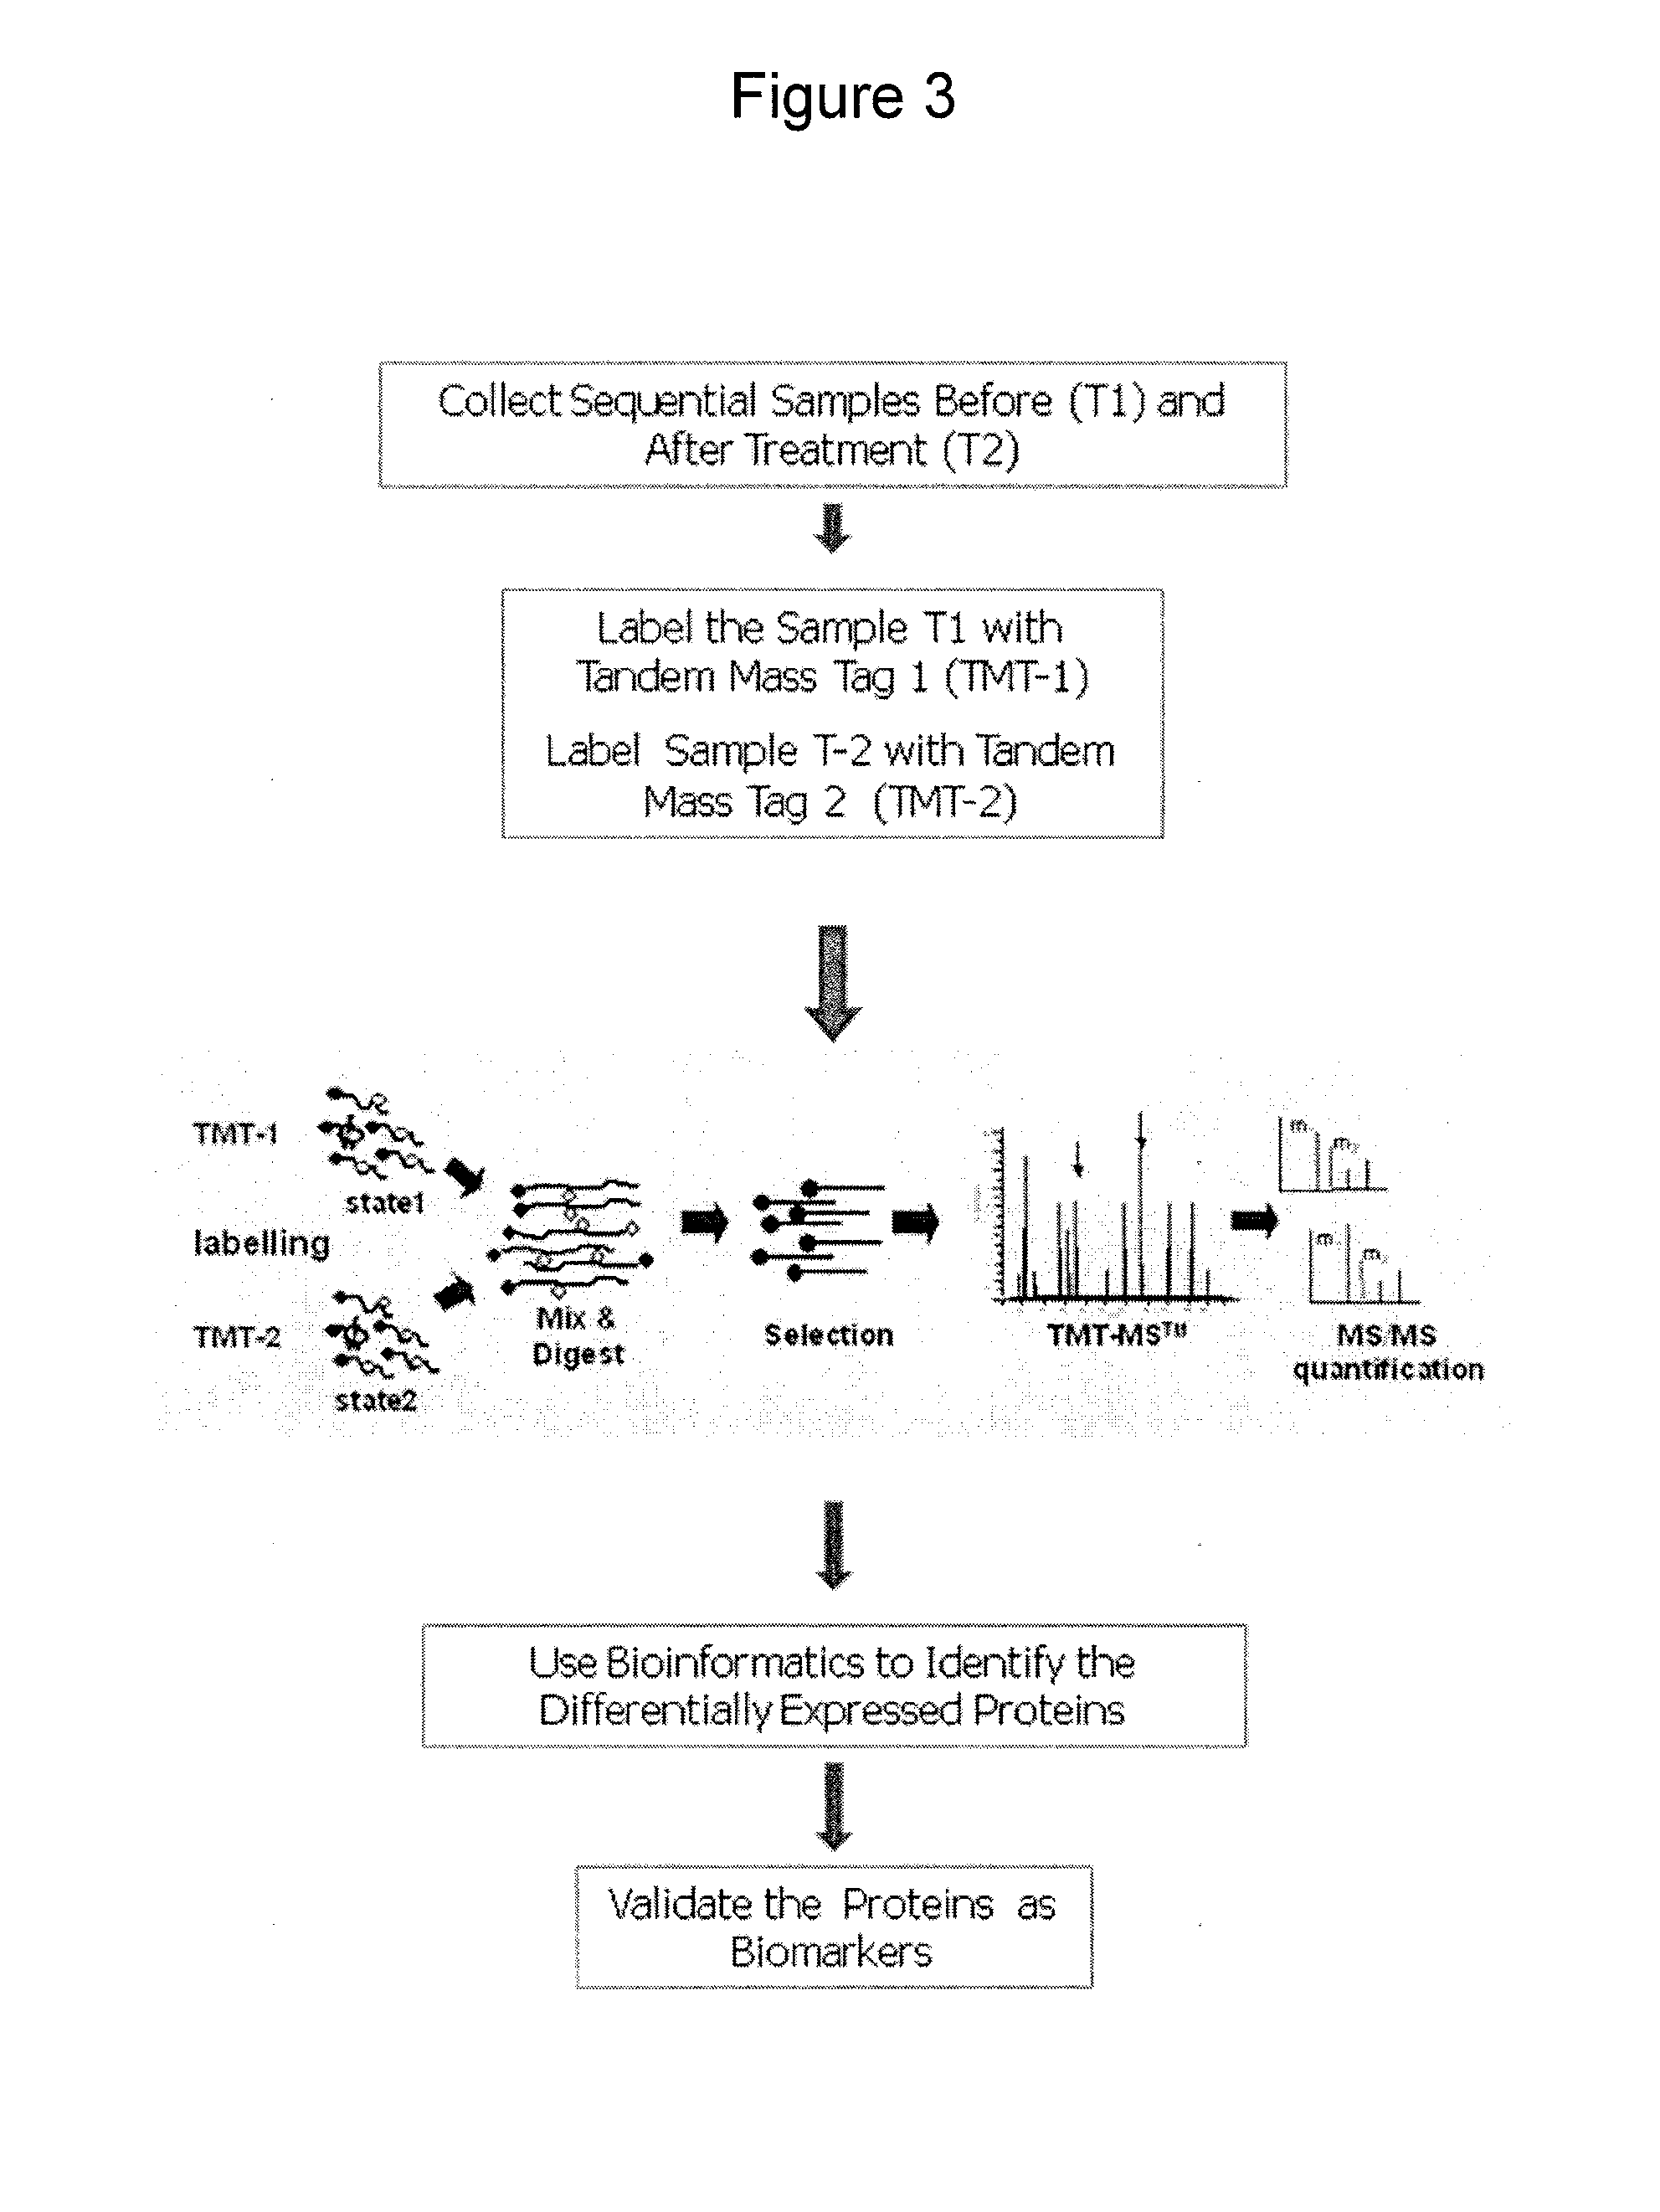
[0140]As shown in FIG. 3, treatment-relevant biomarkers are identified using tandem mass spectrometry. Biological samples are collected pre- and post-treatment. The samples are labeled with different Tandem Mass Tags (TMT) and mixed for TMT-MS™ (Proteome Sciences, United Kingdom). Following fragmentation / digestion with a suitable enzyme (e.g., trypsin), TMT labeled fragments are selected for analysis by liquid chromatography MS / MS. The ratio of protein expression between samples is revealed by MS / MS by comparing the intensities of the individual reporter group signals. Bioinformatic analysis is used to determine the proteins that are differentially expressed. The identified proteins are then validated as potential biomarkers (e.g., using specific antibodies, and ELISA) over a defined period of time after treatment to establish a subset of pharmacodynamic biomarkers. Statistical analysis of a subject's changes in analyte expression level...
example 3
Using MDDSCORE™ and HAM-D Scores to Monitor Treatment
[0141]An example of how MDDSCORE™ and HAM-D Scores can be used to monitor treatment-induced changes is shown in FIG. 4. The Hamilton Rating Scale for Depression (HAM-D) is a multiple choice questionnaire that clinicians often use to rate the severity of a patient's major depression. A HAM-D score greater than 18 was used as a cut off for MDD patients, based upon findings that trials initiated with higher mean baseline HAM-D scores were associated with greater reductions in HAM-D scores (a lower score indicates a reduction in severity) at the end of a 4- to 8-week trial than trials with a lower mean baseline HAM-D. In this example, Korean normal subjects (n=8, open circles in FIG. 4) and MDD patients who were drug naïve (n=8, filled circles) were evaluated by HAM-D at baseline only or baseline and after two weeks of treatment with LEXAPRO™ (open squares) respectively. Clinical results were obtained from serum samples from each of t...
PUM
 Abstract
Description
Claims
Application Information
 - R&D
- Intellectual Property
- Life Sciences
- Materials
- Tech Scout
- Unparalleled Data Quality
- Higher Quality Content
- 60% Fewer Hallucinations
Browse by: Latest US Patents, China's latest patents, Technical Efficacy Thesaurus, Application Domain, Technology Topic, Popular Technical Reports.
© 2025 PatSnap. All rights reserved.Legal|Privacy policy|Modern Slavery Act Transparency Statement|Sitemap|About US| Contact US: help@patsnap.com


