

Methods for Classifying Samples Based on Network Modularity
a network modularity and sample technology, applied in the field of samples classification, can solve the problems of poor prognosis of breast cancer, and achieve the effect of modifying the network modularity of the interactom
- Summary
- Abstract
- Description
- Claims
- Application Information
AI Technical Summary
Benefits of technology
Problems solved by technology
Method used
Image

Examples
example 1
[0131]The following materials and methods were used in the study described in the Examples.
[0132]Data Integration to Determine PCC of Co-Expression in Interaction Networks
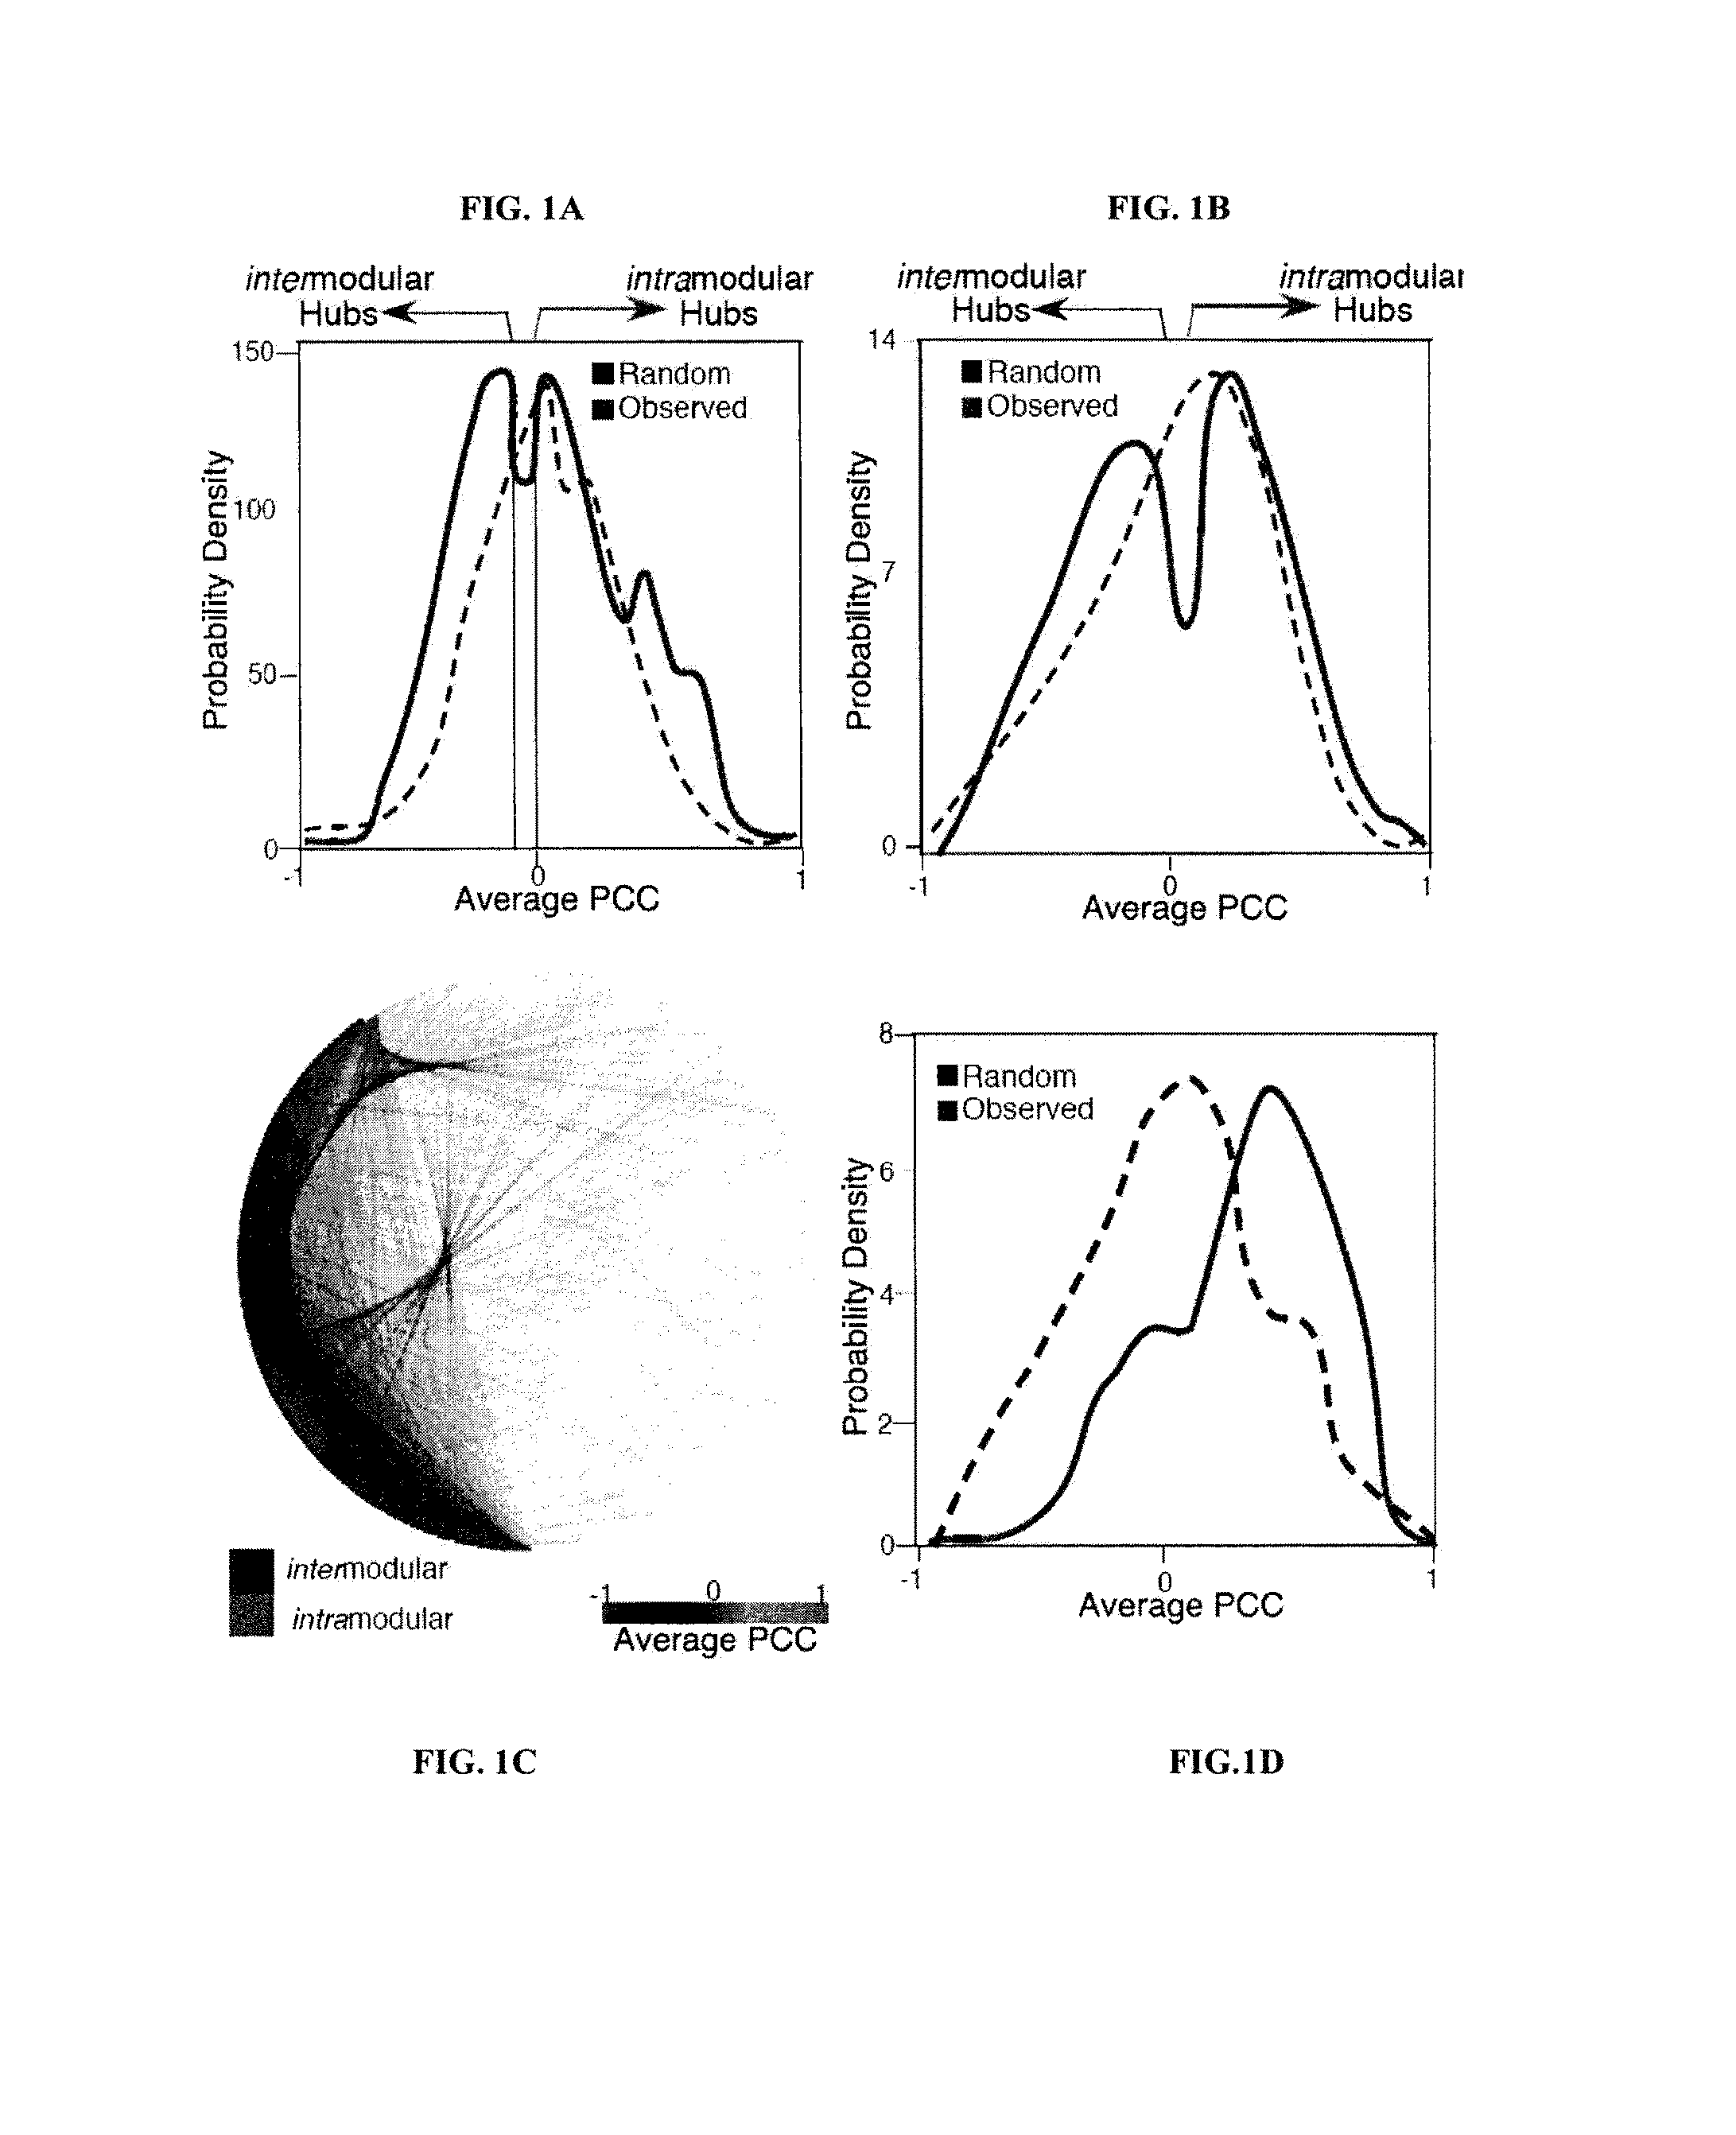
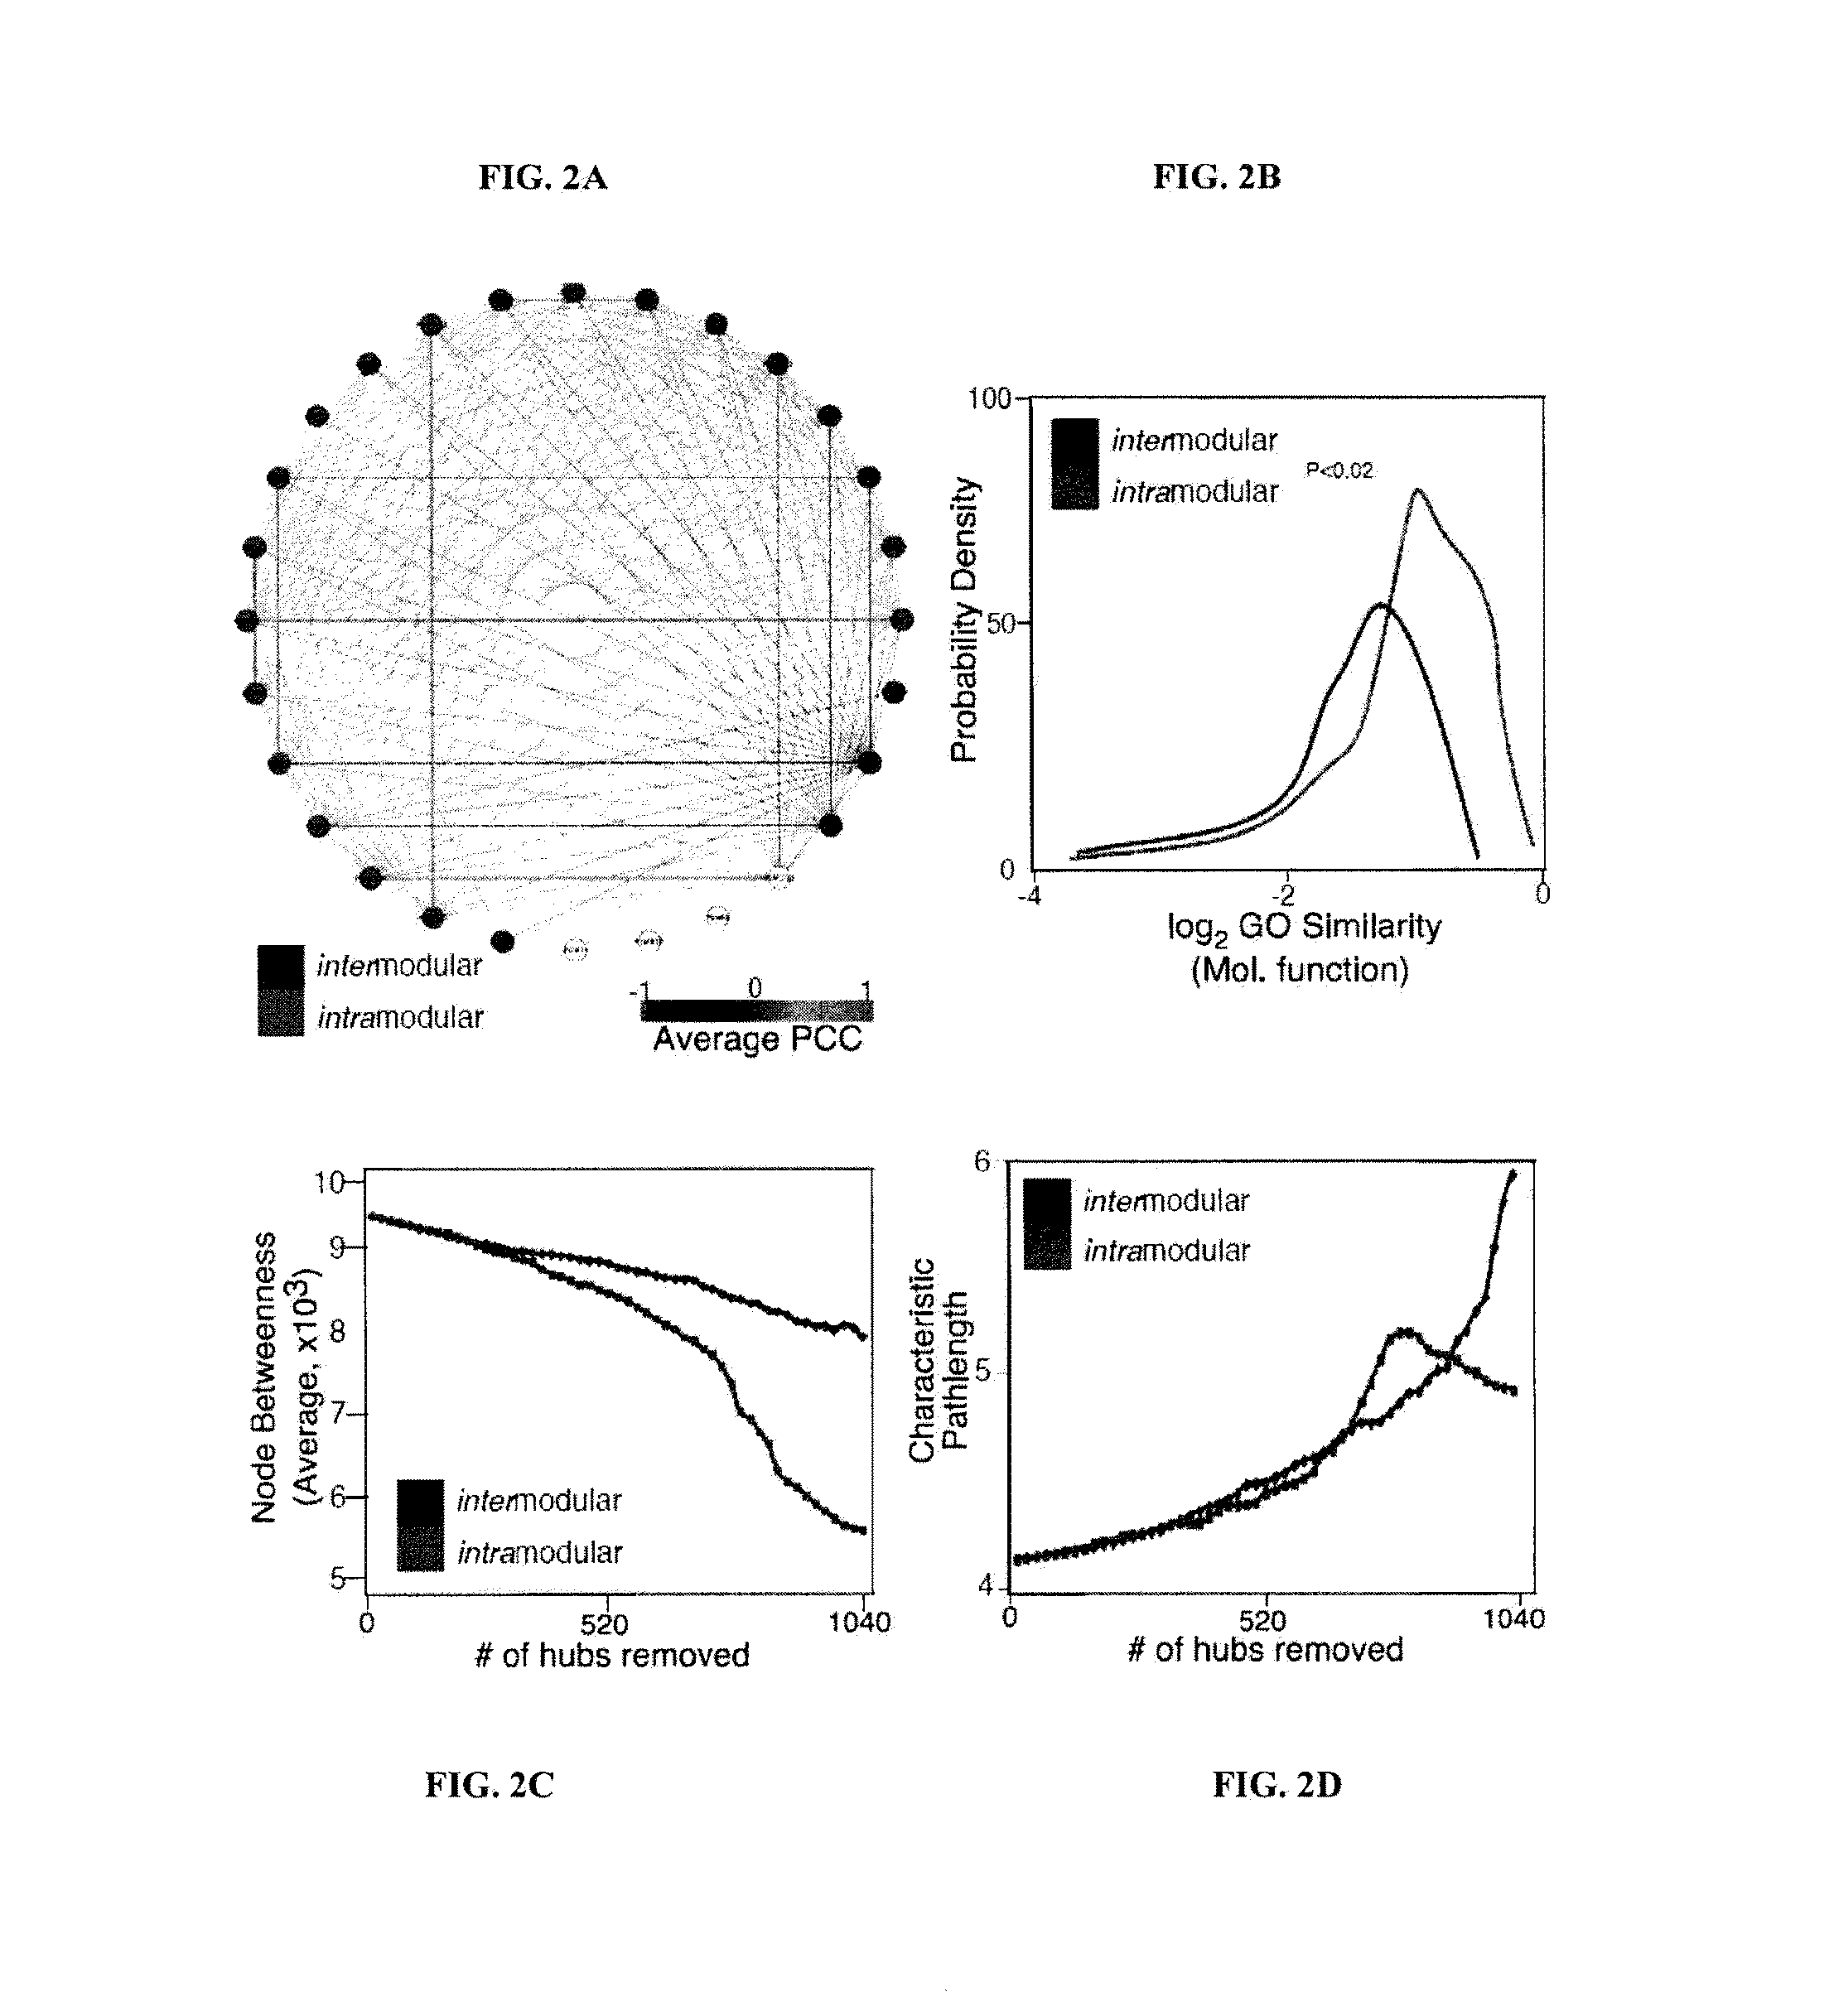
[0133]A method analogous to that previously described was used13. The complete interactome from OPHID9 as well as subsets of interactions interologue mapped from yeast to man41 or just literature curated interactions11 was downloaded as well as expression data from 79 human tissues8. Hubs were selected as those with greater than 5 interactions, as these proteins are in the top 15% of the degree distribution of the network. For each hub the average PCC of co-expression for each interaction and the hub was assessed using a similar algorithm as previously described13. Random re-assignment of the expression values to nodes in the network was used to ascertain if the observed network was nonrandom. The network was visualized using Cytoscape 2.5.142.
[0134]GO Functional Similarity of Hubs and their Interactors
[0135]Semant...
example 2
[0188]A study has been conducted utilizing the fractal nature of the human protein-protein interaction network. Previous examinations of real world networks revealed that many complex networks display fractal behavior. The networks are self similar regardless of scale. To determine if the human protein-protein interaction network is indeed fractal, published methods47 were applied.
[0189]The 3 conditions that are required to be satisfied to define a fractal network were met with the human protein-protein interaction network identified in Example 1. Those conditions are:
[0190](1) The number of boxes needed to cover the original, the skeleton, and the Random Spanning Tree (RST)), exhibit power law relationship to the size of the box. A skeleton network is a network that has been trimmed of many vertices but retains the vertices of the nodes with the highest betweenness centrality. A random spanning tree (RST) is also a network trimmed of many vertices but unlike the skeleton no choice ...
example 3
[0196]An example of computer code useful to implement the methods described herein is reproduced below:
npHubTestfunction hubsGreater = npHubTest(data,labels,intmatrix,minHub);npHubTest - finds significant hubs using non-parametric test HUBSGREATER = findSigHubs(DATA, LABELS, INTMATRIX, MINHUB)Input Arguments: - DATA: A N × P matrix where N is the number of genes and P is the number of patients / observations - LABELS: A binary vector (0's and 1's) denoting group separations. - INTMATRIX: A binary matrix (assumed sparse) denoting which gene pairs have known interactions between them. - MINHUB: The minimum degree f or something to be considered a hub Output Arguments: - HUBSGREATER: A binary vector denoting which hubs had cons within group were greater on this run than the random groupNOTE: This should generally only be called from findSigHubs.randlabels = labels(randperm(length(labels)));hubsGreater = zeros(1, size(data,1));Indices of “hubs”idx = find(sum(intmatrix) >= minHub);...
PUM
 Abstract
Description
Claims
Application Information