
Method for measuring a biological value of a liver

a biological value and liver technology, applied in the field of liver biological value measurement, can solve the problems of fatty liver disease, nash and fibrosis, currently impossible to identify at an early stage patient, etc., and achieve the effect of quick and reliable diagnosis

Inactive Publication Date: 2016-11-24
INST NAT DE LA SANTE & DE LA RECHERCHE MEDICALE (INSERM) +2
View PDF2 Cites 0 Cited by
  • Summary
  • Abstract
  • Description
  • Claims
  • Application Information

AI Technical Summary

Benefits of technology

The present invention provides a method to quantitatively and objectively evaluate the biological value of a liver through the use of infrared radiation. This allows for a quick and reliable diagnosis of the liver, particularly its ability to be grafted. The method is rapid, with measurements taking less than 15 min compared to traditional methods that could last two days. The apparatus is easy to produce and less expensive as it uses only specific infrared wave numbers. Additionally, if an interferometer is used, only a small interferometer is needed. Overall, the invention provides a more efficient and reliable way to assess the biological value of a liver.

Problems solved by technology

Fatty liver disease is also a potential long-term complication of liver transplantation.
The mechanisms responsible for the evolution from steatosis to steatohepatitis are not fully understood yet preventing to predict prognosis of the disease at an individual level.
Despite the major public health concern of NAFLD, it is currently impossible to identify at an early stage patient that will progress to NASH and fibrosis from patient that will remain at the steatosis stage.
Quantifying the level of steatosis is also a major issue in liver transplantation (LT).
Indeed, there are a significant number of cases of liver transplantation leading to primary non-function or delayed function of the graft mainly due to the poor quality of the graft and especially the presence of steatosis.
Although steatosis can regress within weeks after liver transplantation, early functional recovery and regenerative capacity are significantly impaired with steatotic allografts, mostly because of more severe ischemia-reperfusion injury.
Steatosis of the graft is not only a cause of primary graft dysfunction but also a source of long-term poorer evolution of the graft.
The issue is that there is no objective and quantifiable marker for graft quality control.
Quantifying steatosis is all more important since a major limitation of liver transplantation is the shortage of grafts.
The use of grafts with moderate steatosis (30%-60%) remains a challenging issue.
The lack of grafts has also lead to use organs obtained on non-heart-beating donors who have just deceased.
This drastic recommendation contrasts with the incapacity of usual histological methods to rigorously provide a non-biased assessment of steatosis.
(2009) have shown that this evaluation is highly dependent on the physician interpretation and therefore subjective.
Furthermore, this qualitative approach is not adapted in case of microsteatosis because of the extremely small size of vacuoles that make them difficult to detect by physician.
This method is lengthy since it takes about two days.

Method used


Image

  • Method for measuring a biological value of a liver
  • Method for measuring a biological value of a liver
  • Method for measuring a biological value of a liver

Examples


example 1

Histological Estimation of Liver Steatosis is Poorly Correlated to the Lipid Content

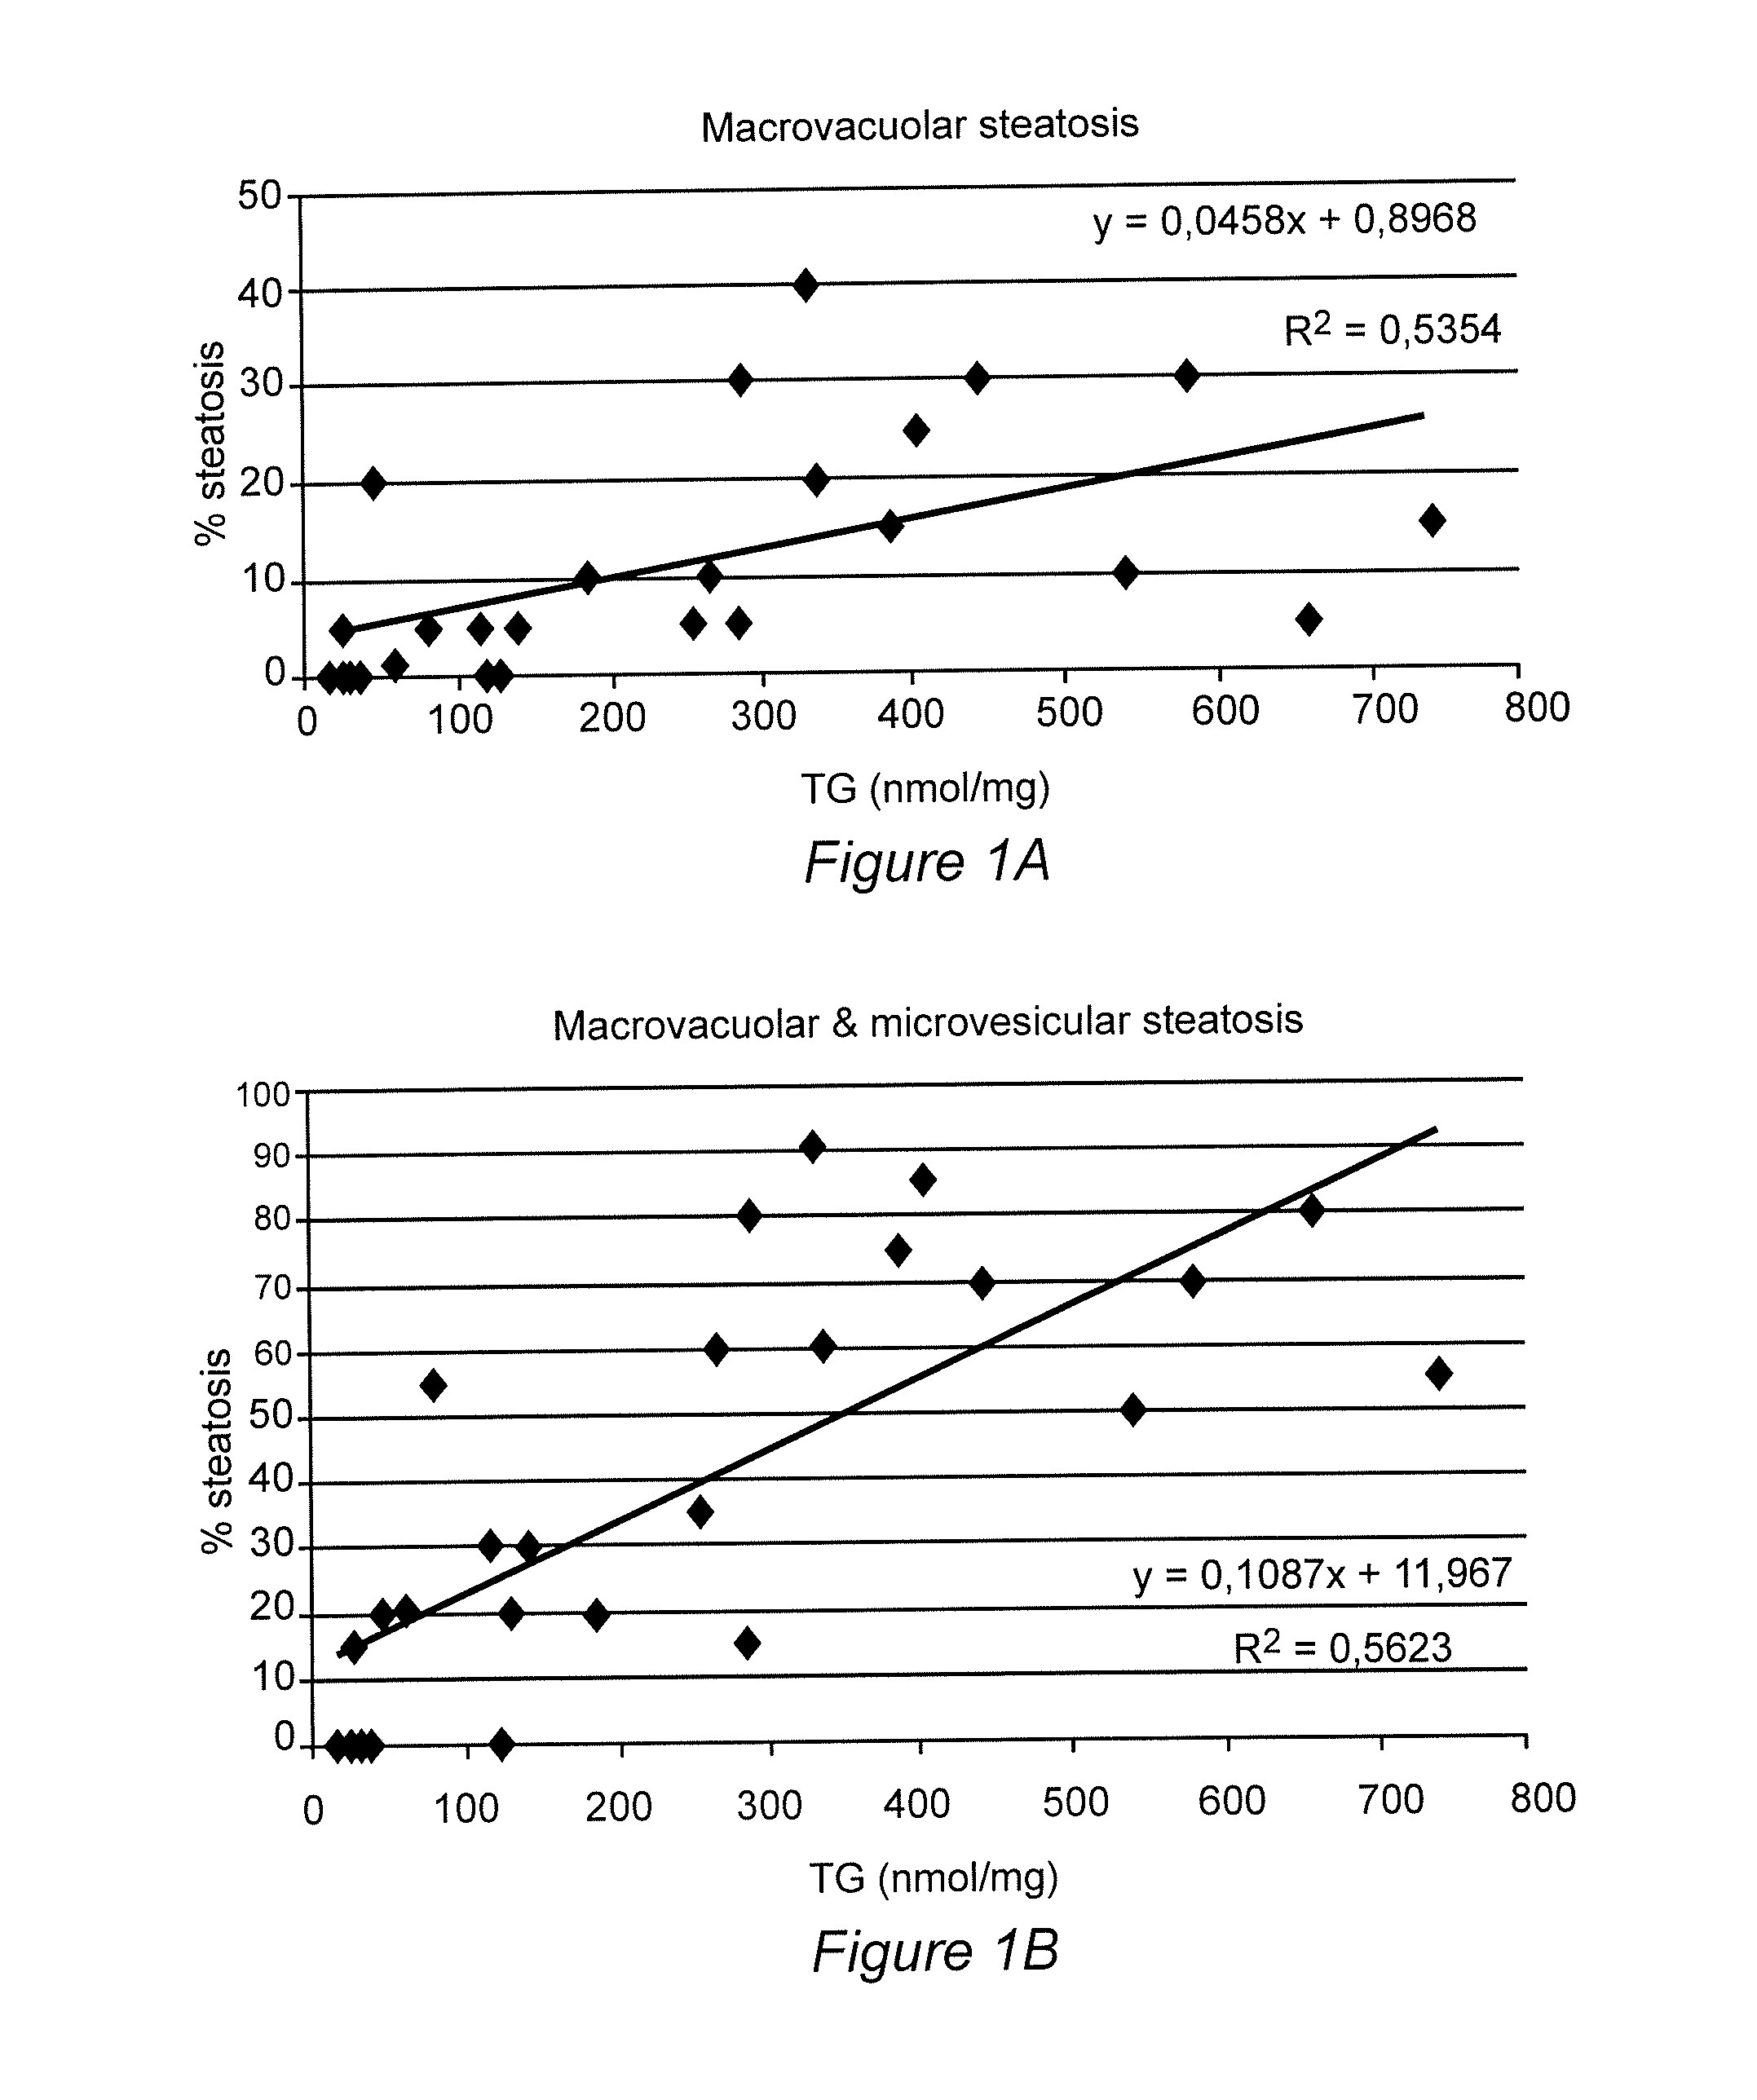
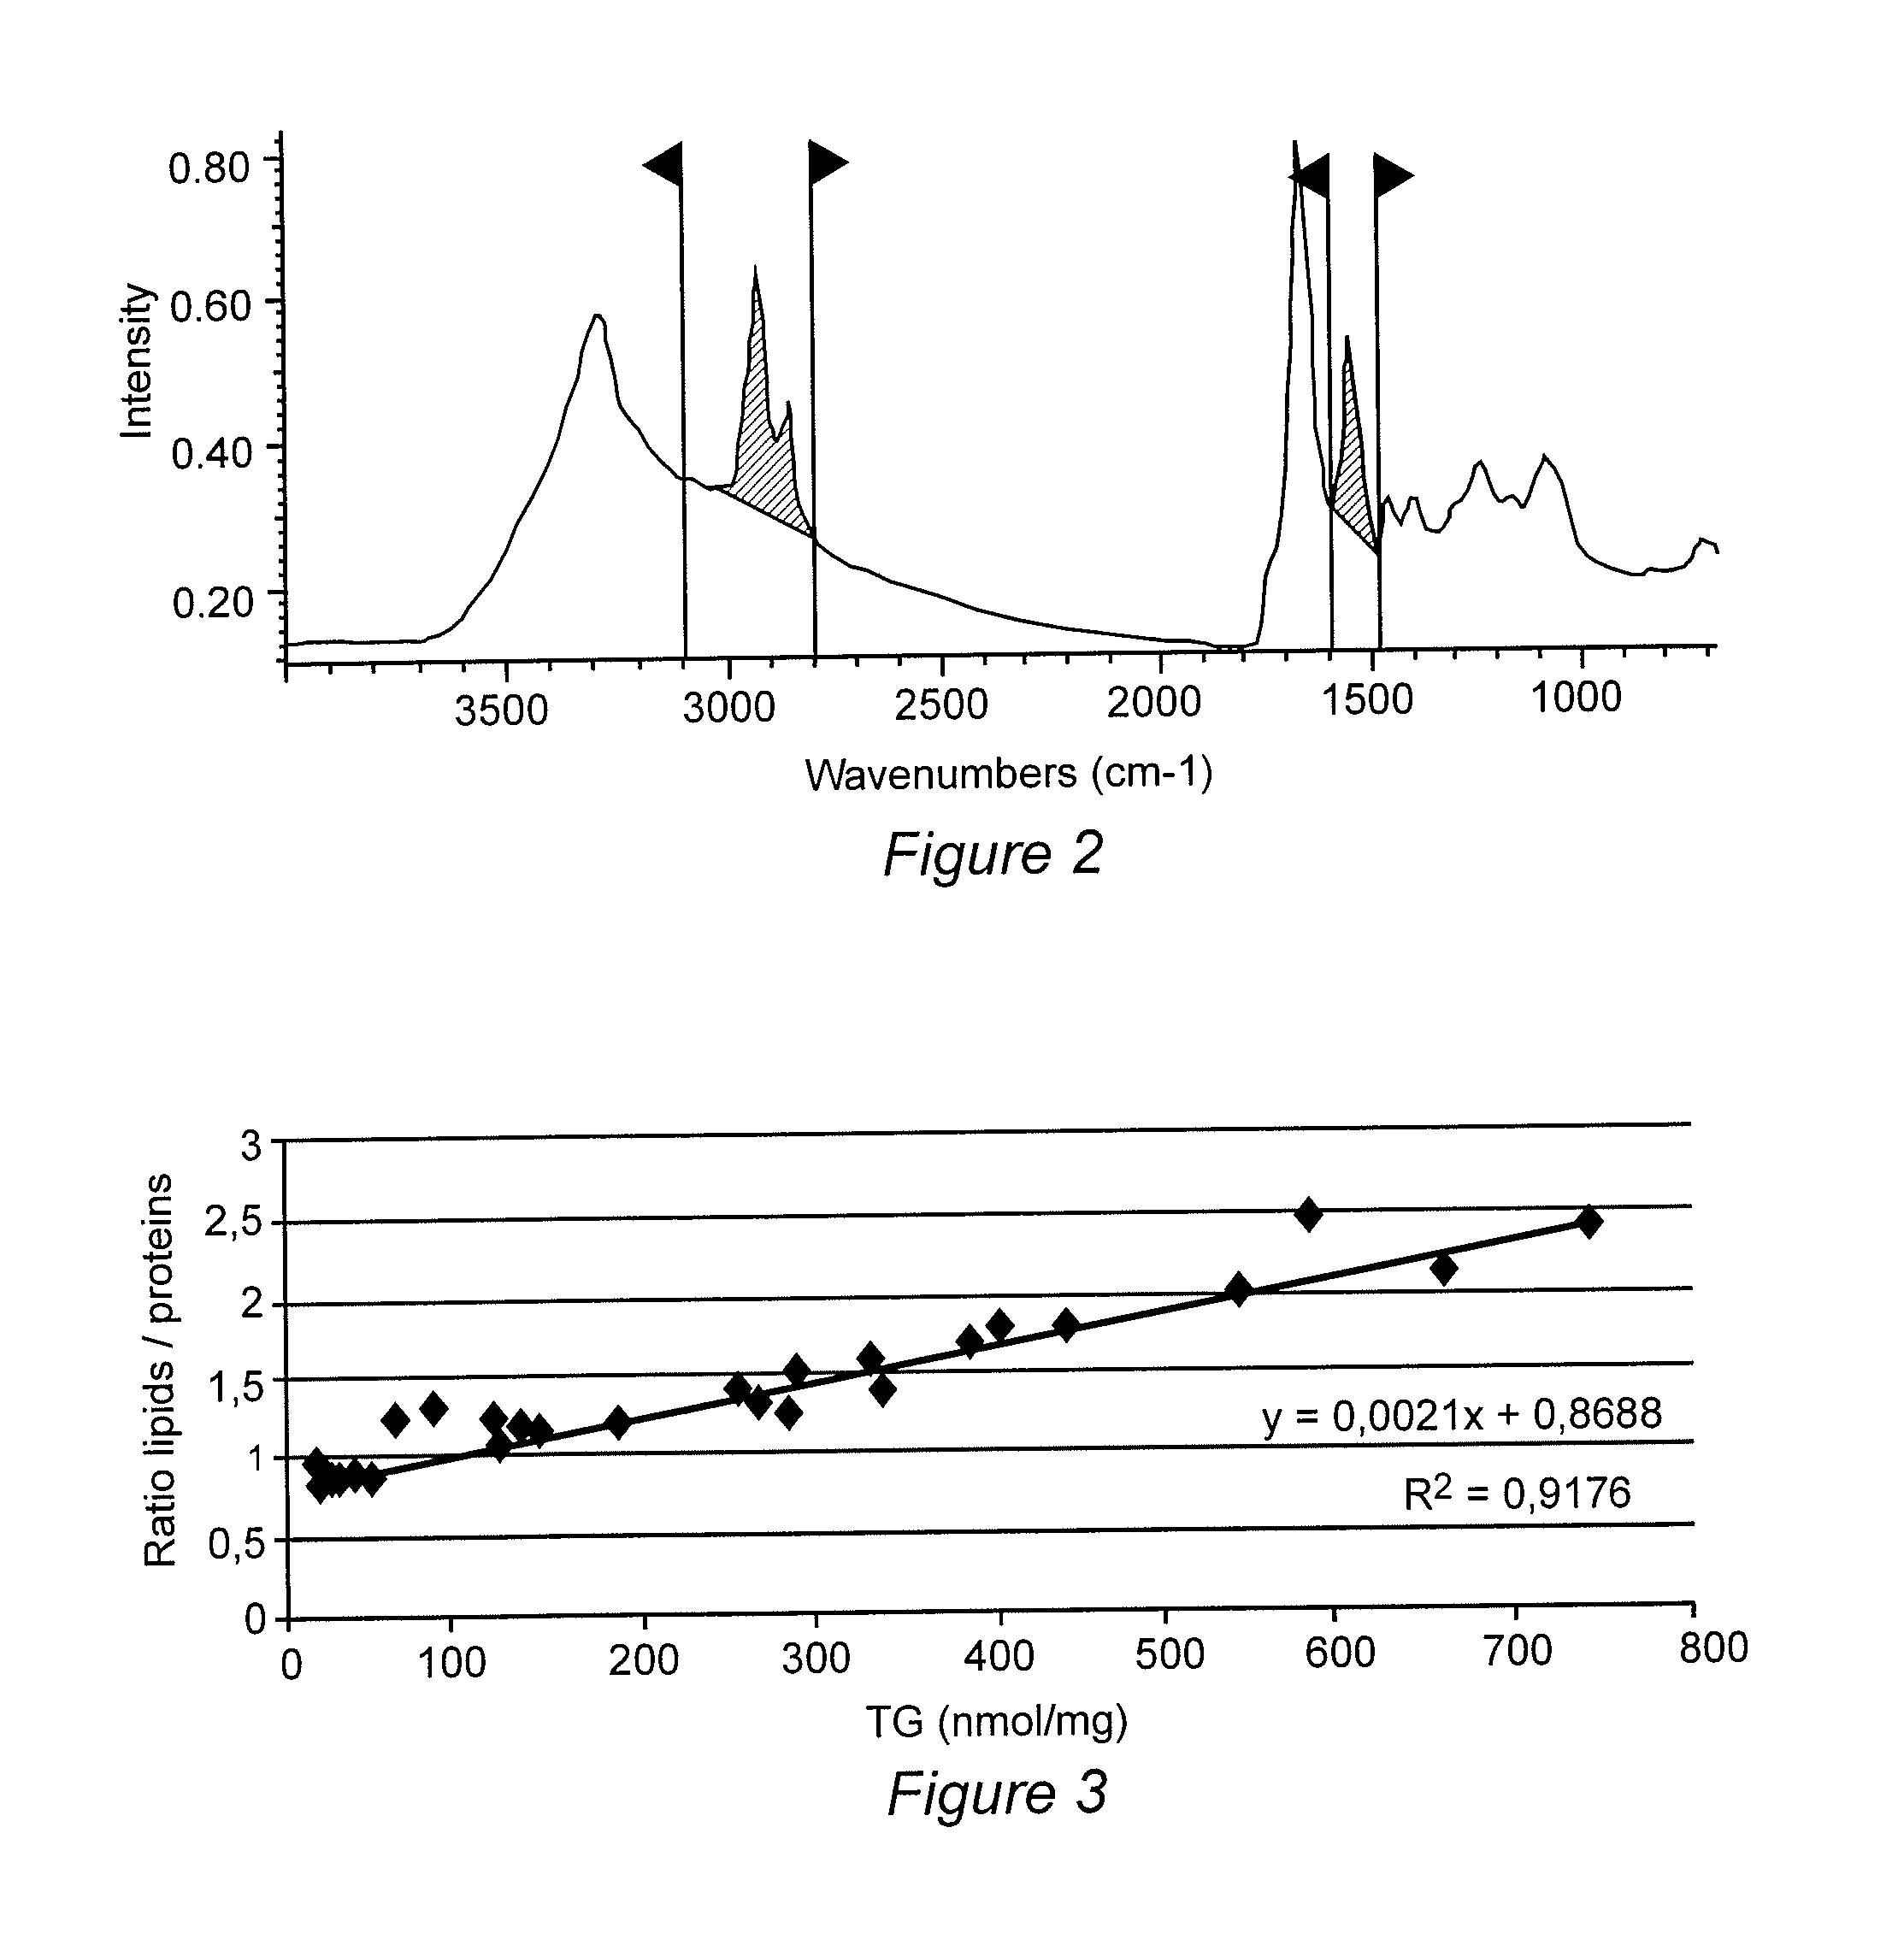
[0220]The hallmark feature of steatosis is the intra-cellular accumulation of triacylglycerol (TAG) resulting in the formation of vesicles in the hepatocytes. Therefore the estimation of steatosis is based on the histological examination of the number of steatotic cells and the size of steatotic vesicles on tissue sections after H&E staining. This estimation is considered to represent the level of steatosis. However, the correlation between the histological estimation of steatosis and the real lipid content has not been investigated. The lipid content was extracted from 27 human liver biopsies exhibiting various level of macrovacuolar and microvesicular steatosis ranking between 0-90%. The triglycerides (TG) were quantified by lipidomic analysis using gas phase chromatography coupled to mass spectrometry (GC-MS). The percentage of steatosis was plotted as a function of the concentration of TG (FIG. 1...

example 2

Comparison Between Two Embodiments

[0228]Two embodiments of a method for measuring the lipid content according to the invention were compared.

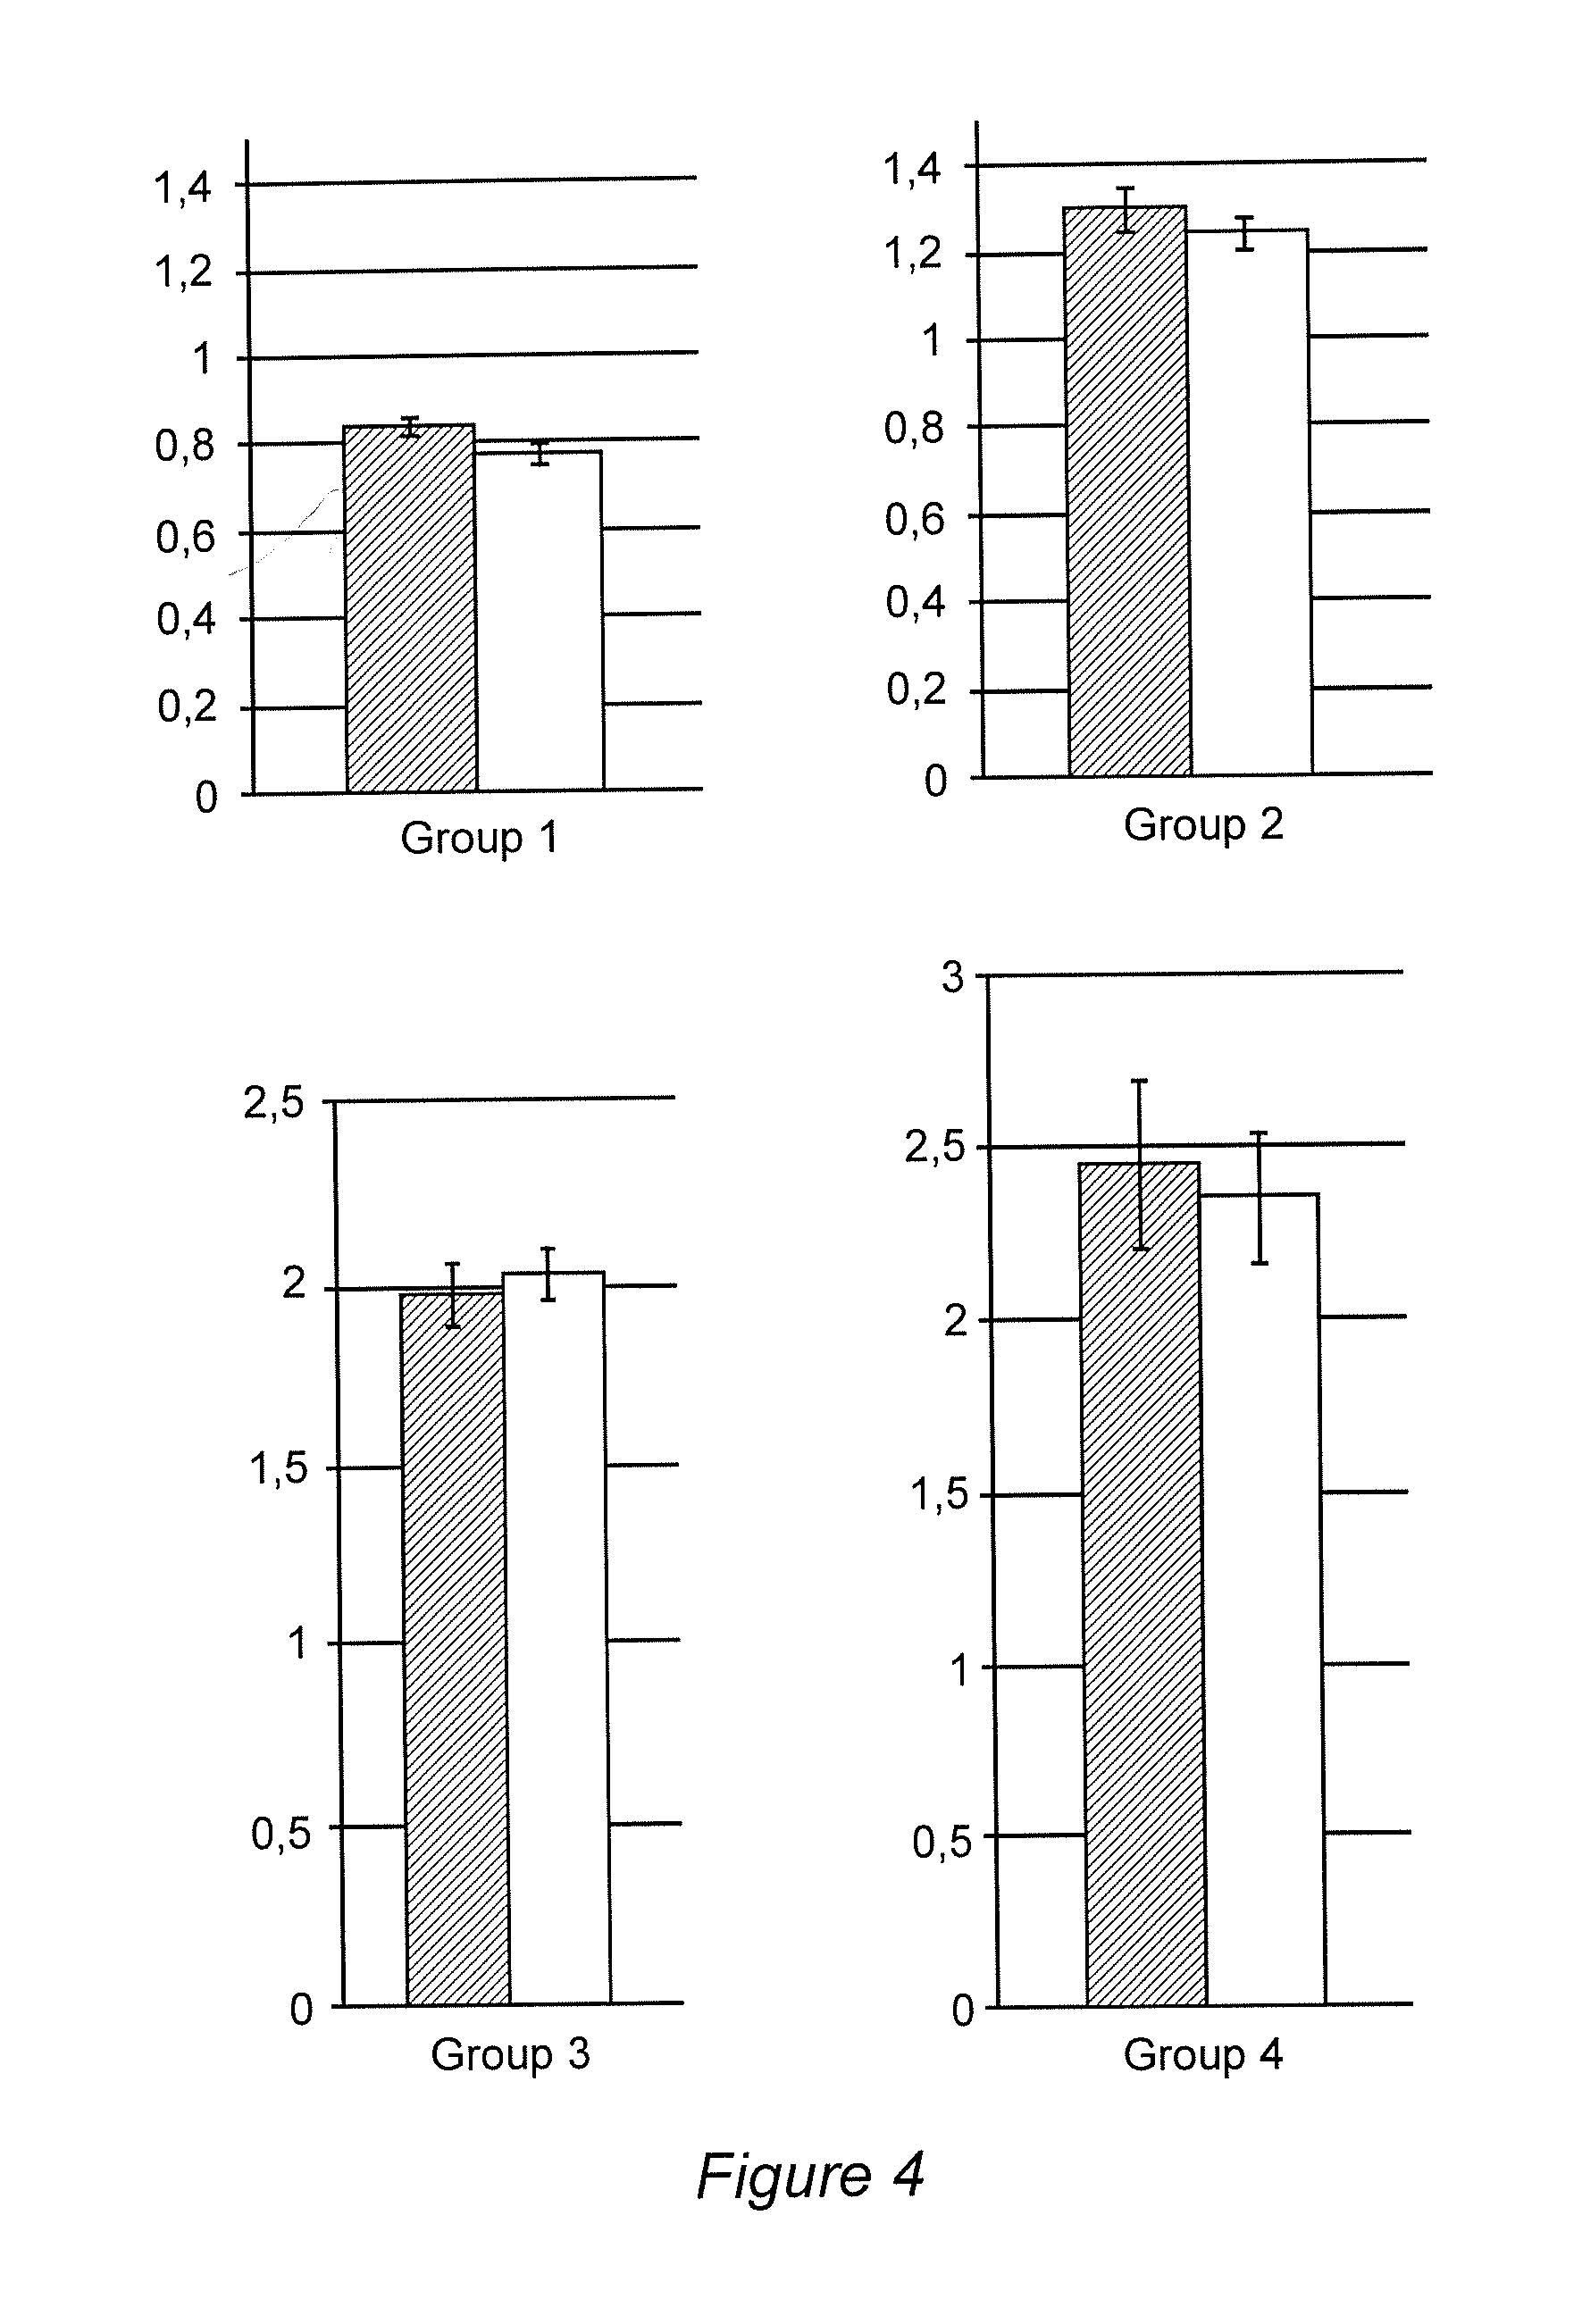
[0229]The first one is the method described in the example above. In this method, the ratio lipids / proteins is calculated for each pixel. The pixels are 50 μm×50 μm. Therefore, to analyse a 500 μm×500 μm section, 100 pixels are used and 100 ratio lipids / proteins are calculated. Then, average ratio of lipids / proteins is further obtained from the mean of the all pixels analyzed. This method is called below “Average Ratio” (AR) method.

[0230]In the second method, the average spectra of 100 pixels is calculated. The ratio lipids / proteins is calculated on the base of the average spectra.

[0231]This method is called below “Average Spectra” (AS) method.

[0232]19 steatotic patients among the patient analyzed in example 1 were analyzed.

[0233]The study was carried for each patient individually by choosing 4 independent areas on a tissue section.

[0234]Patien...


PUM

PropertyMeasurementUnit
timeaaaaaaaaaa
thicknessaaaaaaaaaa
thicknessaaaaaaaaaa

Abstract

The present invention relates to a method for measuring a biological value Vb in a liver wherein said method comprises the steps of: •a / applying an infrared radiation having at least a first wave number range between 2800 cm−1 and 3000 cm−1 to one or more portions, pi, of a sample of said liver, •b / detecting the intensity of the radiation after it has passed through each of one or more portions, pi, and generating a signal related to the detected intensity. •c / processing the generated signal(s) to calculate an average value va; •d / comparing said average value Va to a standard to obtain the biological value Vb.

Description

FIELD OF THE INVENTION[0001]The present invention relates to a method for measuring a biological value of a liver.BACKGROUND OF THE INVENTION[0002]Fatty liver disease encompasses a wide spectrum of clinical conditions such as alcoholism, drug intake, small-bowel by-pass surgery or metabolic syndrome and is also frequently associated with chronic hepatitis C. Non alcoholic fatty liver disease (NAFLD) known to be associated with obesity, insulin resistance, diabetes, hypertriglyceridemia, arterial hypertension in the metabolic syndrome is probably the most common cause of chronic liver disease in Western countries. Fatty liver disease is also a potential long-term complication of liver transplantation.[0003]The clinical-histological spectrum of NAFLD includes non-alcoholic fatty liver (NAFL), non-alcoholic steatohepatitis (NASH) and steatofibrosis. Estimates obtained from clinical series, autopsy studies, and convenience samples of the general population suggest that up to 30% of indi...

Claims


Application Information

Patent Timeline
Patent Type & Authority Applications(United States)
IPC IPC(8): G01N33/483G01N21/3563
CPCG01N33/4833G01N21/3563G01N2800/7052G01N2800/52G01N2800/50G01N2800/085G01N21/35
Inventor LE NAOUR, FRANCOISDUMAS, PAULGUETTIER, CATHERINE
Owner INST NAT DE LA SANTE & DE LA RECHERCHE MEDICALE (INSERM)
Learn More