Method for measuring a biological value of a liver
a biological value and liver technology, applied in the field of liver biological value measurement, can solve the problems of fatty liver disease, nash and fibrosis, currently impossible to identify at an early stage patient, etc., and achieve the effect of quick and reliable diagnosis
- Summary
- Abstract
- Description
- Claims
- Application Information
AI Technical Summary
Benefits of technology
Problems solved by technology
Method used
Image
Examples
example 1
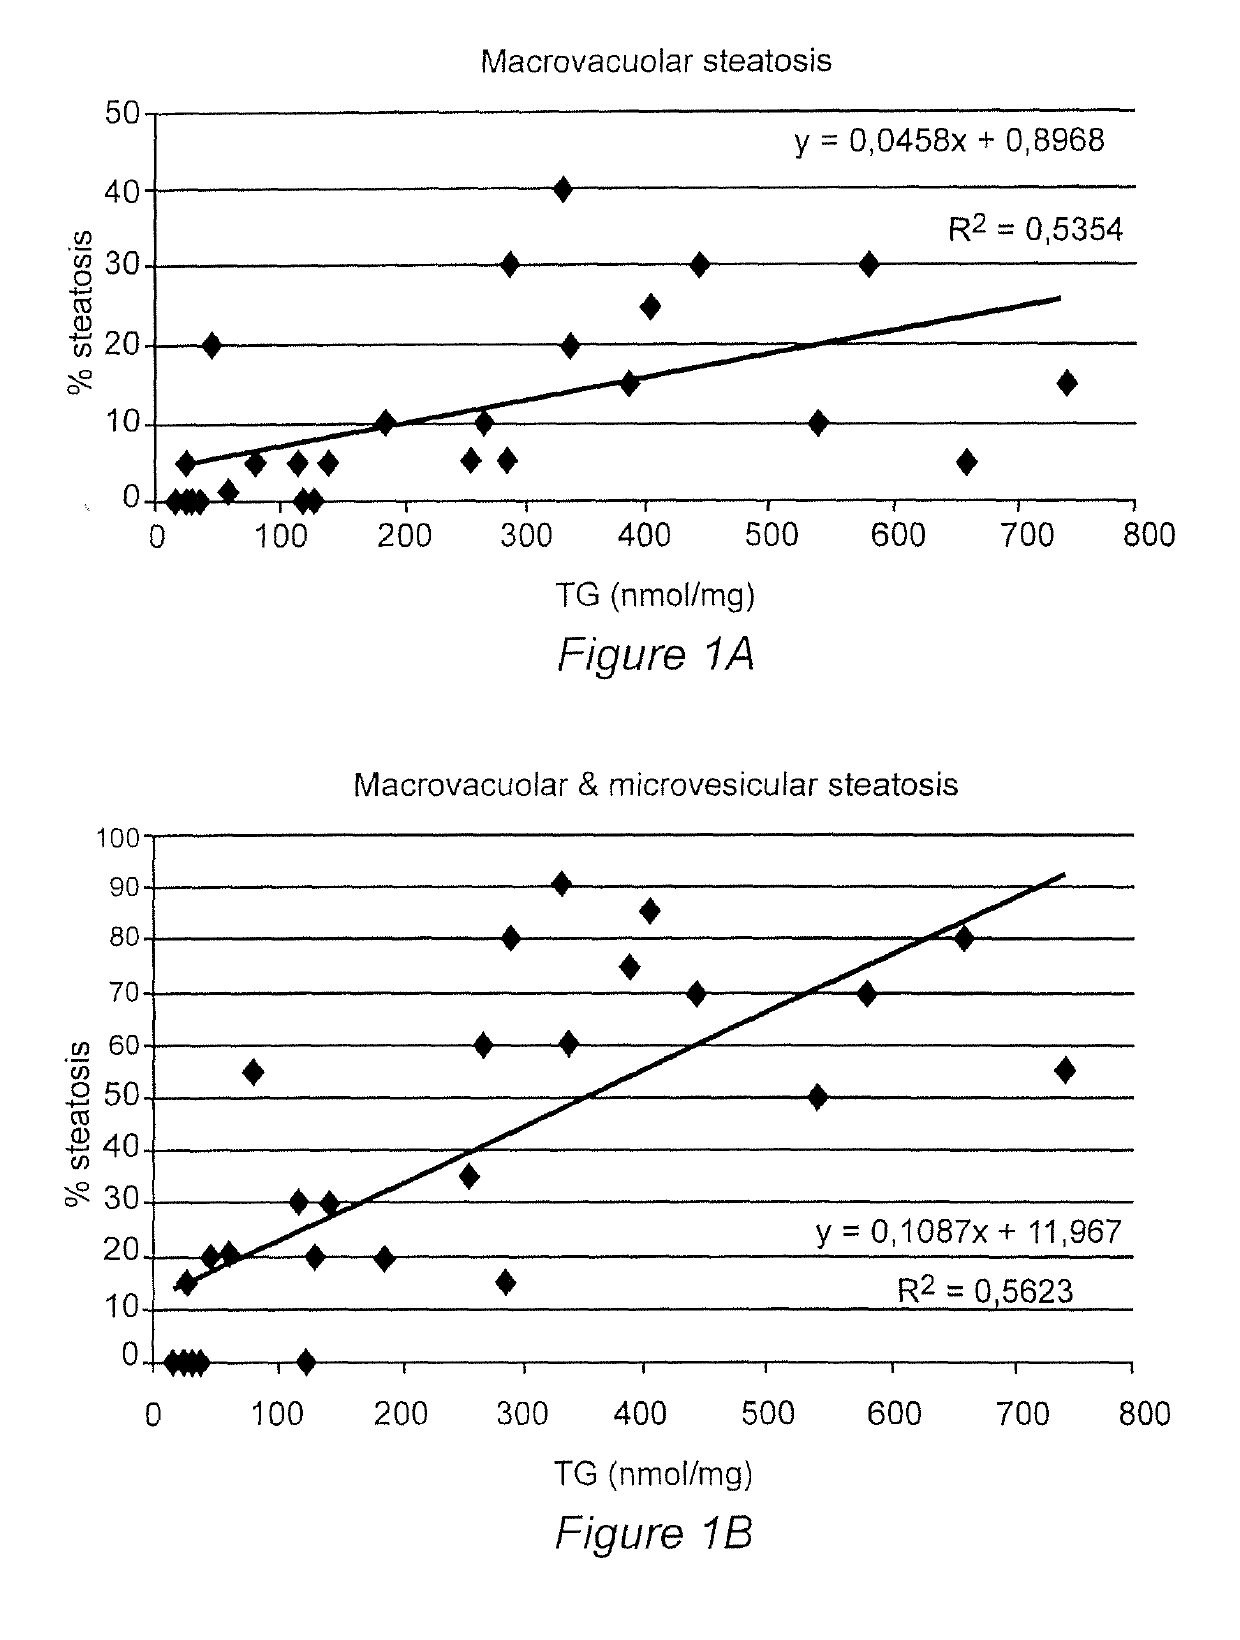
Histological Estimation of Liver Steatosis is Poorly Correlated to the Lipid Content.
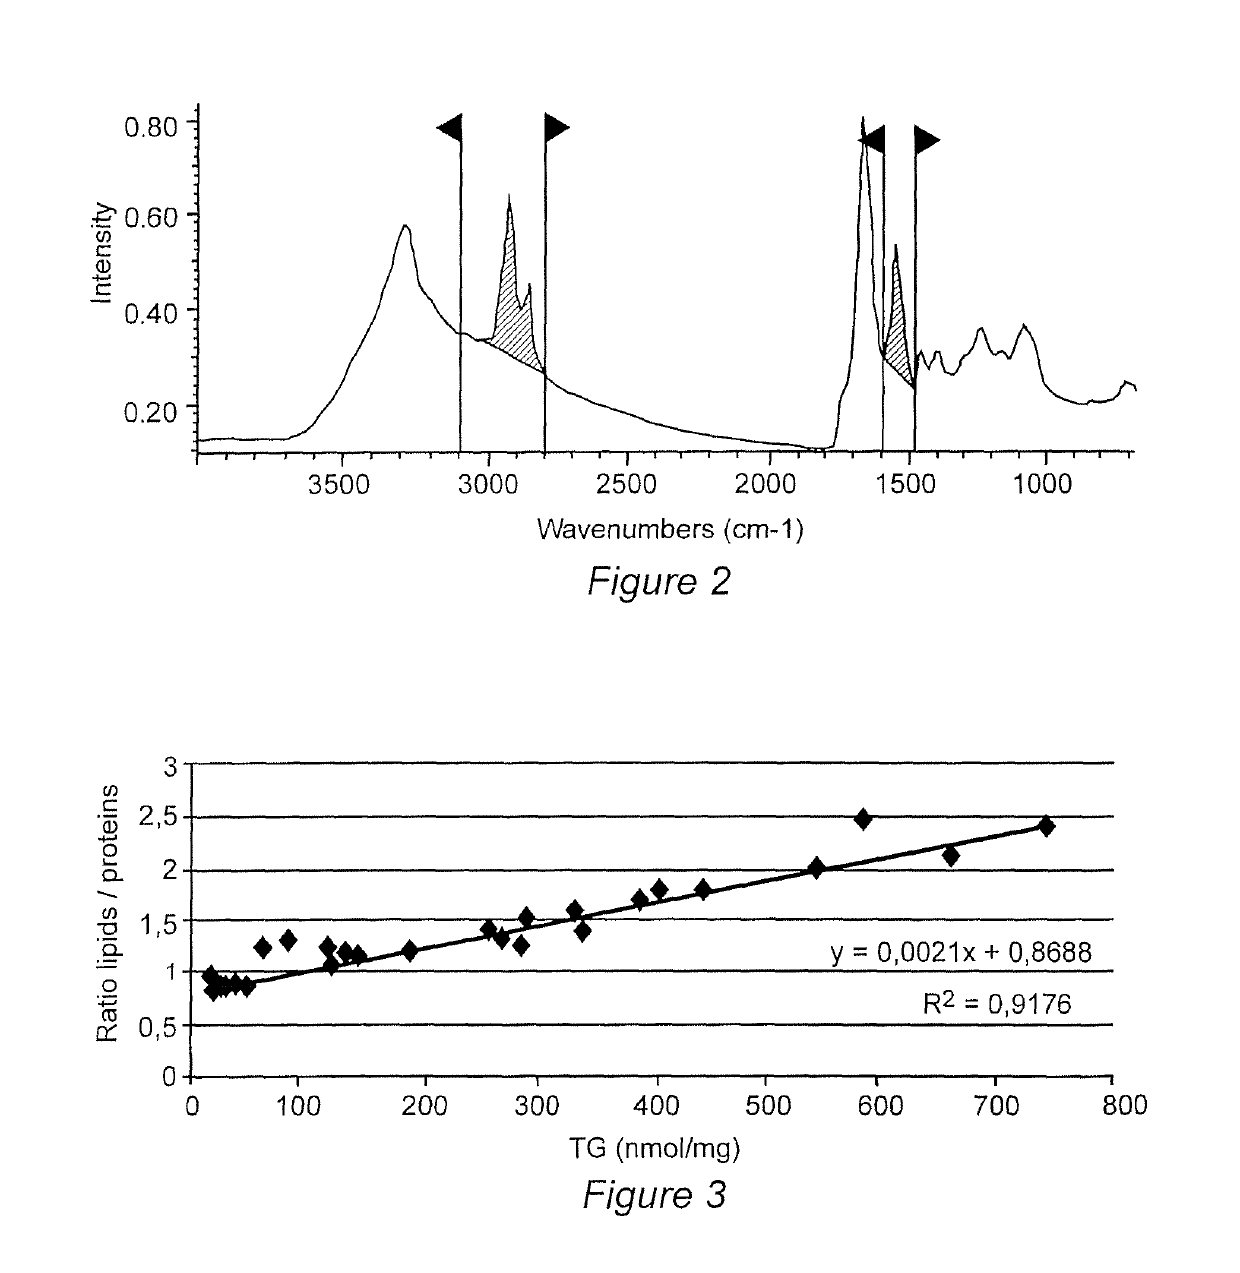
[0224]The hallmark feature of steatosis is the intra-cellular accumulation of triacylglycerol (TAG) resulting in the formation of vesicles in the hepatocytes. Therefore the estimation of steatosis is based on the histological examination of the number of steatotic cells and the size of steatotic vesicles on tissue sections after H&E staining. This estimation is considered to represent the level of steatosis. However, the correlation between the histological estimation of steatosis and the real lipid content has not been investigated. The lipid content was extracted from 27 human liver biopsies exhibiting various level of macrovacuolar and microvesicular steatosis ranking between 0-90%. The triglycerides (TG) were quantified by lipidomic analysis using gas phase chromatography coupled to mass spectrometry (GC-MS). The percentage of steatosis was plotted as a function of the concentration of TG (FIG. ...
example 2
Comparison Between Two Embodiments
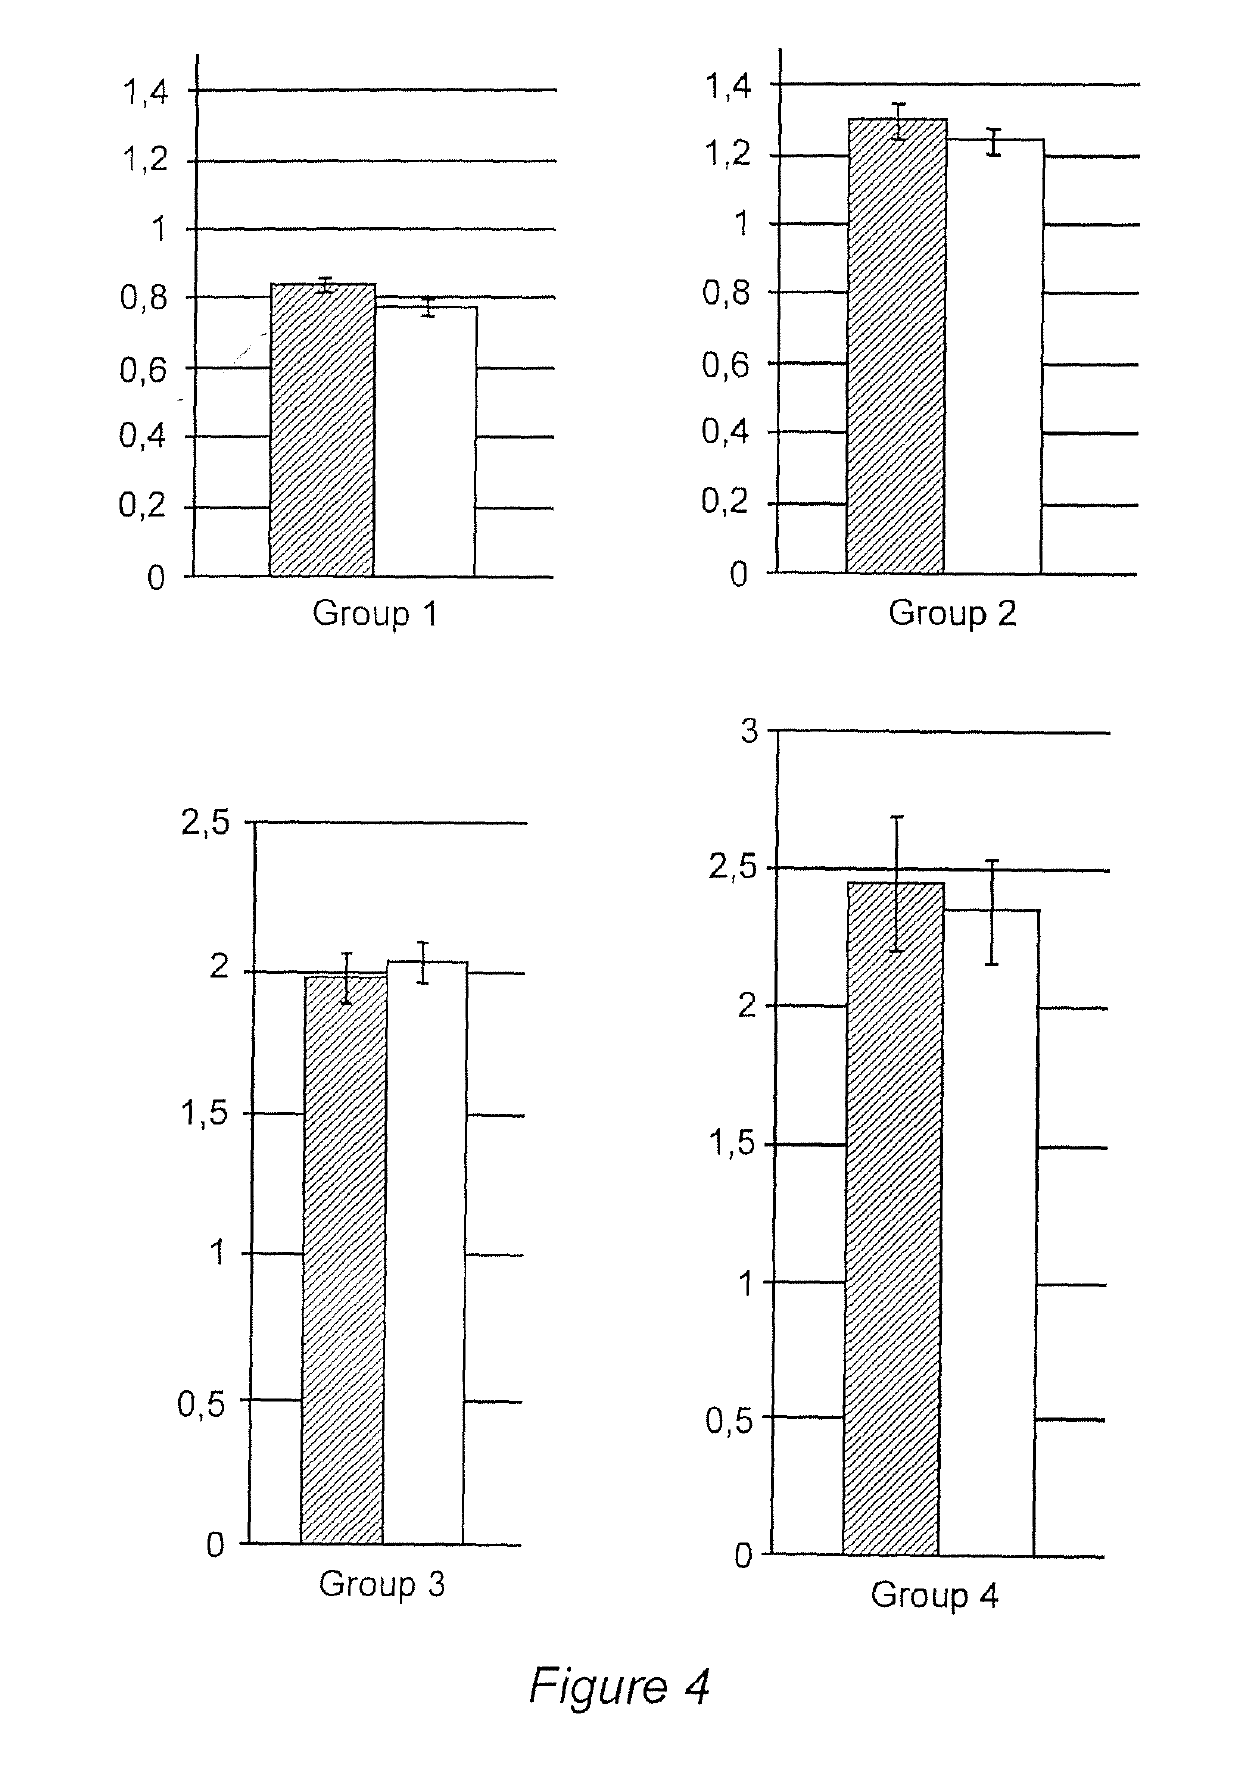
[0232]Two embodiments of a method for measuring the lipid content according to the invention were compared.
[0233]The first one is the method described in the example above. In this method, the ratio lipids / proteins is calculated for each pixel. The pixels are 50 μm×50 μm. Therefore, to analyse a 500 μm×500 μm section, 100 pixels are used and 100 ratio lipids / proteins are calculated. Then, average ratio of lipids / proteins is further obtained from the mean of the all pixels analyzed. This method is called below “Average Ratio” (AR) method.
[0234]In the second method, the average spectra of 100 pixels is calculated. The ratio lipids / proteins is calculated on the base of the average spectra.
[0235]This method is called below “Average Spectra” (AS) method.
[0236]19 steatotic patients among the patient analyzed in example 1 were analyzed.
[0237]The study was carried for each patient individually by choosing 4 independent areas on a tissue section.
[0238]Patien...
PUM
 Abstract
Description
Claims
Application Information
 - R&D
- Intellectual Property
- Life Sciences
- Materials
- Tech Scout
- Unparalleled Data Quality
- Higher Quality Content
- 60% Fewer Hallucinations
Browse by: Latest US Patents, China's latest patents, Technical Efficacy Thesaurus, Application Domain, Technology Topic, Popular Technical Reports.
© 2025 PatSnap. All rights reserved.Legal|Privacy policy|Modern Slavery Act Transparency Statement|Sitemap|About US| Contact US: help@patsnap.com


