
Wetting detection without markers

a technology of markers and assays, applied in the direction of phase-affecting property measurements, instruments, measurement devices, etc., can solve the problem of dark stain in the ftir image, and achieve the effect of accurate detection of this feature and fast and reliable determination of assay start points

Inactive Publication Date: 2017-01-26
KONINKLJIJKE PHILIPS NV
View PDF4 Cites 2 Cited by
  • Summary
  • Abstract
  • Description
  • Claims
  • Application Information

AI Technical Summary

Benefits of technology

The present invention provides a method for evaluating the start of an assay in a fluidic chamber. This is based on the dissolving of a reagent in a region of interest, which causes an optical effect that can be detected. The optical signal can be processed to a boolean signal to define the start of the assay. The method is reliable and fast, even under non-optimal conditions. Additionally, the invention includes a method for evaluating the start of an assay by measuring the change in conductivity or permittivity of fluid due to the dissolving of reagent.

Problems solved by technology

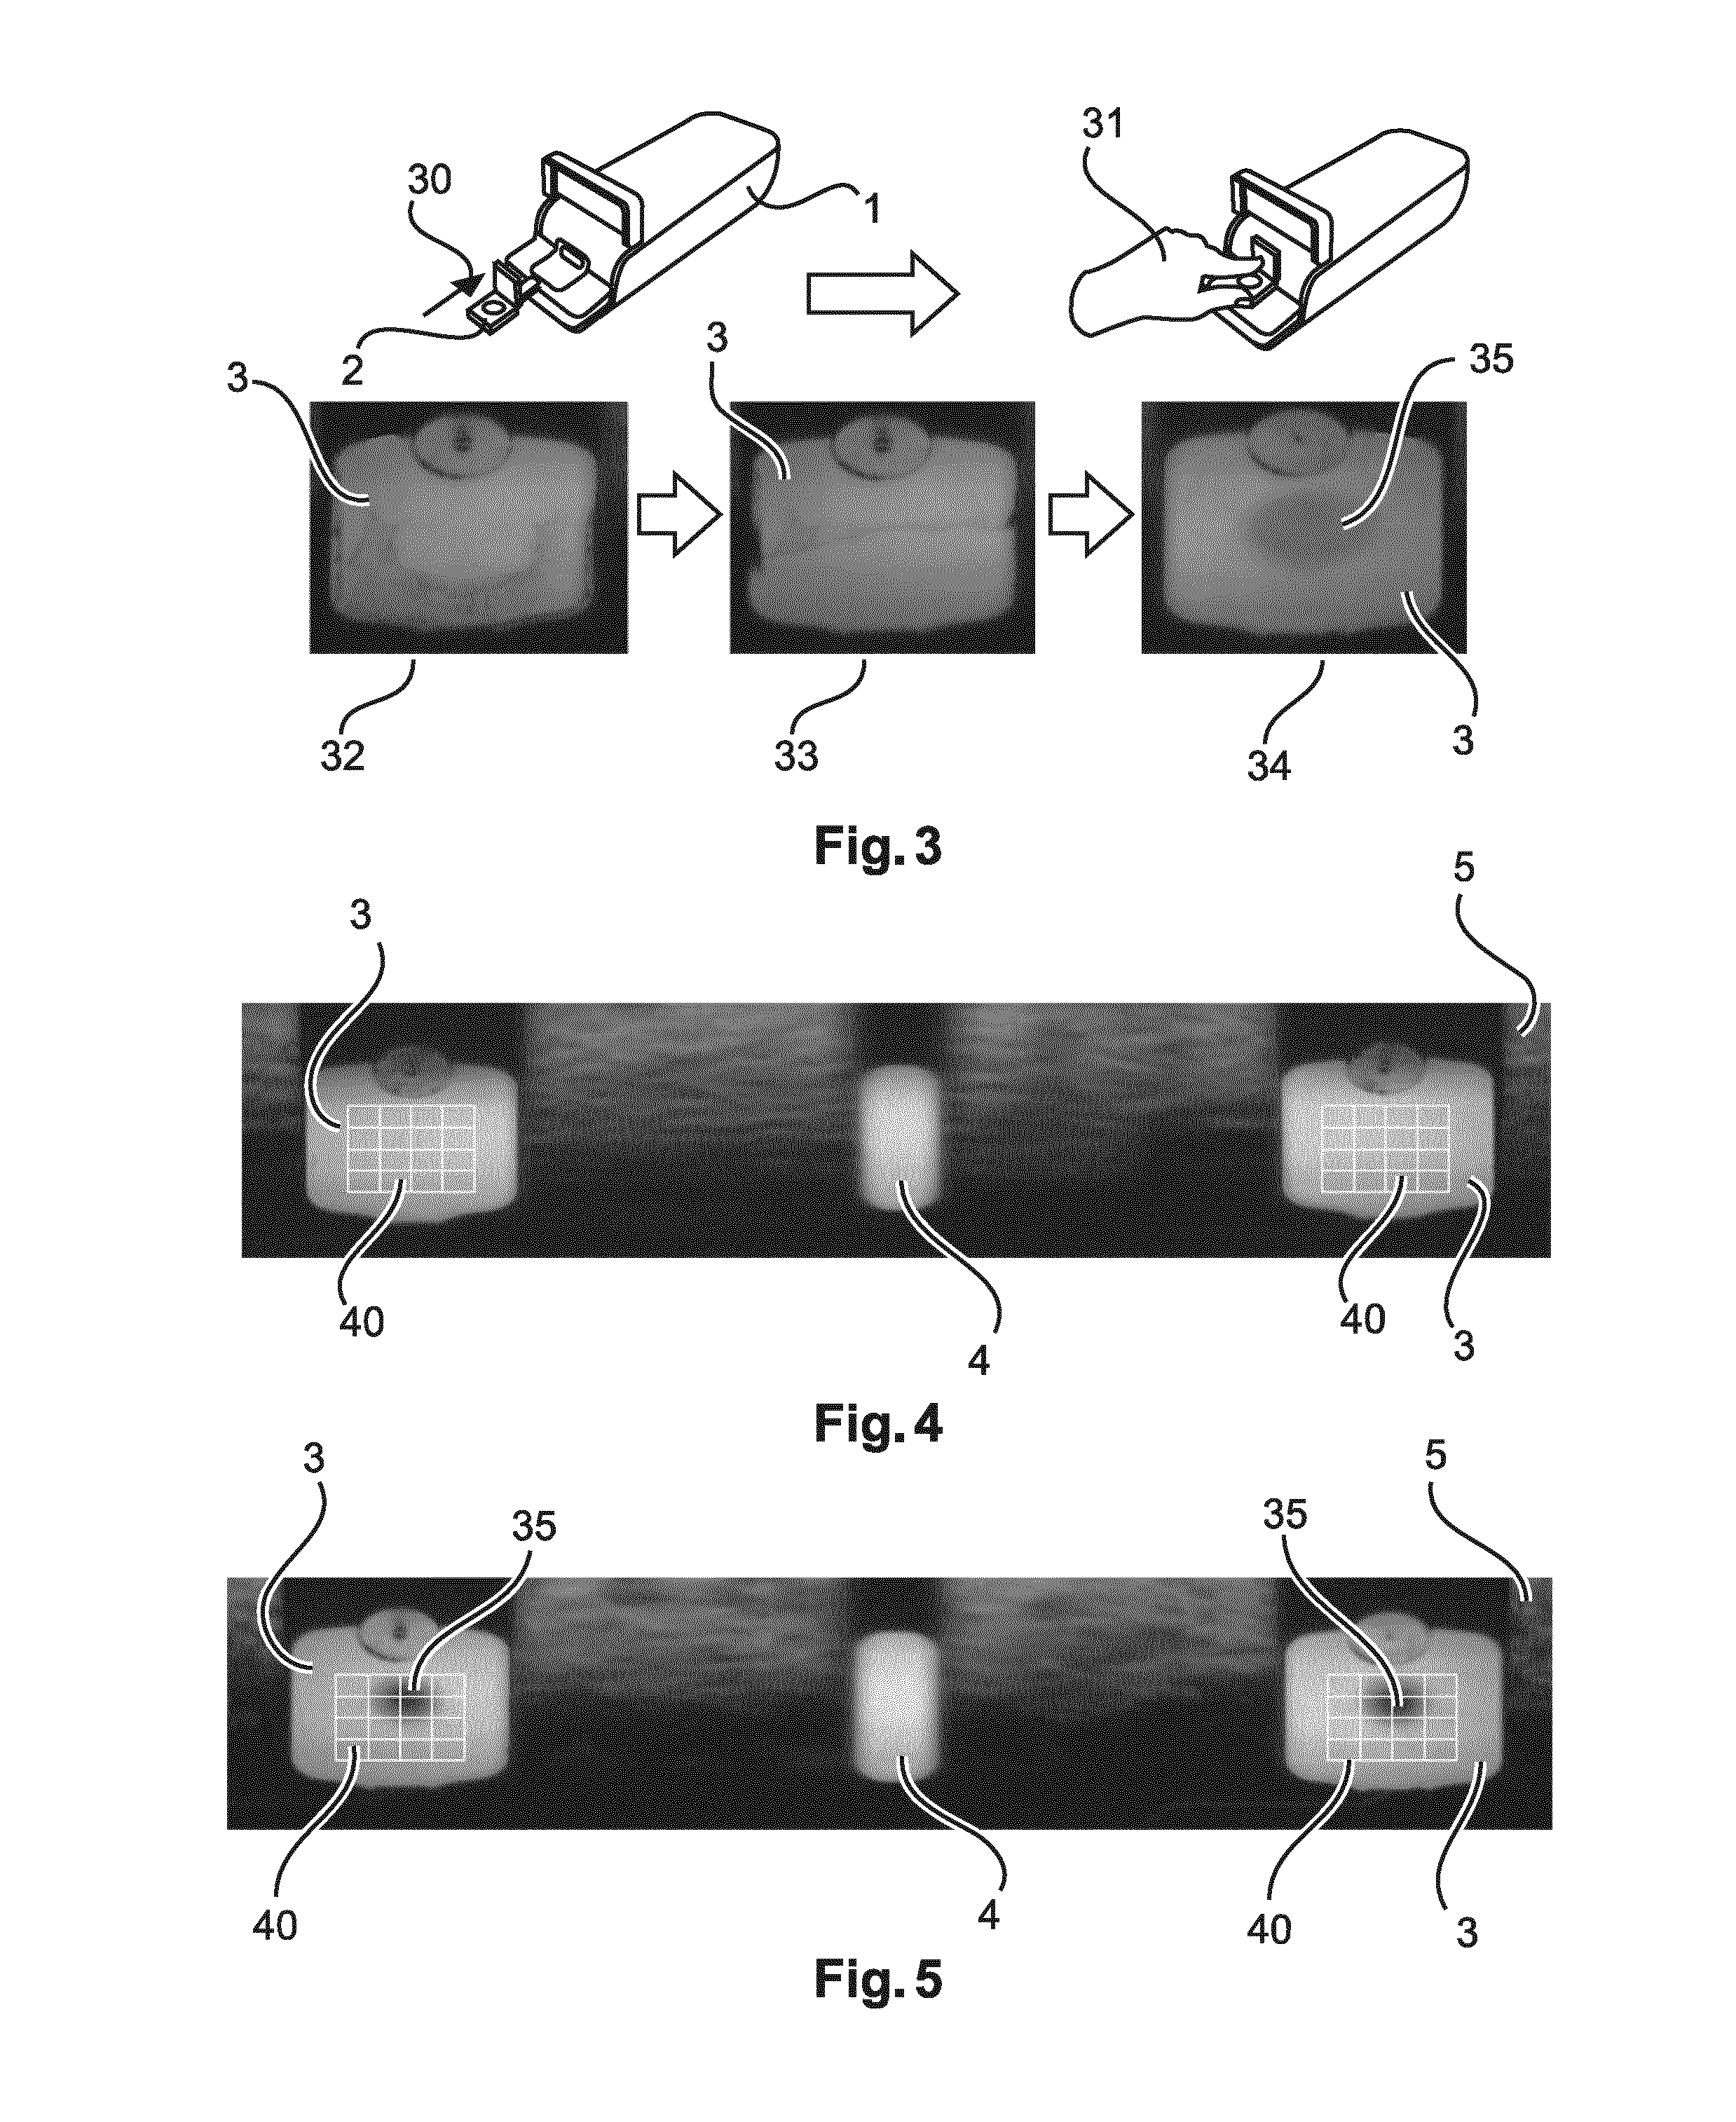
On dissolving, the bead buffer typically drips down to the cartridge surface causing a dark stain in the FTIR image.

Method used


Image

  • Wetting detection without markers
  • Wetting detection without markers
  • Wetting detection without markers

Examples


example 1

Region Definition

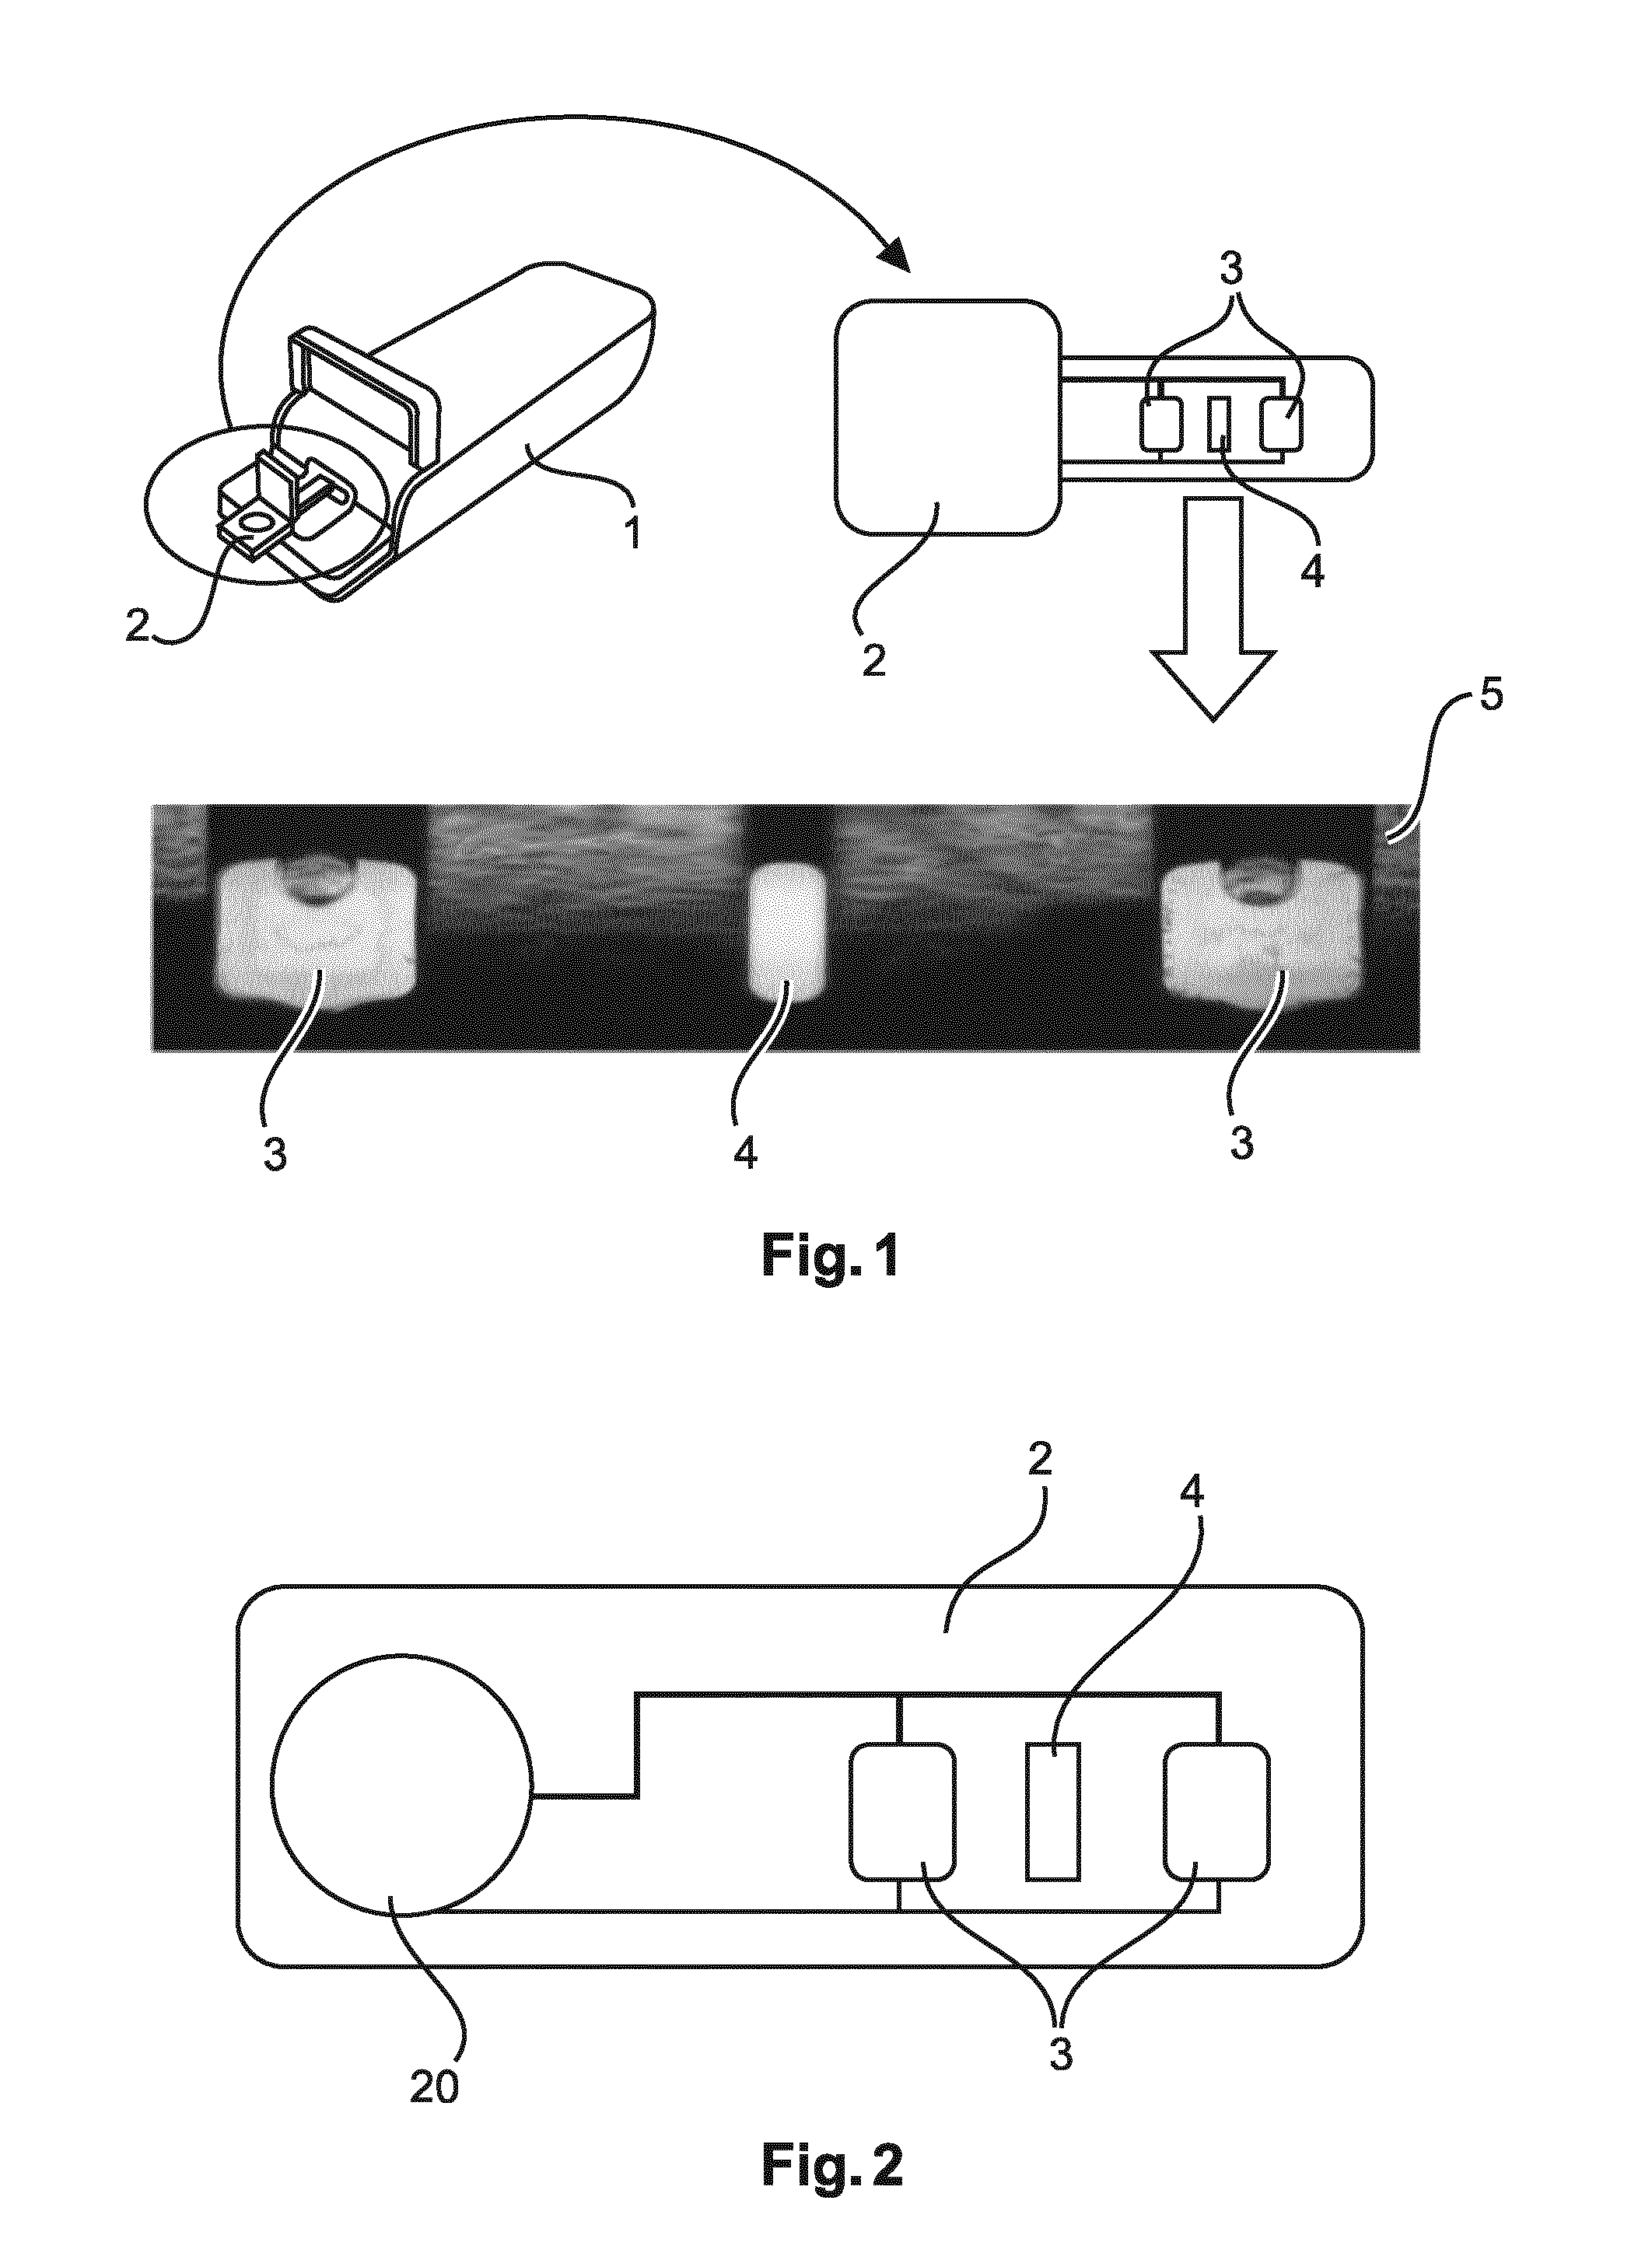
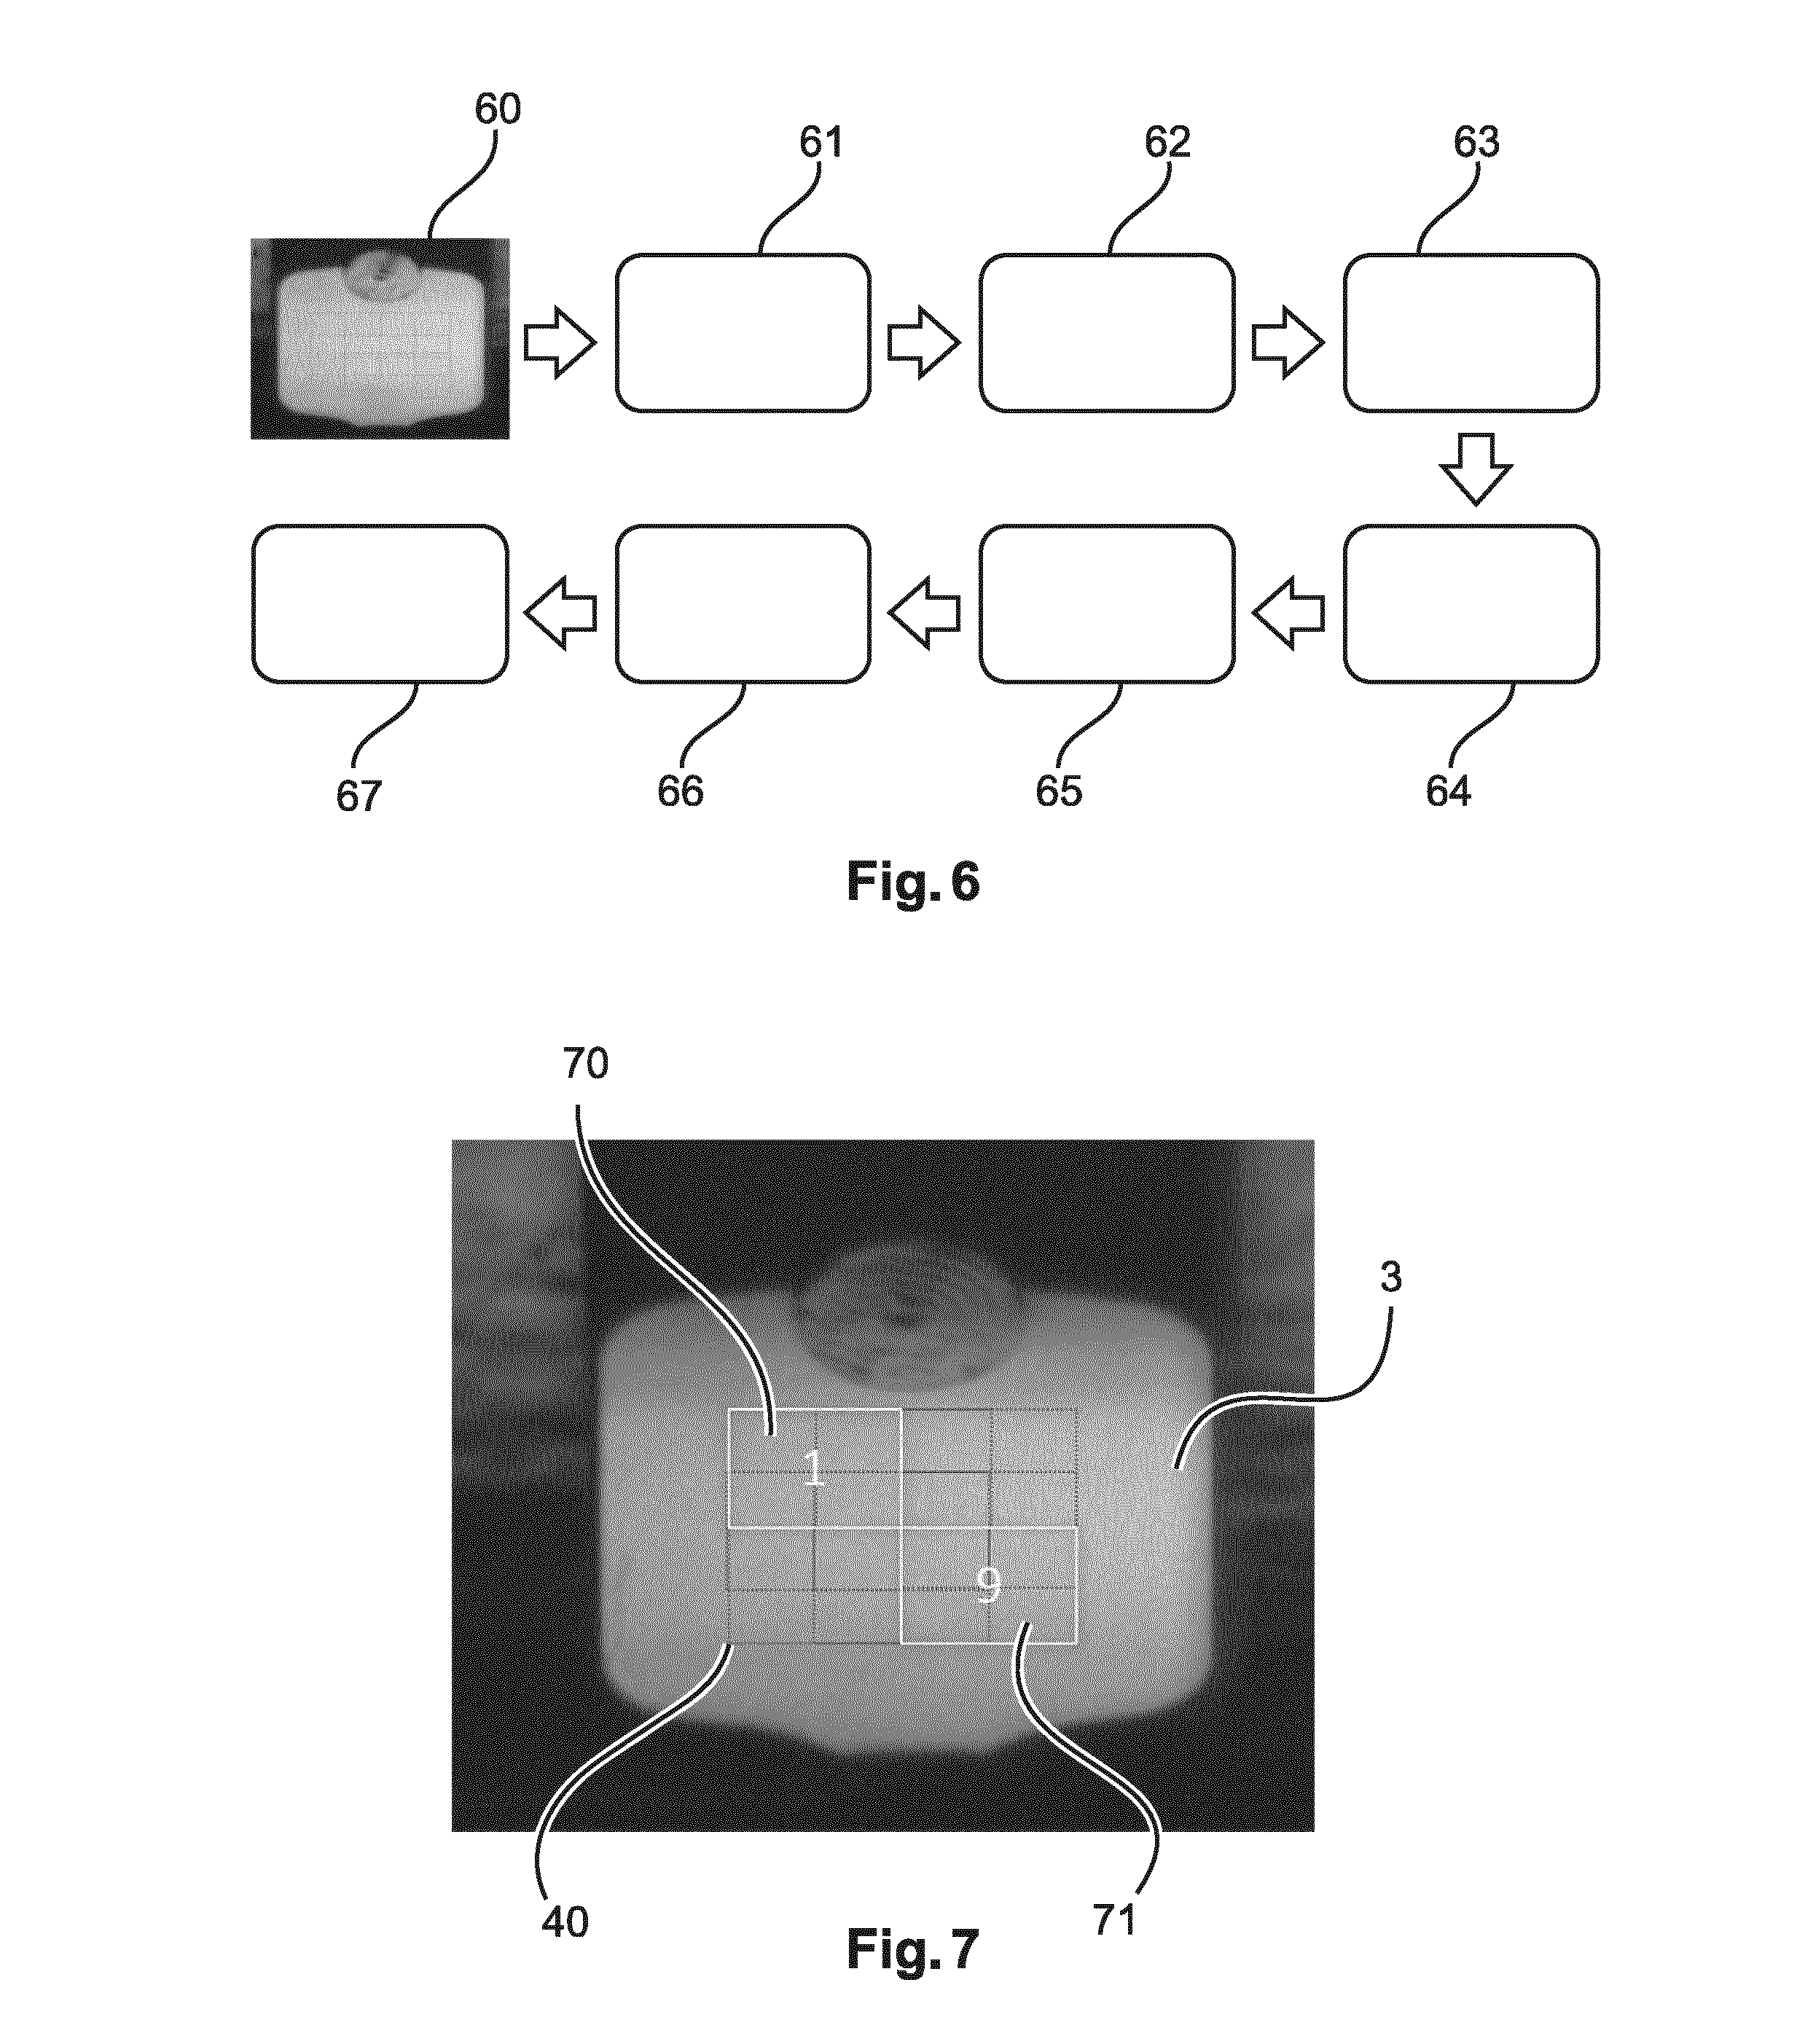
[0120]The regions for blob detection were defined in a grid of 3×3 regions per chamber. Each region overlaps its neighboring regions by 50%. The grid of regions had a distance of 33 px to the sides of the chamber, and 15 px to the bottom of the chamber and 8 px from the pinning.

[0121]The regions were positioned such that the variations in location of the blob due to analyzer orientation are covered, while maintaining enough distance to the edges of the chambers to remain robust against cartridge movement. The size of the regions was adjusted to the typical size of the black blob. Overlapping of the regions was set to 50% so that minimal disturbance of the signal occurs when switching to a different region due to a moving blob.

IdXYWidthHeightC1.W1−548−327040C1.W2−513−327040C1.W3−478−327040C1.W4−548−107040C1.W5−513−107040C1.W6−478−107040C1.W7−548127040C1.W8−513127040C1.W9−478127040C2.W1407−327040C2.W2442−327040C2.W3477−327040C2.W4407−107040C2.W5442−107040C2.W6477−1070...

example 2

Algorithm Specification

[0123]For blob detection a blob detection algorithm was used, which is composed of a number of steps which were executed in sequence. Each step adds additional robustness and specificity to the algorithm so that wetting can be reliably detected. The steps are clarified by using the signal of a random, noisy experiment as example. FIG. 8 illustrates this signal, which is the result of getting the average signal for each region of a chamber with a region definition specified in Example 1. Typically, the processing is done in real time while the black blob occurs, so only the part of the signal until detection may be available.

example 3

Removal of Spike-Noise

[0124]As a first step, for each region the spikes / noise caused by movement of the cartridge was filtered out by using a median filter of width 101. This filter suppresses all high-frequency changes in the region signal without impacting the signal strength of the remaining signal. The result of this removal step is illustrated in FIG. 9, which shows smoothed version of the signal curves as shown in FIG. 8.


PUM

PropertyMeasurementUnit
sizeaaaaaaaaaa
sizeaaaaaaaaaa
sizeaaaaaaaaaa

Abstract

The present invention relates to a method for evaluating the start of an assay in a fluidic chamber, wherein said start of the assay is based on the dissolving of a reagent in a region of interest in said fluidic chamber. The method may be based on the detection of an optical effect in the region of interest caused by the dissolving of the reagent, comprising the steps: obtaining an optical signal from one or more sub-sections of said region of interest; processing said optical signal to a Boolean signal; and defining the start of the assay based on said Boolean signal. The present invention also relates to a method for evaluating the start of an assay comprising an electrical detection of a change in the conductivity or permittivity of fluid due to the dissolving of reagent as mentioned above. Furthermore, the invention relates to a program element or computer program for evaluating the start of an assay and to an evaluation system for determining the start of an assay, comprising a computer processor, memory, and (a) data storage device(s), the memory having programming instructions to execute such a program element or computer program.

Description

FIELD OF THE INVENTION[0001]The present invention relates to a method for evaluating the start of an assay in a fluidic chamber, wherein said start of the assay is based on the dissolving of a reagent in a region of interest in said fluidic chamber. The method may be based on the detection of an optical effect in the region of interest caused by the dissolving of the reagent, comprising the steps: obtaining an optical signal from one or more sub-sections of said region of interest; processing said optical signal to a Boolean signal according to the presence of said optical effect; and defining the start of the assay based on said Boolean signal. The present invention also relates to a method for evaluating the start of an assay comprising an electrical detection of a change in the conductivity or permittivity of fluid due to the dissolving of reagent as mentioned above. Furthermore, the invention relates to a program element or computer program for evaluating the start of an assay a...

Claims


Application Information

Patent Timeline
Patent Type & Authority Applications(United States)
IPC IPC(8): G01N21/41G01N27/12G01N21/552
CPCG01N21/4133G01N27/12G01N21/552G01N33/543G01N33/5308
Inventor BRONNEBERG, PATRICKSMITS, ROLAND ANTONIUS JOHANNES GERARDUSFOPPEN, SYTSKEVAN HEESCH, FRANCISCUS HENDRIKUSLIU, HONGIMMINK, ALBERT HENDRIK JAN
Owner KONINKLJIJKE PHILIPS NV
Learn More