Fuzzy curve analysis based soft sensor modeling method using time difference Gaussian process regression

a soft sensor and fuzzy curve technology, applied in the field of complex, can solve the problems of inability to fully explain the characteristics of the process, inability to meet the causality, and significant time lag between the input data collected by each sensor and the output data, so as to reduce production costs, increase yield, and improve accuracy. the effect of results

Inactive Publication Date: 2017-03-02
JIANGNAN UNIV
View PDF3 Cites 80 Cited by
  • Summary
  • Abstract
  • Description
  • Claims
  • Application Information

AI Technical Summary

Benefits of technology

[0014]Then, When new input samples are available, a time difference Gaussian process regression (TDGPR) model is employed for current time online prediction based on historical variable values collected certain moments ago, thus making it possible to realize real-time estimation and control of the key variable, obtain more accurate results, increase the yield and reduce production costs.

Problems solved by technology

However, there is a significant time lag between the input data collected by each sensor and the output data obtained through the laboratory analysis or online instrumentation.
If we continue using steady-state modeling approaches, the established model will be unable to fully explain the characteristics of the process, and it does not meet the causality of actual process.
When applying such methods to practical applications, it is needed to get a tradeoff between the complexity and the accuracy of the algorithm.

Method used


Image

  • Fuzzy curve analysis based soft sensor modeling method using time difference Gaussian process regression
  • Fuzzy curve analysis based soft sensor modeling method using time difference Gaussian process regression
  • Fuzzy curve analysis based soft sensor modeling method using time difference Gaussian process regression

Examples


examples

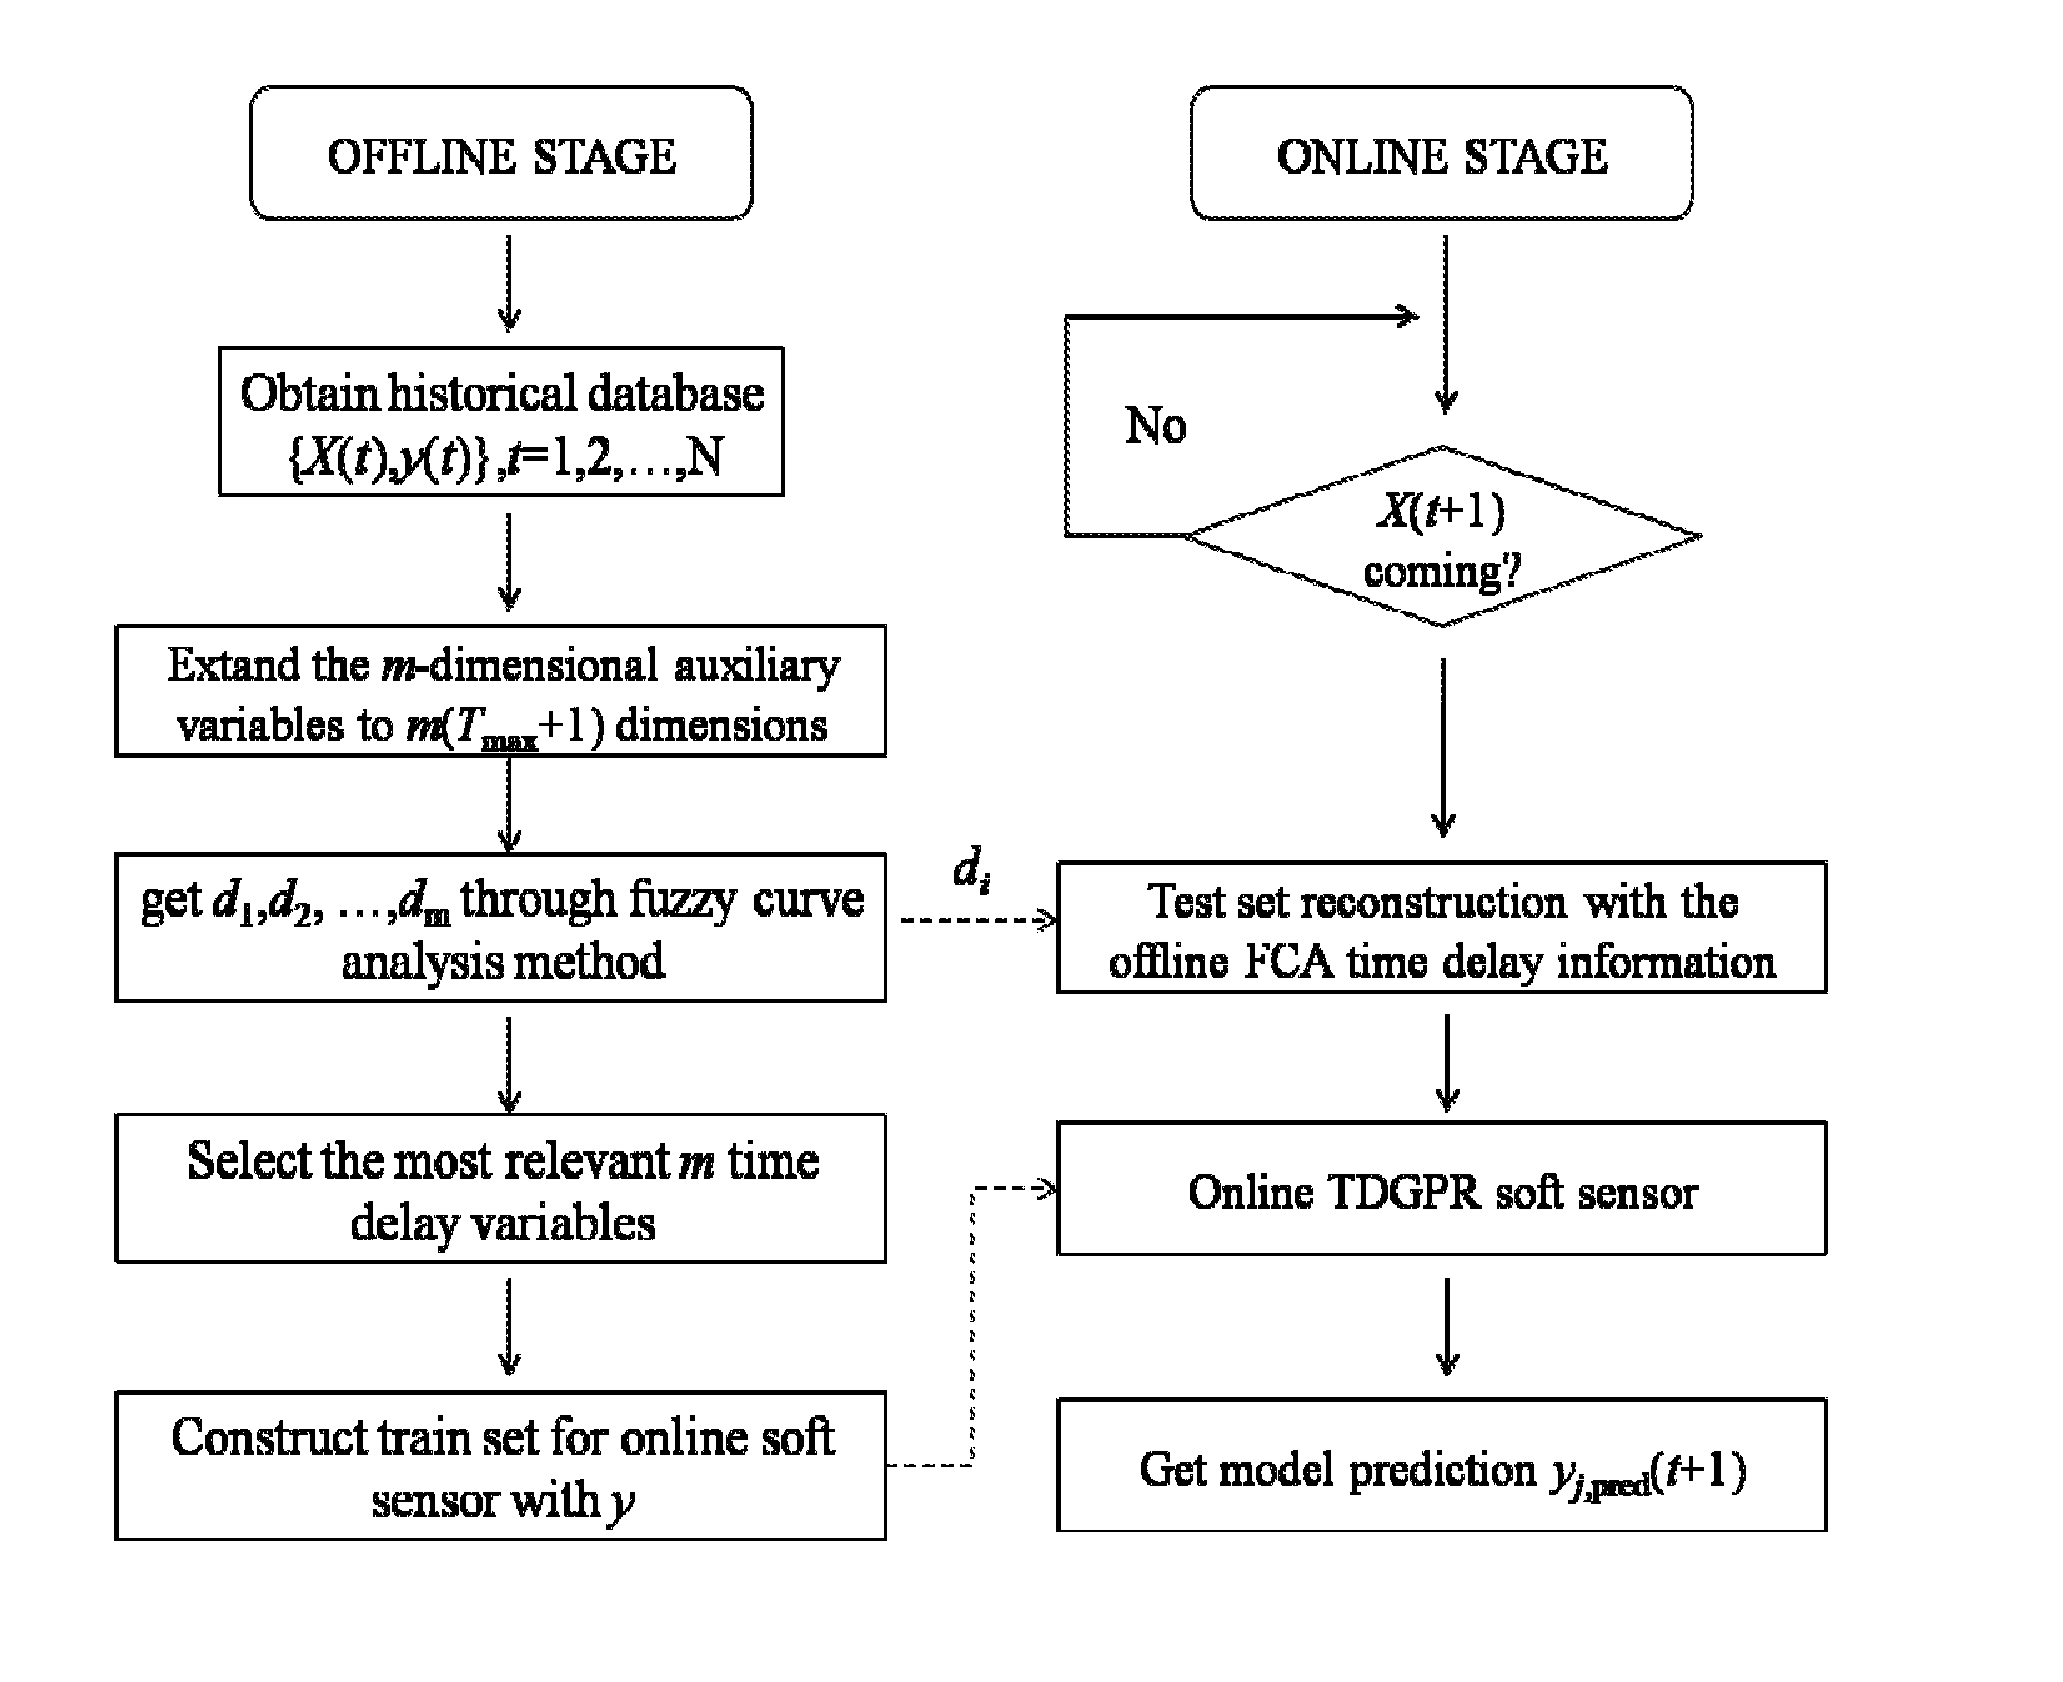
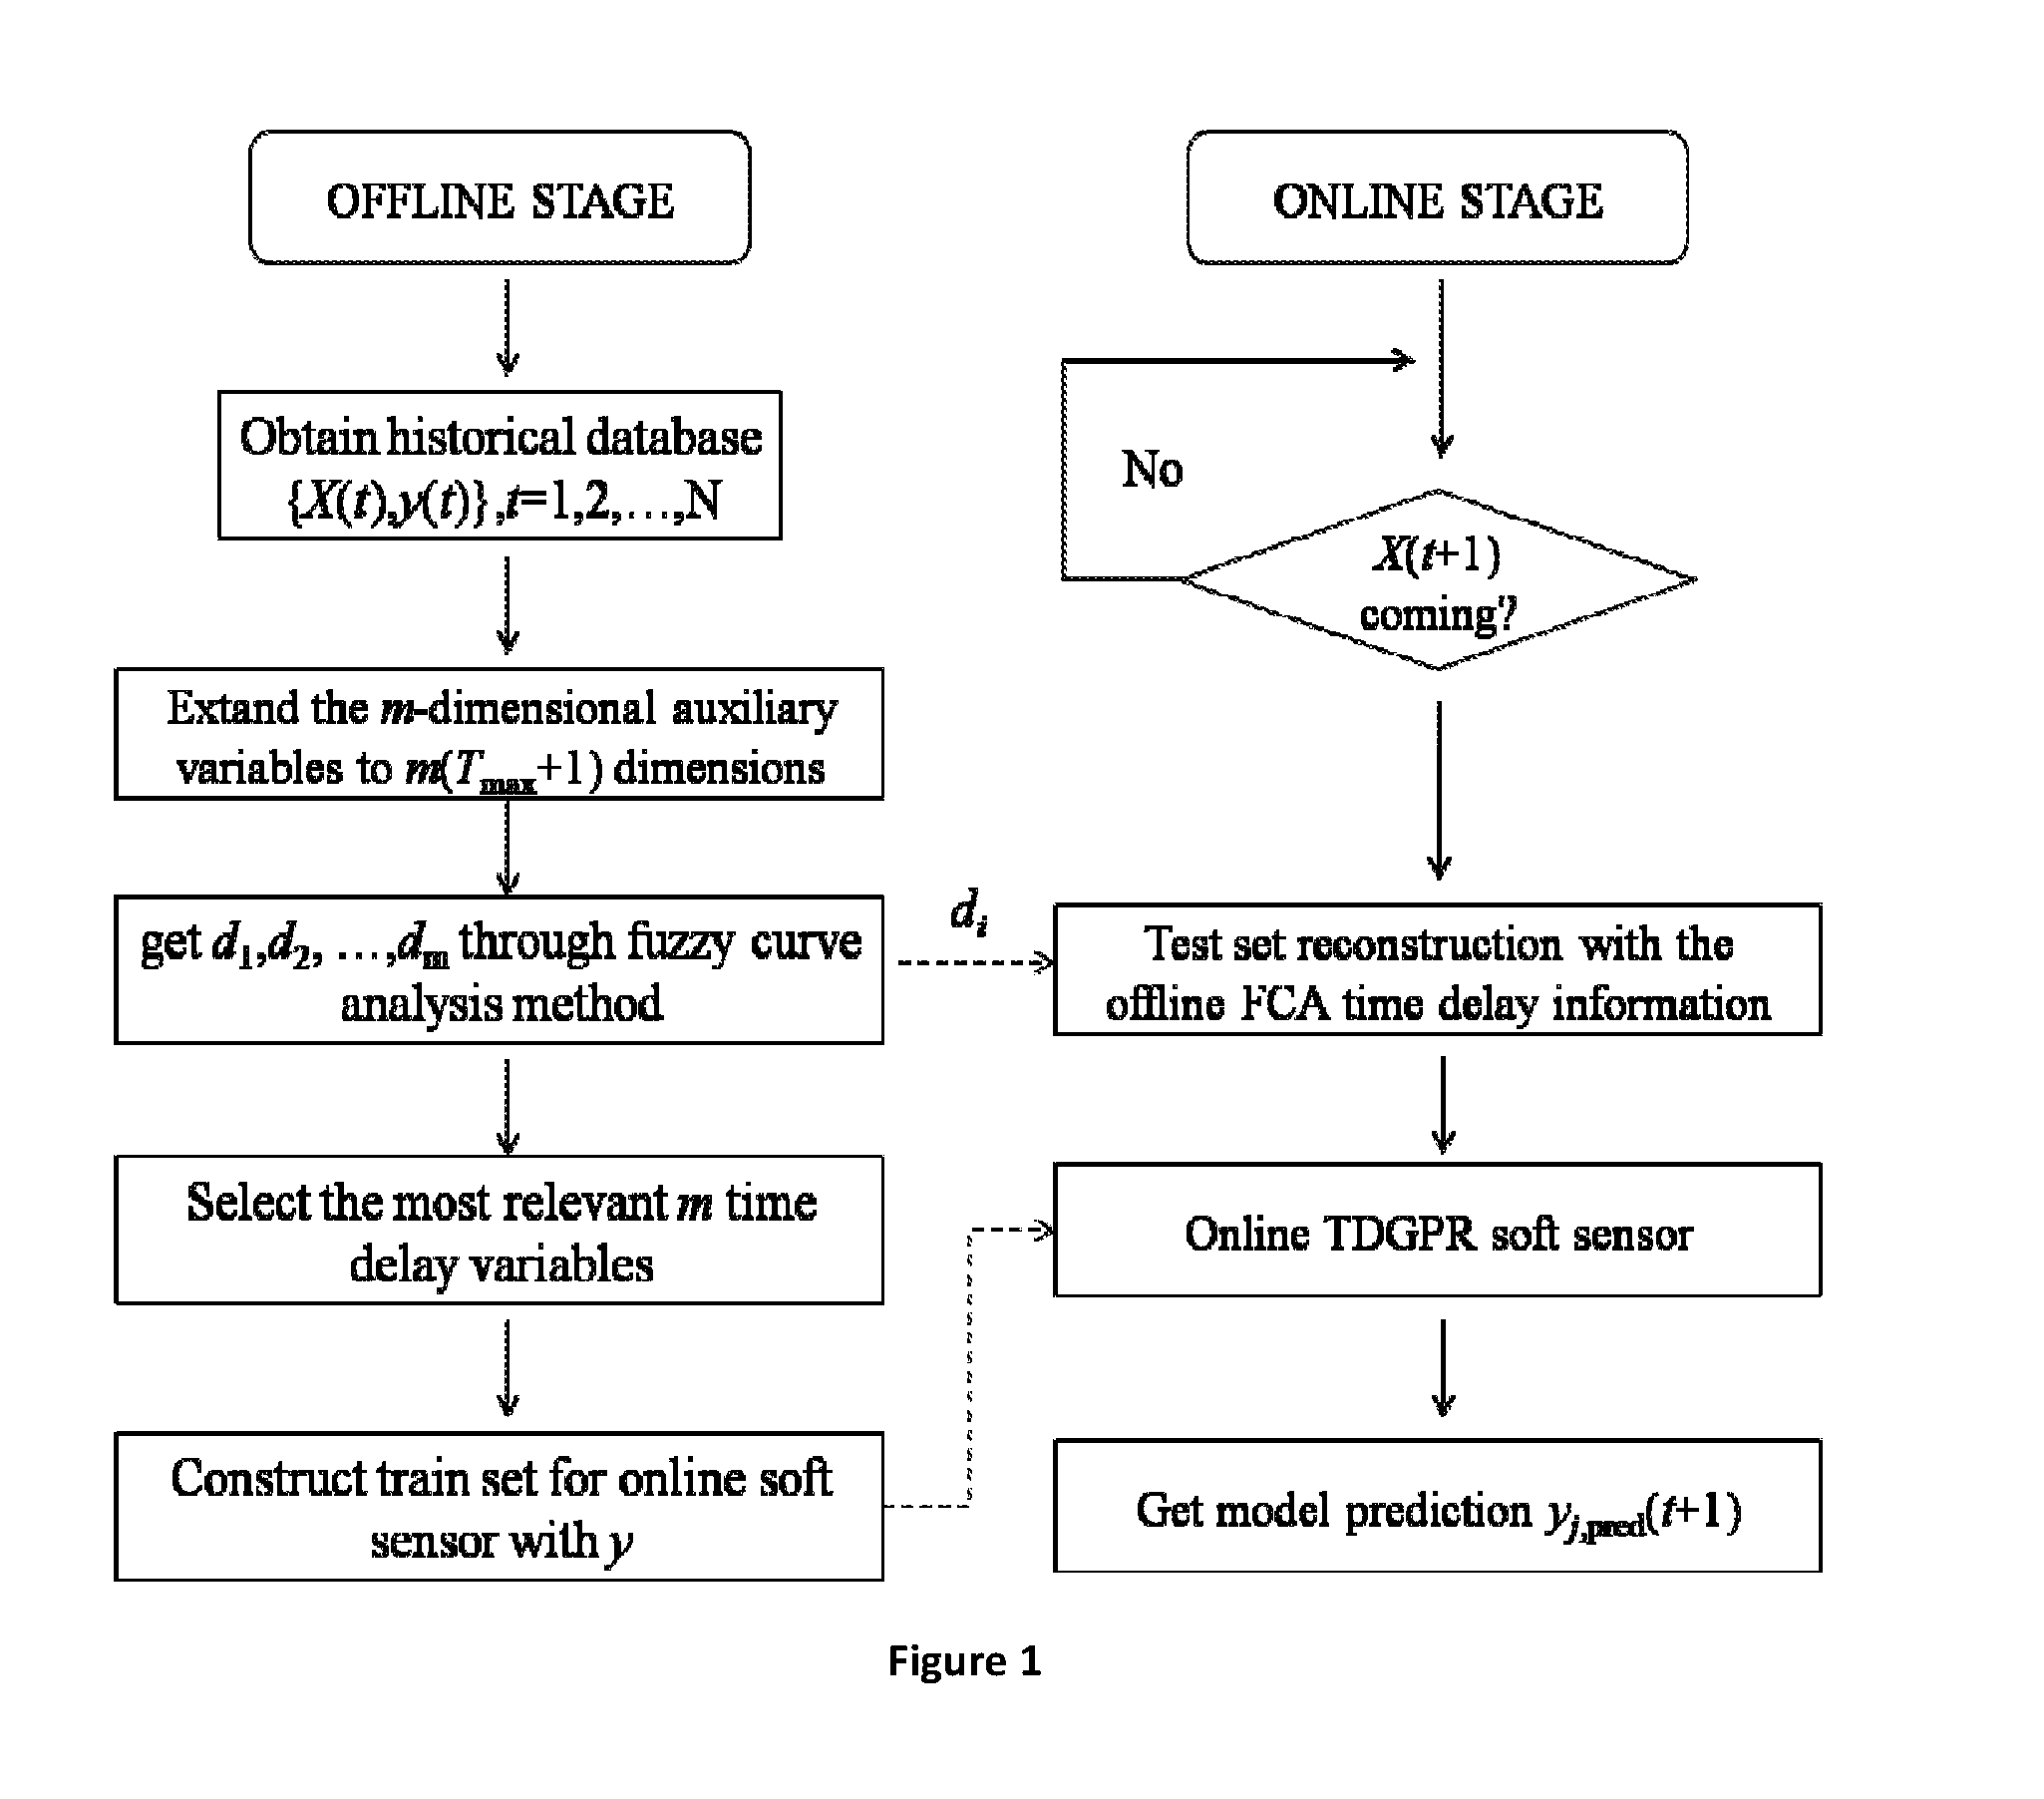
[0020]The modeling flow chart, which is shown in FIG. 1 below, is further detailed in the present invention:

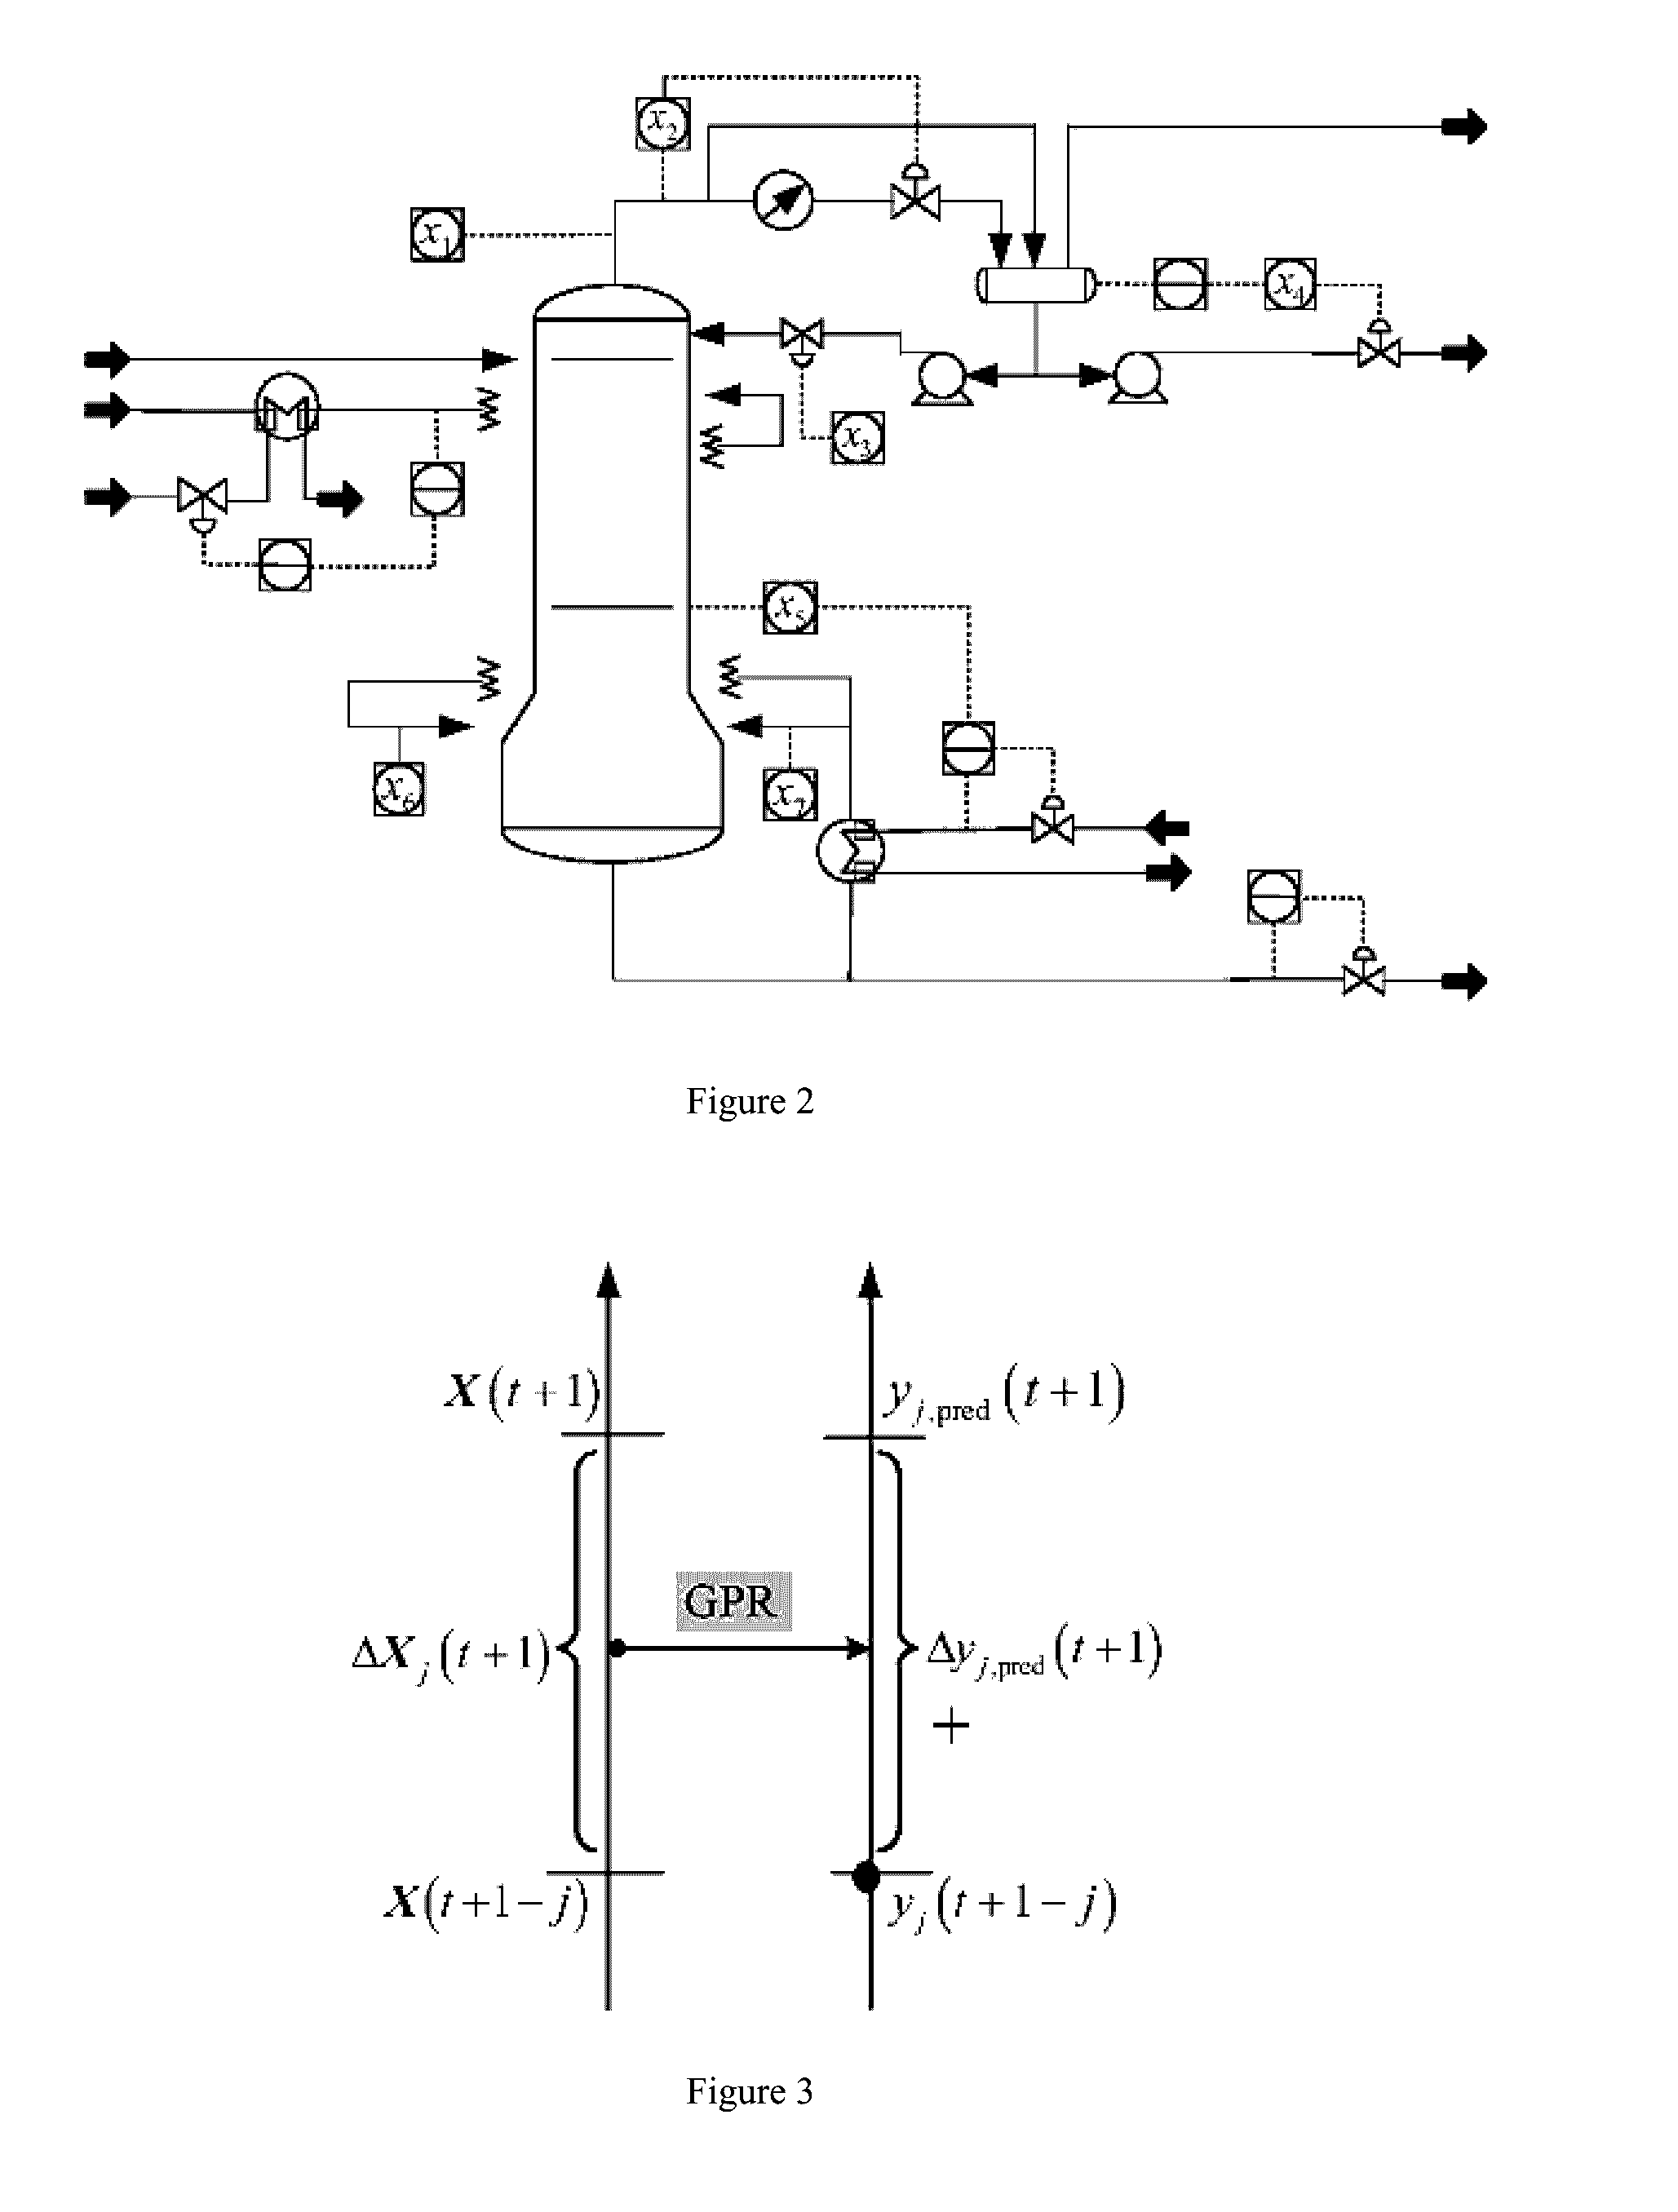
[0021]Take the actual chemical process as an example, debutanizer is an important part of naphtha desulfurization and separation device of oil refining production process, and one of the dominant variables needed to be controlled for this process is the concentration of the bottom butane (C4). The schematic diagram of the process is shown in FIG. 2, due to the value of C4 cannot be directly measured, therefore, there is a delay issue in analyzing and obtaining C4 concentration values. At the same time, different auxiliary variables show different degrees of time delay. Experimental data is derived from the actual industrial process which contains 2394 samples, a total of 7 auxiliary variables. As shown in FIG. 2, x1 is the top temperature; x2 is the top pressure; x3 is the reflux flow; x4 is the top product outflow; x5 is the 6th tray temperature; x6 is the bottom temperature ...


PUM


Abstract

The invention provides a fuzzy curve analysis based soft sensor modeling method using time difference Gaussian process regression, it is suitable for application in chemical process with time delay characteristics. This method can extract stable delay information from the historical database of process and introduce more relevant modeling data sequence to the dominant variable sequence. First of all, the method of fuzzy curve analysis (FCA) can intuitively judge the importance of the input sequence to the output sequence, estimate the time-delay parameters of process, and such offline time-delay parameter set can be utilized to restructure the modeling data. For the new input data, based on the historical variable value before a certain time, the current dominant value can be predicted by time difference Gaussian Process Regression (TDGPR) model. This method does not encounter the problem of model updating and can effectively track the drift between input and output data. Compared with steady-state modeling methods, this invention can achieve more accurate predictions of the key variable, thus improving product quality and reducing production costs.

Description

CROSS-REFERENCES AND RELATED APPLICATIONS[0001]This application claims the benefit of priority to Chinese Application No. 201510541727.5, entitled “A fuzzy curve analysis based soft sensor modeling method using time difference Gaussian process regression”, filed on Aug. 28, 2015, which is herein incorporated by reference in its entirety.BACKGROUND OF THE INVENTION[0002]Field of the Invention[0003]The invention relates to a fuzzy curve analysis based time difference Gaussian process regression soft sensor modeling method (FCA-TDGPR), and belongs to the field of complex industrial process modeling and soft sensing.[0004]Description of the Related Art[0005]The traditional soft sensor modeling methods mostly consider the characteristics of zero delay, that is, considering the input and output with the same sampling interval and input variable collected at time t corresponds to the t-th dominant variable sample in the database. However, there is a significant time lag between the input d...

Claims


Application Information

Patent Timeline
Patent Type & Authority Applications(United States)
IPC IPC(8): G06N5/04G06N5/02
CPCG06N5/022G06N5/048F23N2223/52
Inventor XIONG, WEILILI, YANJUNXUE, MINGCHEN
Owner JIANGNAN UNIV
Why Eureka
Try Eureka