Automated network diagnostic techniques

a network diagnostic and network technology, applied in the direction of electrical equipment, wireless communication, transmission, etc., can solve the problems of significant and persistent performance degradation and user dissatisfaction, device may not support the newer wi-fi standard used by the router, and the device may not support the newer wi-fi standard

Active Publication Date: 2017-12-14
HUGHES NETWORK SYST
View PDF3 Cites 35 Cited by
  • Summary
  • Abstract
  • Description
  • Claims
  • Application Information

AI Technical Summary

Problems solved by technology

While advancements are continuously being made in the Wi-Fi protocols and devices to support higher data rates, poor WLAN setup and unanticipated conditions in the environment can lead to significant and persistent performance degradation and user dissatisfaction.
Thus, although Wi-Fi standards have evolved to theoretically deliver high maximum data rates (in some cases, upwards of 1 Gbps), poor placement of devices, misconfiguration of devices, and environmental issues can substantially reduce throughput and reliability in practice.
Plus, a client device may fail to support a newer Wi-Fi standard used by a router; the consequences of this may include the client device not utilizing all of a router's capabilities, or other client devices experiencing reduced performance.
Additionally, a client device may, even when the client device supports the appropriate Wi-Fi standard and link conditions are good, experience poor performance due to the client device having limited CPU or memory resources which become overloaded and cause received data to be consumed slowly.
For home area networks, although some Wi-Fi routers may measure some basic Wi-Fi link quality metrics, such as link quality, transmit rate, and error rate, they only give an indication of the current WLAN health and do not provide enough information to identify some of the commonly experienced problems, generally do not provide meaningful summaries for end users, or remedies for problems.
However, such statistics are measured, stored, and presented in a manner directed towards individuals with the skills and expertise or network admins and Wi-Fi-domain experts, and are not summarized and presented in a way useful to a layman.
Additionally, such hardware does not provide an algorithmic way of identifying the presence of, main causes of, and solutions for performance bottlenecks.
For broadband service providers (which may also be referred to as “ISPs” (Internet service providers), the problem of troubleshooting performance issues is both difficult and important.
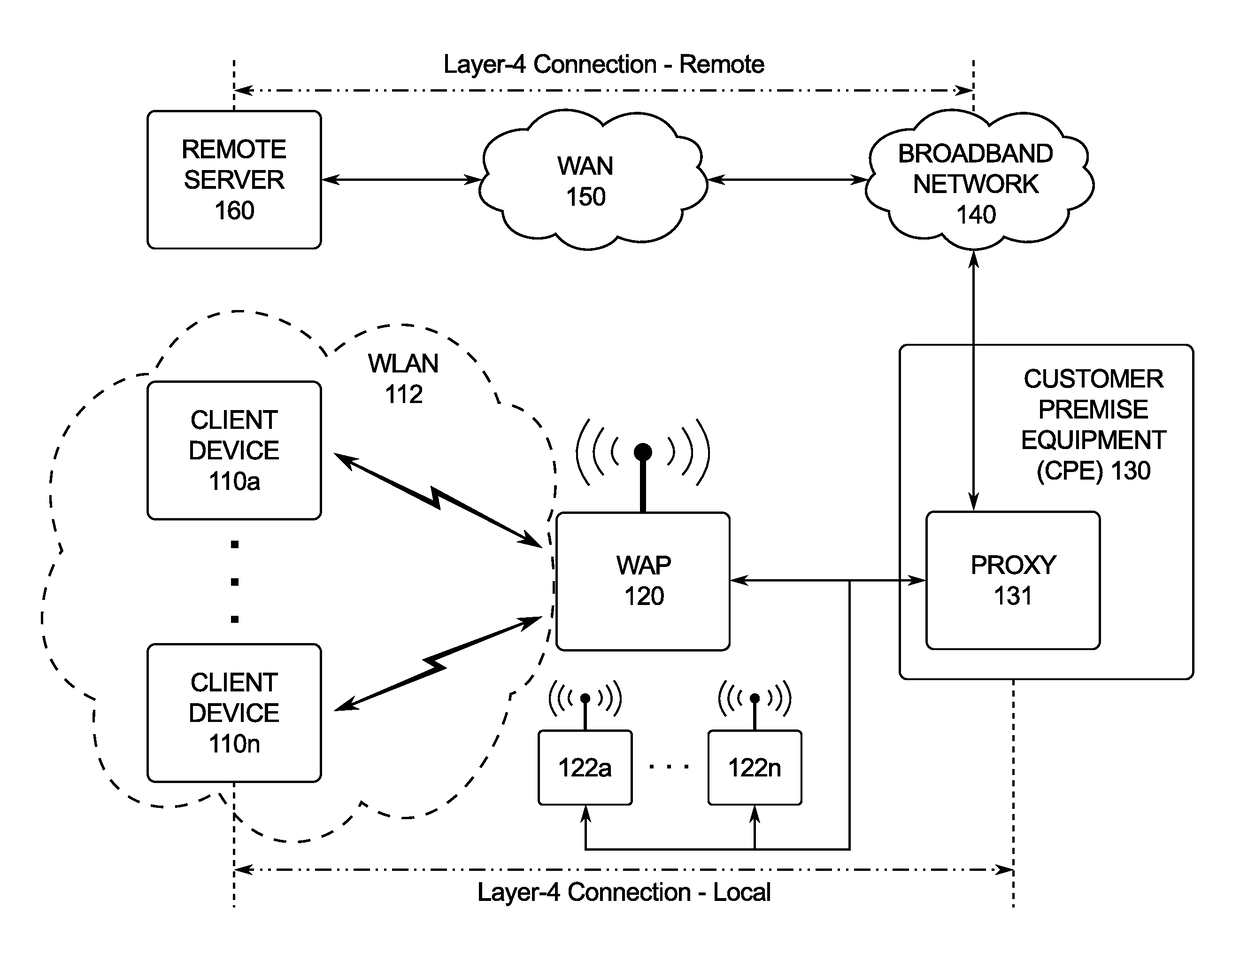
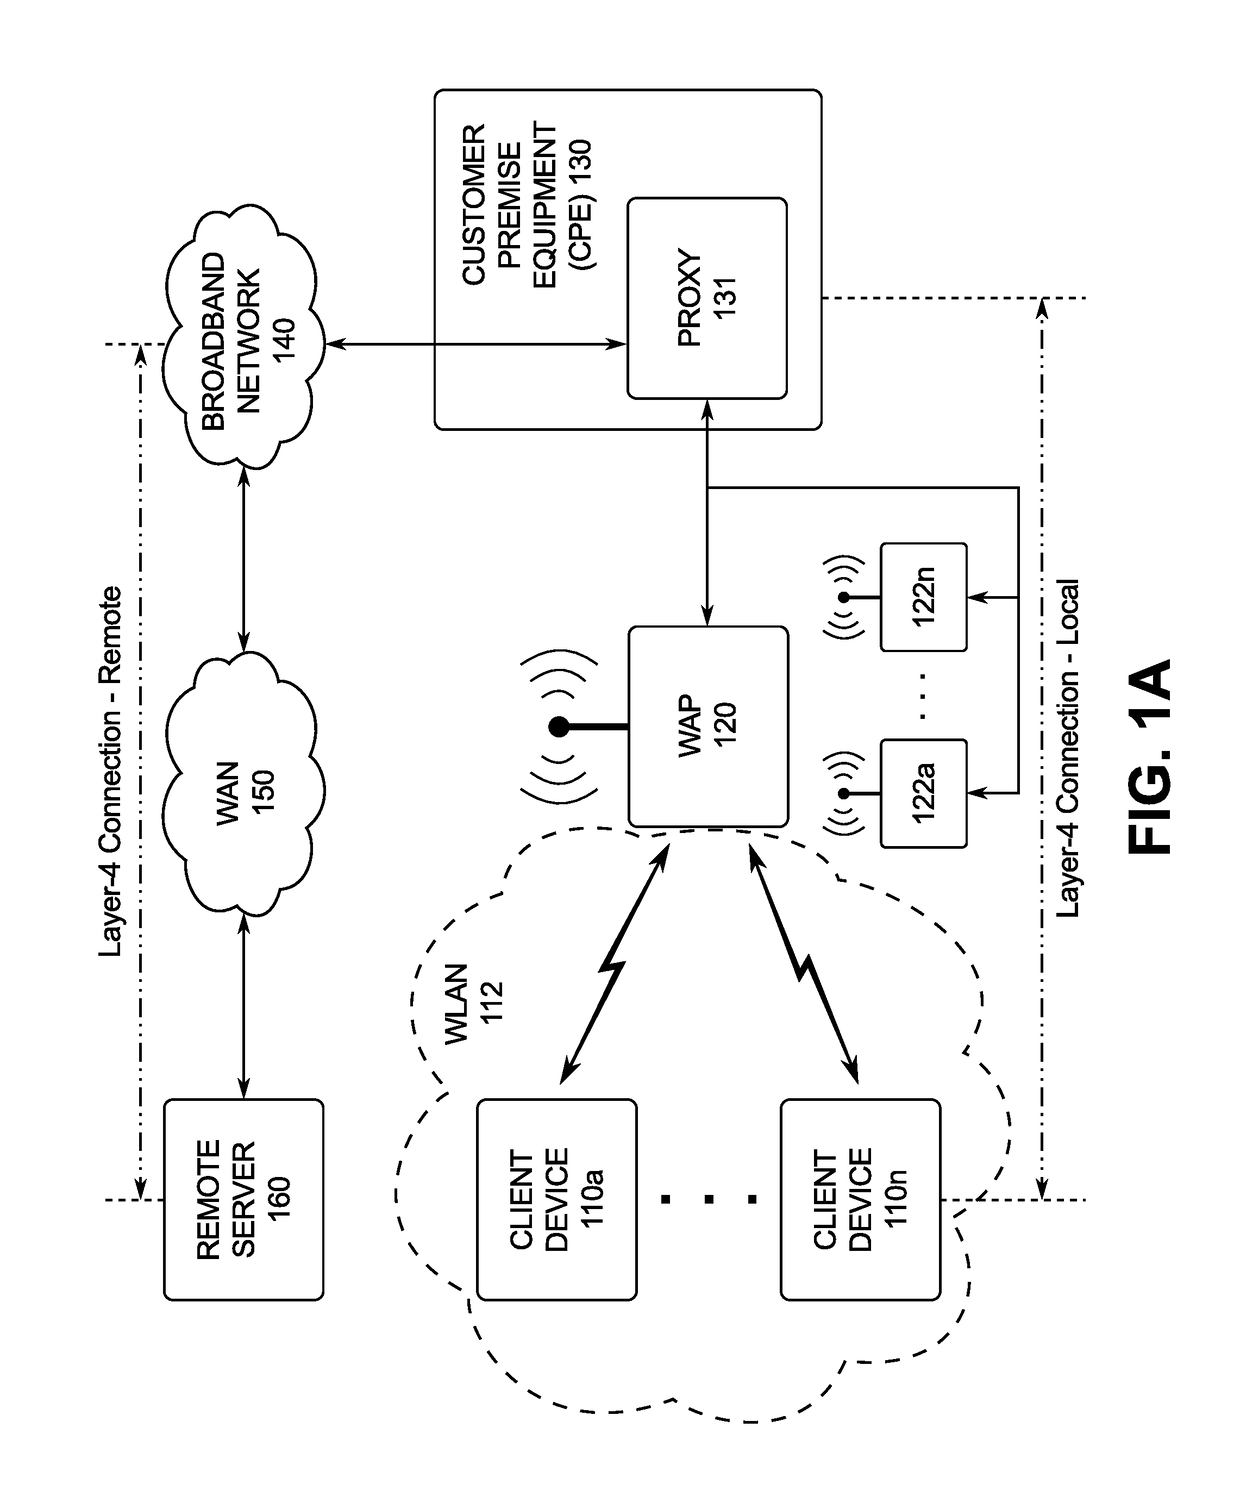
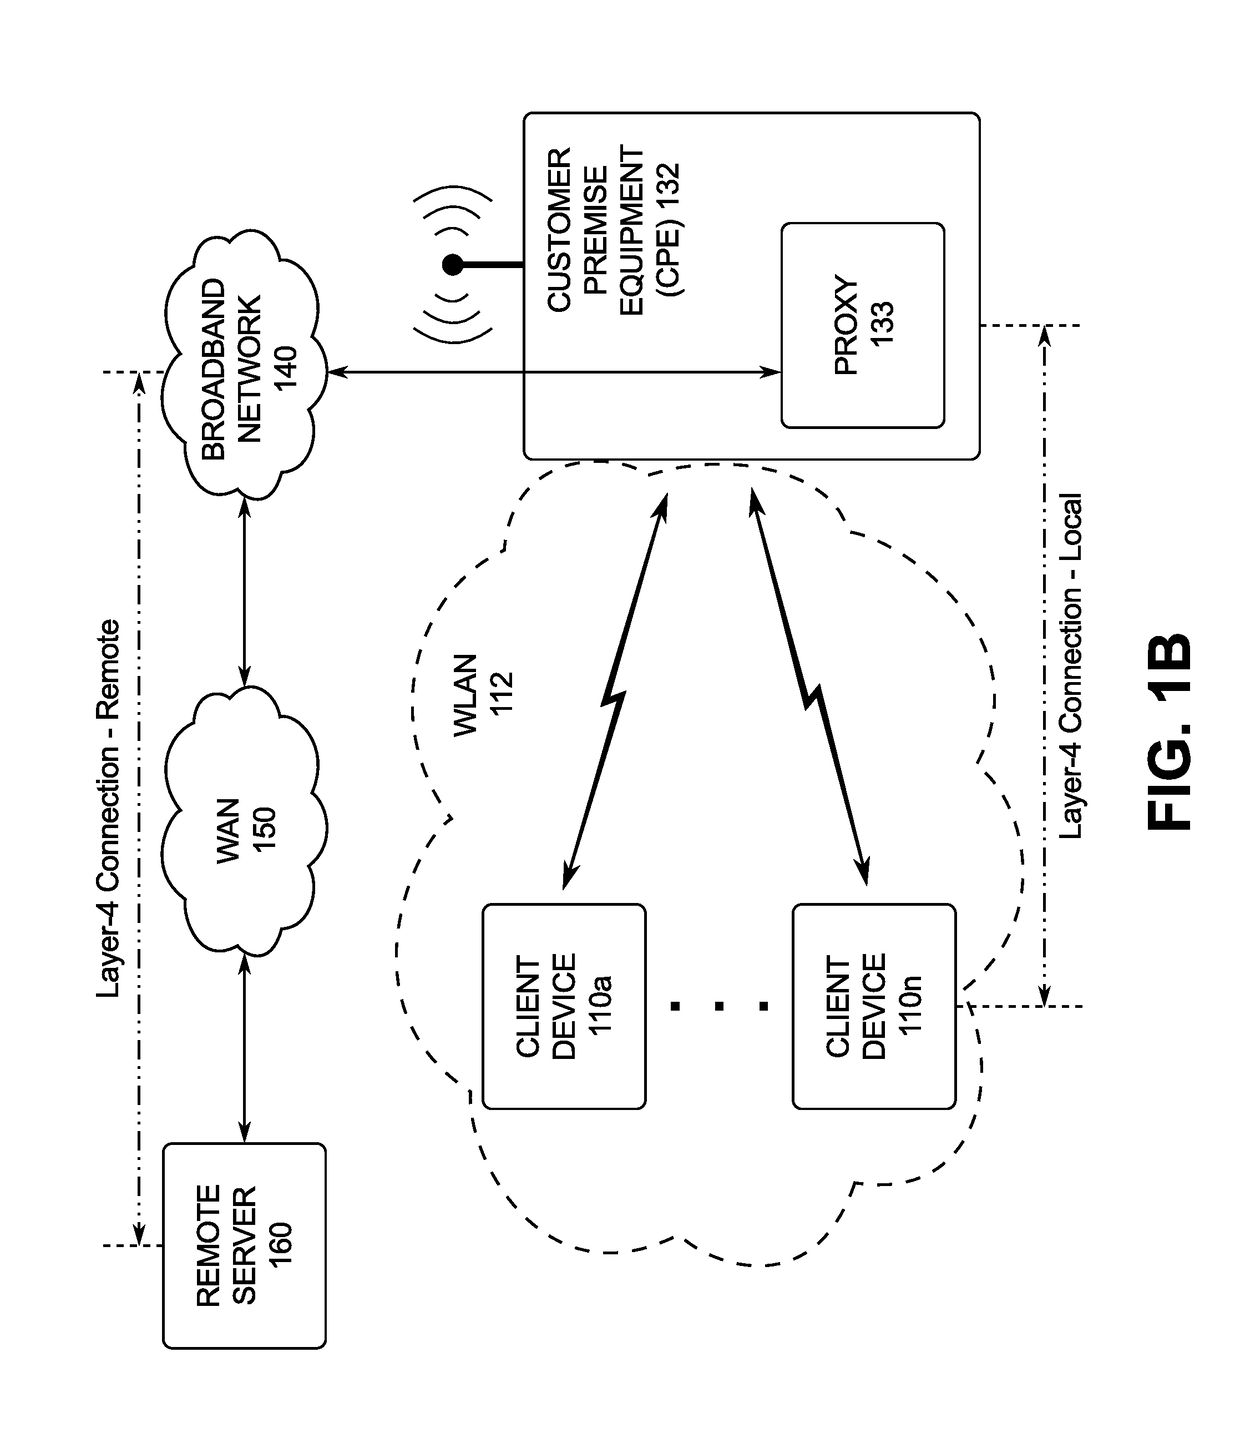
The problem is difficult because in many configurations customers provide their own WLAN hardware, which usually is not directly accessible to or configurable by a broadband service provider.
The problem is also important, as the broadband service provider is often one of the first places a customer contacts when experiencing networking issues, even if such issues arise from WLAN hardware neither provided by nor under the control of the broadband service provider.
Given the large variations in RTT, looking at absolute value of the CWND statistics alone does not help.
Even though the WLAN link may have high bandwidth, the client device may not be able to effectively use the available bandwidth due to memory restrictions or other flow control bases.
Lastly, although flow-control by the client device is captured, the zero window events are not sufficiently captured by this connection metric.
While connection metrics like WU and RWU address flow-control by the client device, some extreme zero window cases are not sufficiently addressed.
Sample averages for this scenario may not capture the device bottleneck, especially when the sample average will be skewed when the window opens up.
The shared nature of the wireless channel and its varying channel conditions result in time variations.
Further, the Avg_SRTT metric assumes that high SRTT is due to poor link conditions.
However, RTT can be increased due to peculiar settings of the home network configuration, where queuing delays can be introduced due to segmentation offloading, traffic shaping or heavy buffering in the wireless access point.
Including such RTT samples, however, can skew the averages, hence the metric needs to be interpreted appropriately.
Applications like Youtube and Netflix will have low goodput because of time-spacing while downloading the video segments.
This estimate, however, can be inaccurate in many cases.
Secondly, if the sender does not send a sufficient number of packets, the WND variable may not be updated to reflect true value of the send window that can be reached.
Also, if Avg_LU≦Full_AvgLU_Threshold, then the link was not fully utilized, and the LinkCapacity estimate may not be accurate.
Queuing of packets in the path between a CPE (such as CPE 130 illustrated in FIG. 1A) and a client device can impact RTT values, which (in some cases) can lead to incorrect inferences from the Avg_SRTT metric.
High losses on a MARGINALLY GOOD connection will typically result in high jitter.
For a POOR condition, there is a significant fraction of zero wait time (indicating a client device receive buffer bottleneck), the send window is fully utilized but connection bandwidth is low, or the WLAN connection has high losses as well as moderate to low bandwidth.
Connections with a small number of ACKs may not yield enough samples to arrive at meaningful connection metrics.
Also, connections that are active with short durations within a Sample_Interval (time between first and last ACK sample within a Sample_Interval), may yield biased results, and may not reflect the average link conditions.
The congestion, however, may be a result of a lot of connections within the client network, and not necessarily congestion from neighboring home area networks.
This may be a result of, for example, the client device being in a poor physical location or orientation (for example, an antenna may be poorly positioned) and / or the wireless access point being in a poor physical location or orientation.

Method used


Image

  • Automated network diagnostic techniques
  • Automated network diagnostic techniques
  • Automated network diagnostic techniques

Examples


Embodiment Construction

[0025]In the following detailed description, numerous specific details are set forth by way of examples in order to provide a thorough understanding of the relevant teachings. However, it should be apparent that the present teachings may be practiced without such details. In other instances, well known methods, procedures, components, and / or circuitry have been described at a relatively high-level, without detail, in order to avoid unnecessarily obscuring aspects of the present teachings.

[0026]FIG. 1A illustrates an example of a high-level block diagram of an end-to-end network architecture for automatically diagnosing operation of one or more wireless communication networks, such as a wireless network provided by wireless access point (or “WAP”) 120 for one or more client devices 110a to 110n. Wireless access point 120 provides wireless data communication for client devices, such as client devices 110a to 110n. The physical layer for wireless access point 120 may be based on, for e...


PUM


Abstract

Automatically diagnosing operation of a communication network, including collecting, during a plurality of time periods, a plurality of Layer-4 and / or Layer-1 / -2 statistics for network activity on the communication network; determining a network performance indicator, based on the statistics collected during a first time period included in the time periods and the statistics collected during a second time period included in the time periods and neither overlapping nor consecutive with the first time period; determining whether the communication network has experienced a performance issue based on the network performance indicator; and causing a diagnostic action, a corrective action, or a maintenance action to be performed based on the determination whether the communication network has experienced a performance issue.

Description

CROSS-REFERENCE TO RELATED APPLICATIONS[0001]This application claims a benefit of priority to U.S. Provisional Patent Application No. 62 / 349,968, filed on Jun. 14, 2016 (entitled “Automated Network Diagnostic Techniques”) and U.S. Provisional Patent Application No. 62 / 364,839, filed on Jul. 20, 2016 (entitled “Automated Network Diagnostic Techniques”), each of which is incorporated by reference herein in their entireties.BACKGROUND[0002]Many consumer devices are adapted to utilize Wi-Fi or other wireless networking technologies to connect to the Internet. Thus, in both home and enterprise network installations, Wireless LAN (WLAN) conditions play an important role in the user experience. While advancements are continuously being made in the Wi-Fi protocols and devices to support higher data rates, poor WLAN setup and unanticipated conditions in the environment can lead to significant and persistent performance degradation and user dissatisfaction. With ever increasing speeds being d...

Claims


Application Information

Patent Timeline
Patent Type & Authority Applications(United States)
IPC IPC(8): H04W24/02H04W24/10H04W72/08H04W72/04H04W88/08
CPCH04W24/02H04W24/10H04W88/08H04W72/085H04W72/0453H04L43/04H04L43/062H04L43/0864H04L43/16H04L43/00H04W72/542
Inventor JAIN, KAUSTUBHJAVALI, NAGESH
Owner HUGHES NETWORK SYST
Why Eureka
Try Eureka