Method and kit for the detection of biliary tract cancer (as amended)
- Summary
- Abstract
- Description
- Claims
- Application Information
AI Technical Summary
Benefits of technology
Problems solved by technology
Method used
Image
Examples
example 1
ation of Biliary Tract Cancer Based on the Product of the Amounts of the APOA2-ATQ Protein in Blood and the APOA2-AT Protein in Blood
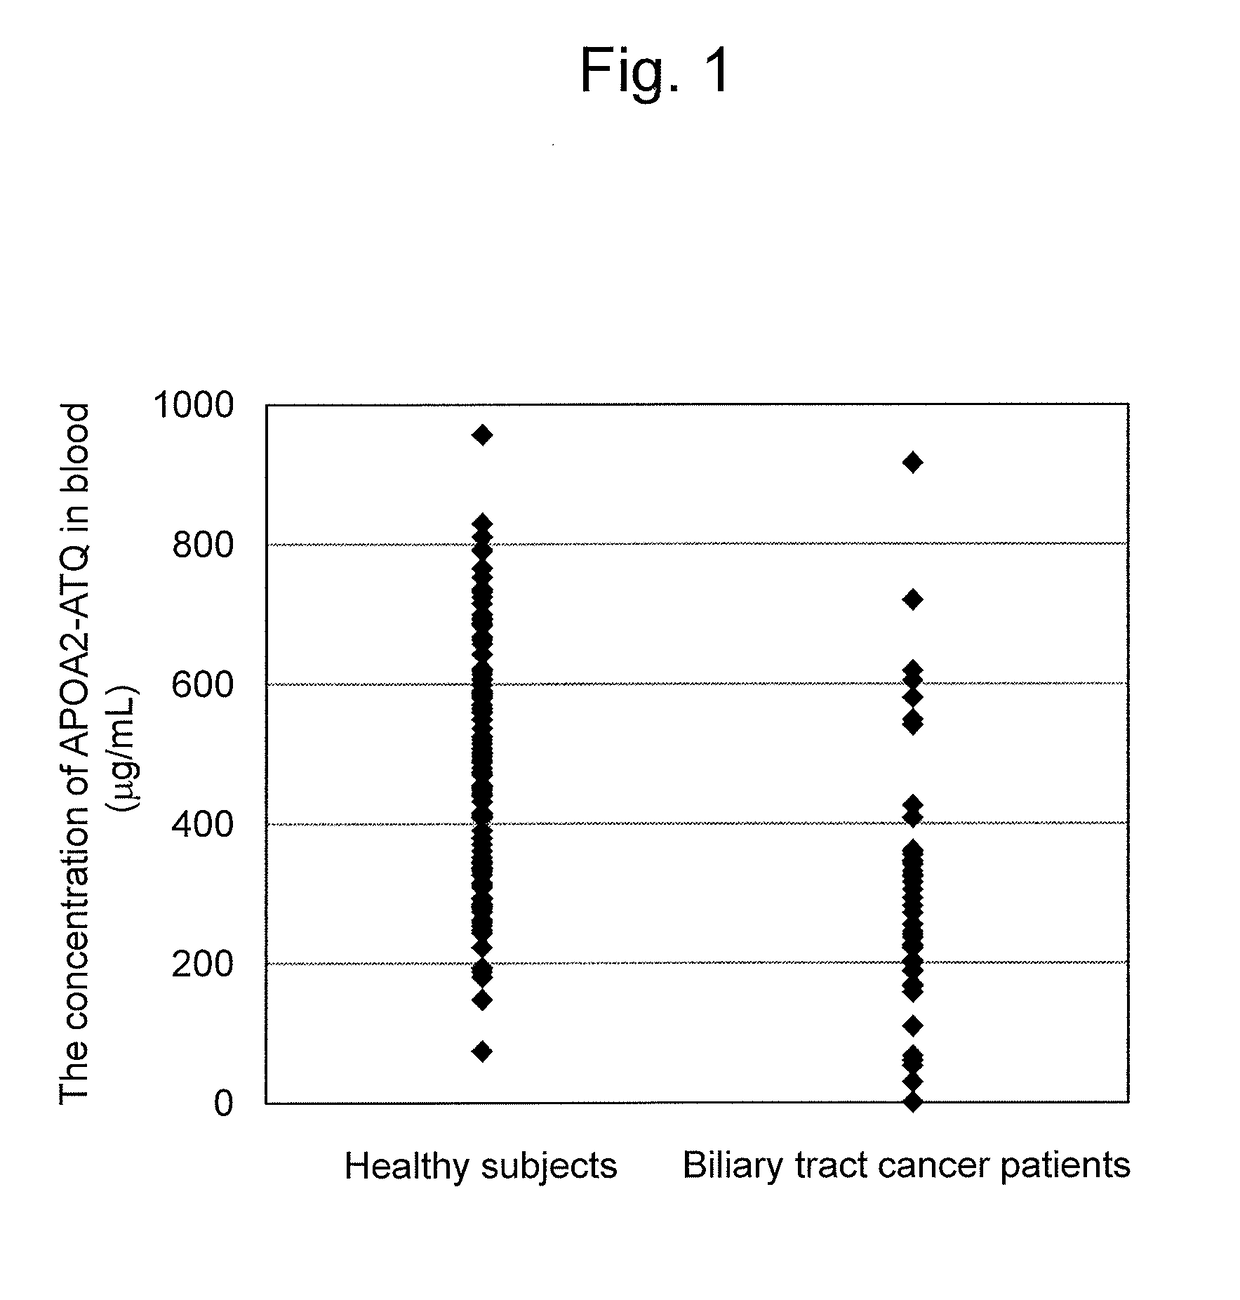
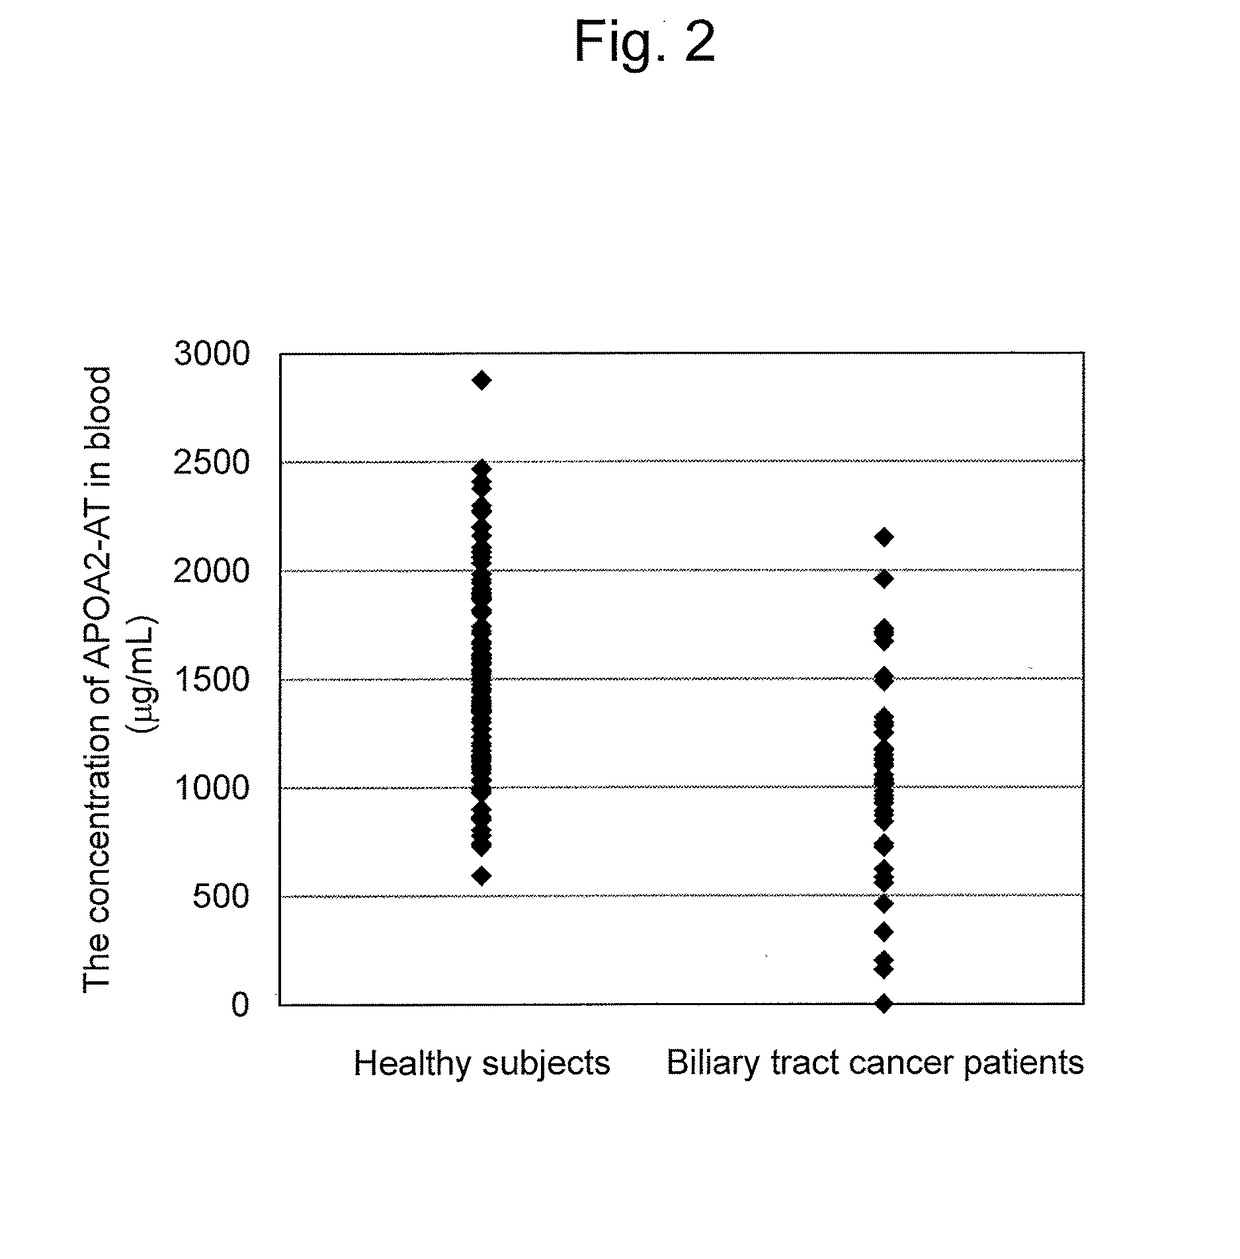
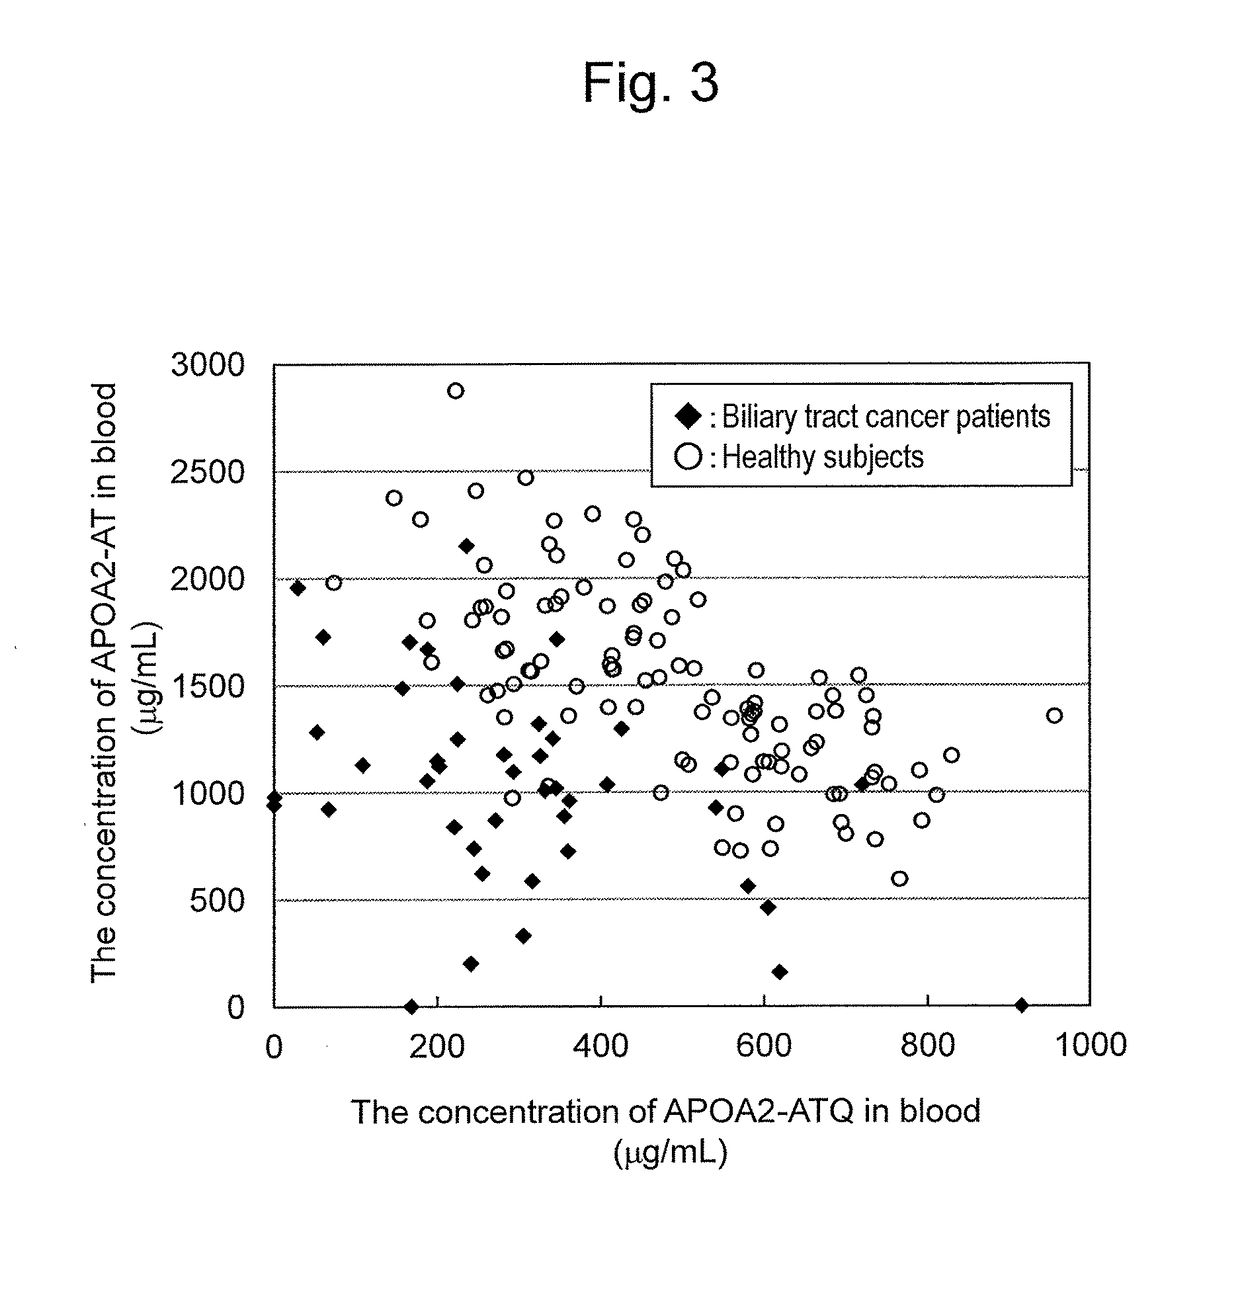
[0140]The results of Comparative Examples 1 and 2 indicated that the discrimination of biliary tract cancer patient and healthy subject using the measured amount of each of the APOA2 protein variants (APOA2-ATQ and APOA2-AT) had a low performance in the discrimination. Thus, the identification of biliary tract cancer was next attempted with a combination of the amounts of the above two APOA2 protein variants. In FIG. 3, a scatter plot of the concentrations of the APOA2-ATQ protein and the APOA2-AT protein in blood obtained in Comparative Examples 1 and 2, respectively, is shown. The result indicated that the difference in distribution between the healthy subjects and the biliary tract cancer patients was shown in the scatter plot. In FIG. 4, with regard to the healthy subjects and the biliary tract cancer patients, a plot of the product of the concentr...
example 2
ation of Biliary Tract Cancer with a Combination of the Amounts of the APOA2-ATQ Protein in Blood and the APOA2-AT Protein in Blood
[0143]The discrimination of healthy subject and biliary tract cancer patient was performed using the measured amounts of APOA2 protein variants, namely the APOA2-ATQ protein and the APOA2-AT protein, according to the statistical processing below. Logistic regression analysis was performed to obtain a discriminant function and an AUC value, in which the response variable was defined as “1” for biliary tract cancer patient and “0” for healthy subject and the measured values of the two APOA2 protein variants (the APOA2-ATQ protein and the APOA2-AT protein) obtained in Comparative Examples 1 and 2 were used as the explanatory variable. The yielded discriminant function was as shown below.
a×(APOA2-ATQ)+b×(APOA2-AT)+d, Formula 1:
wherein each of a, b and d is an optional real number except zero, APOA2-ATQ represents the measured value of the APOA2-ATQ protein...
example 3
ation of Biliary Tract Cancer the Amount of APOA2-ATQ Protein in Blood, the Amount of APOA2-AT Protein in Blood and the Product of the Amount of the APOA2-AT Protein in Blood
[0145]The discrimination of healthy subject and biliary tract cancer patient was performed using the measured amounts of APOA2 protein variants, namely the APOA2-ATQ protein and the APOA2-AT protein, and the product thereof according to the statistical processing below. Logistic regression analysis was performed to obtain a discriminant function and an AUC value, in which the response variable was defined as “1” for biliary tract cancer patient and “0” for healthy subject the measured values of the two APOA2 protein variants (the APOA2-ATQ protein and the APOA2-AT protein) obtained in Comparative Examples 1 and 2 and the product thereof were used as the explanatory variable. The yielded discriminant function was as shown below.
a×(APOA2-ATQ)+b×(APOA2-AT)+c×[(APOA2-ATQ)×(APOA2-AT)]+d, Formula 2:
wherein each of a...
PUM
 Abstract
Description
Claims
Application Information
 - R&D
- Intellectual Property
- Life Sciences
- Materials
- Tech Scout
- Unparalleled Data Quality
- Higher Quality Content
- 60% Fewer Hallucinations
Browse by: Latest US Patents, China's latest patents, Technical Efficacy Thesaurus, Application Domain, Technology Topic, Popular Technical Reports.
© 2025 PatSnap. All rights reserved.Legal|Privacy policy|Modern Slavery Act Transparency Statement|Sitemap|About US| Contact US: help@patsnap.com


