Flow cytometry data processing for antimicrobial agent sensibility prediction

a flow cytometry and antimicrobial agent technology, applied in the field of microorganism prediction of antimicrobial agent sensibility, can solve the problem that the mfi method fails to robustly quantify the subtle effect of an antimicrobial agen

Active Publication Date: 2019-11-21
BIOMERIEUX SA
View PDF0 Cites 0 Cited by
  • Summary
  • Abstract
  • Description
  • Claims
  • Application Information

AI Technical Summary

Benefits of technology

[0011]In particular, the MFI method fails to robustly quantify subtle effect of a antimi...

Problems solved by technology
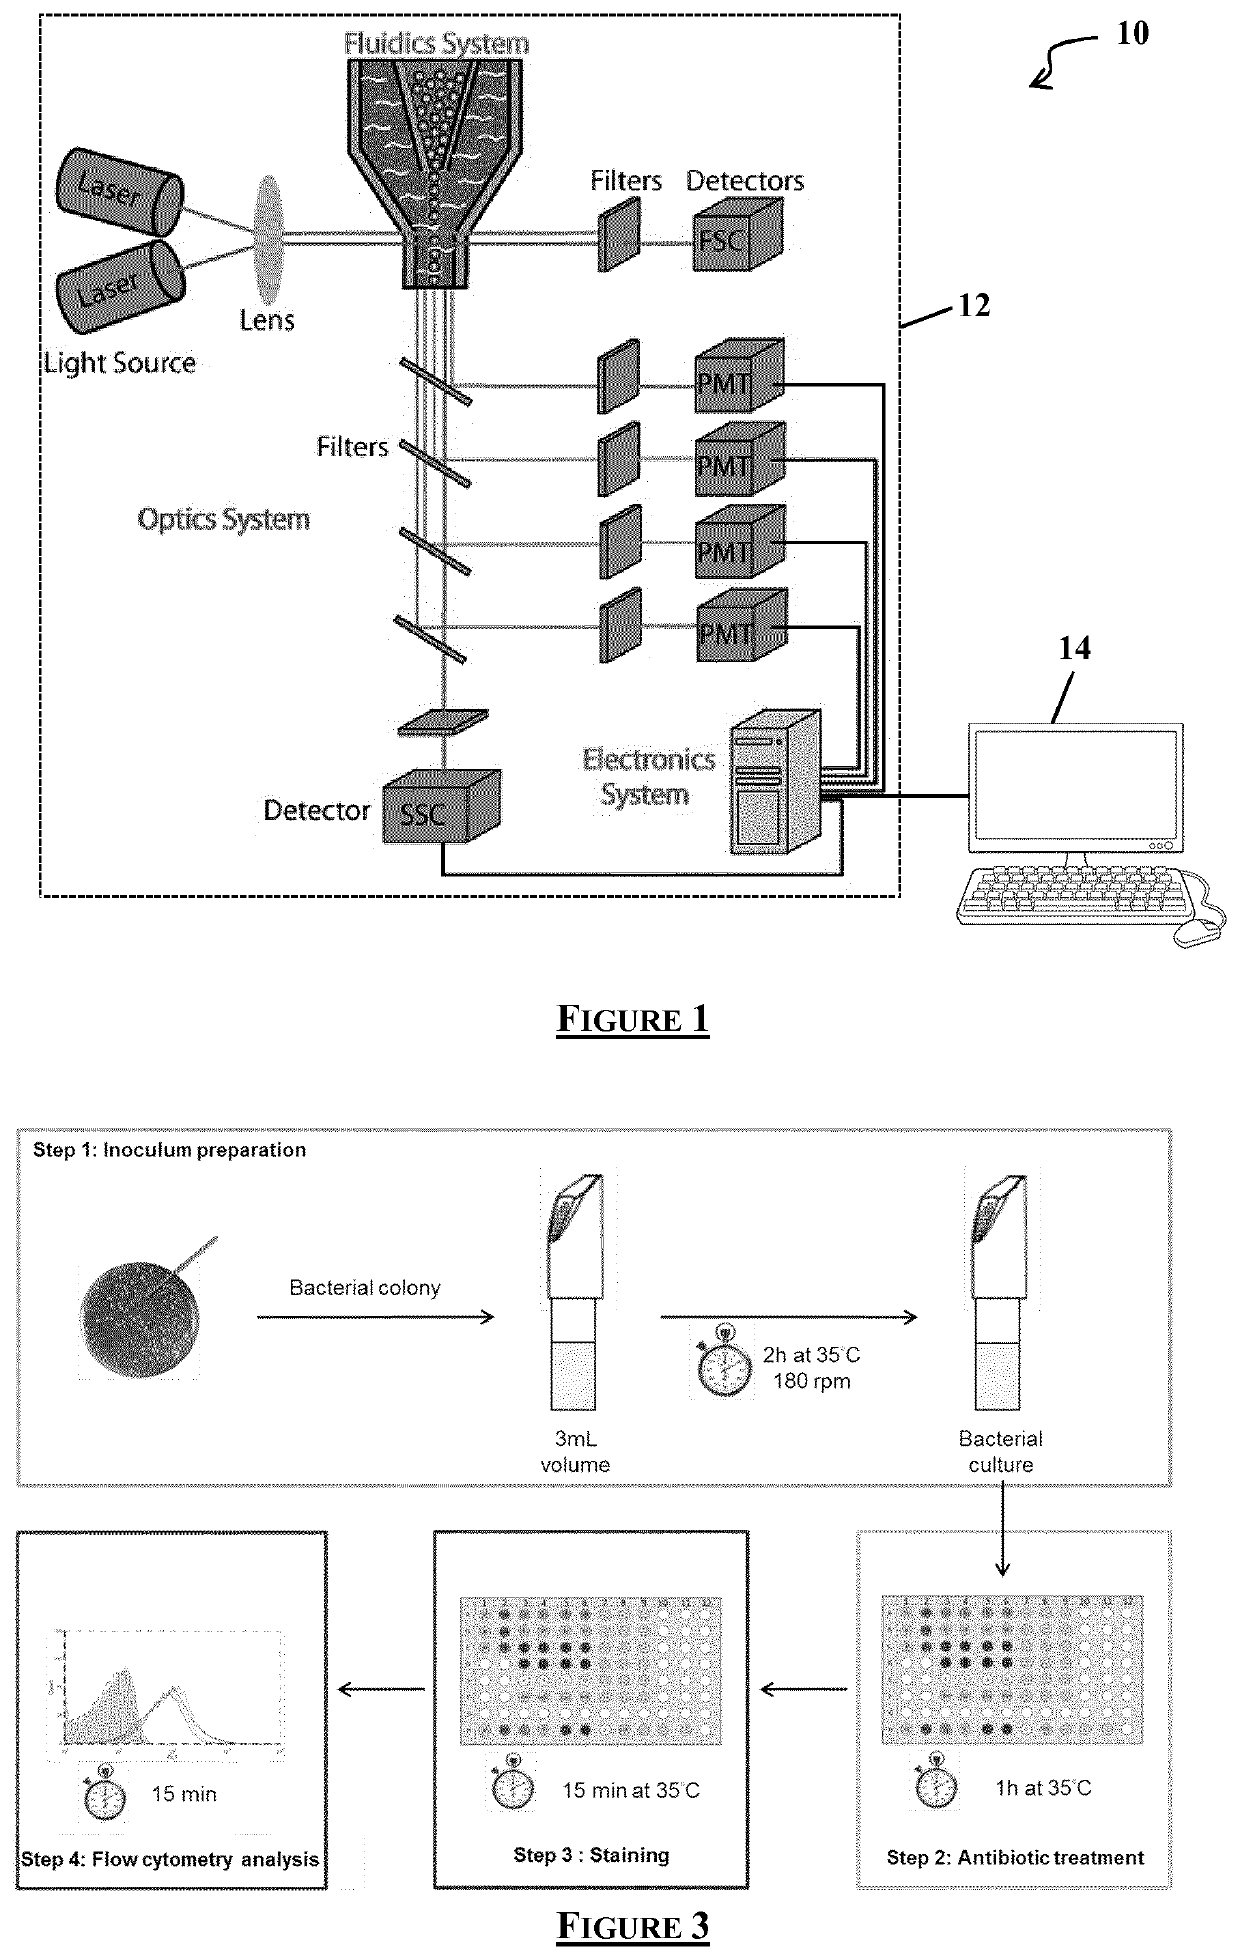
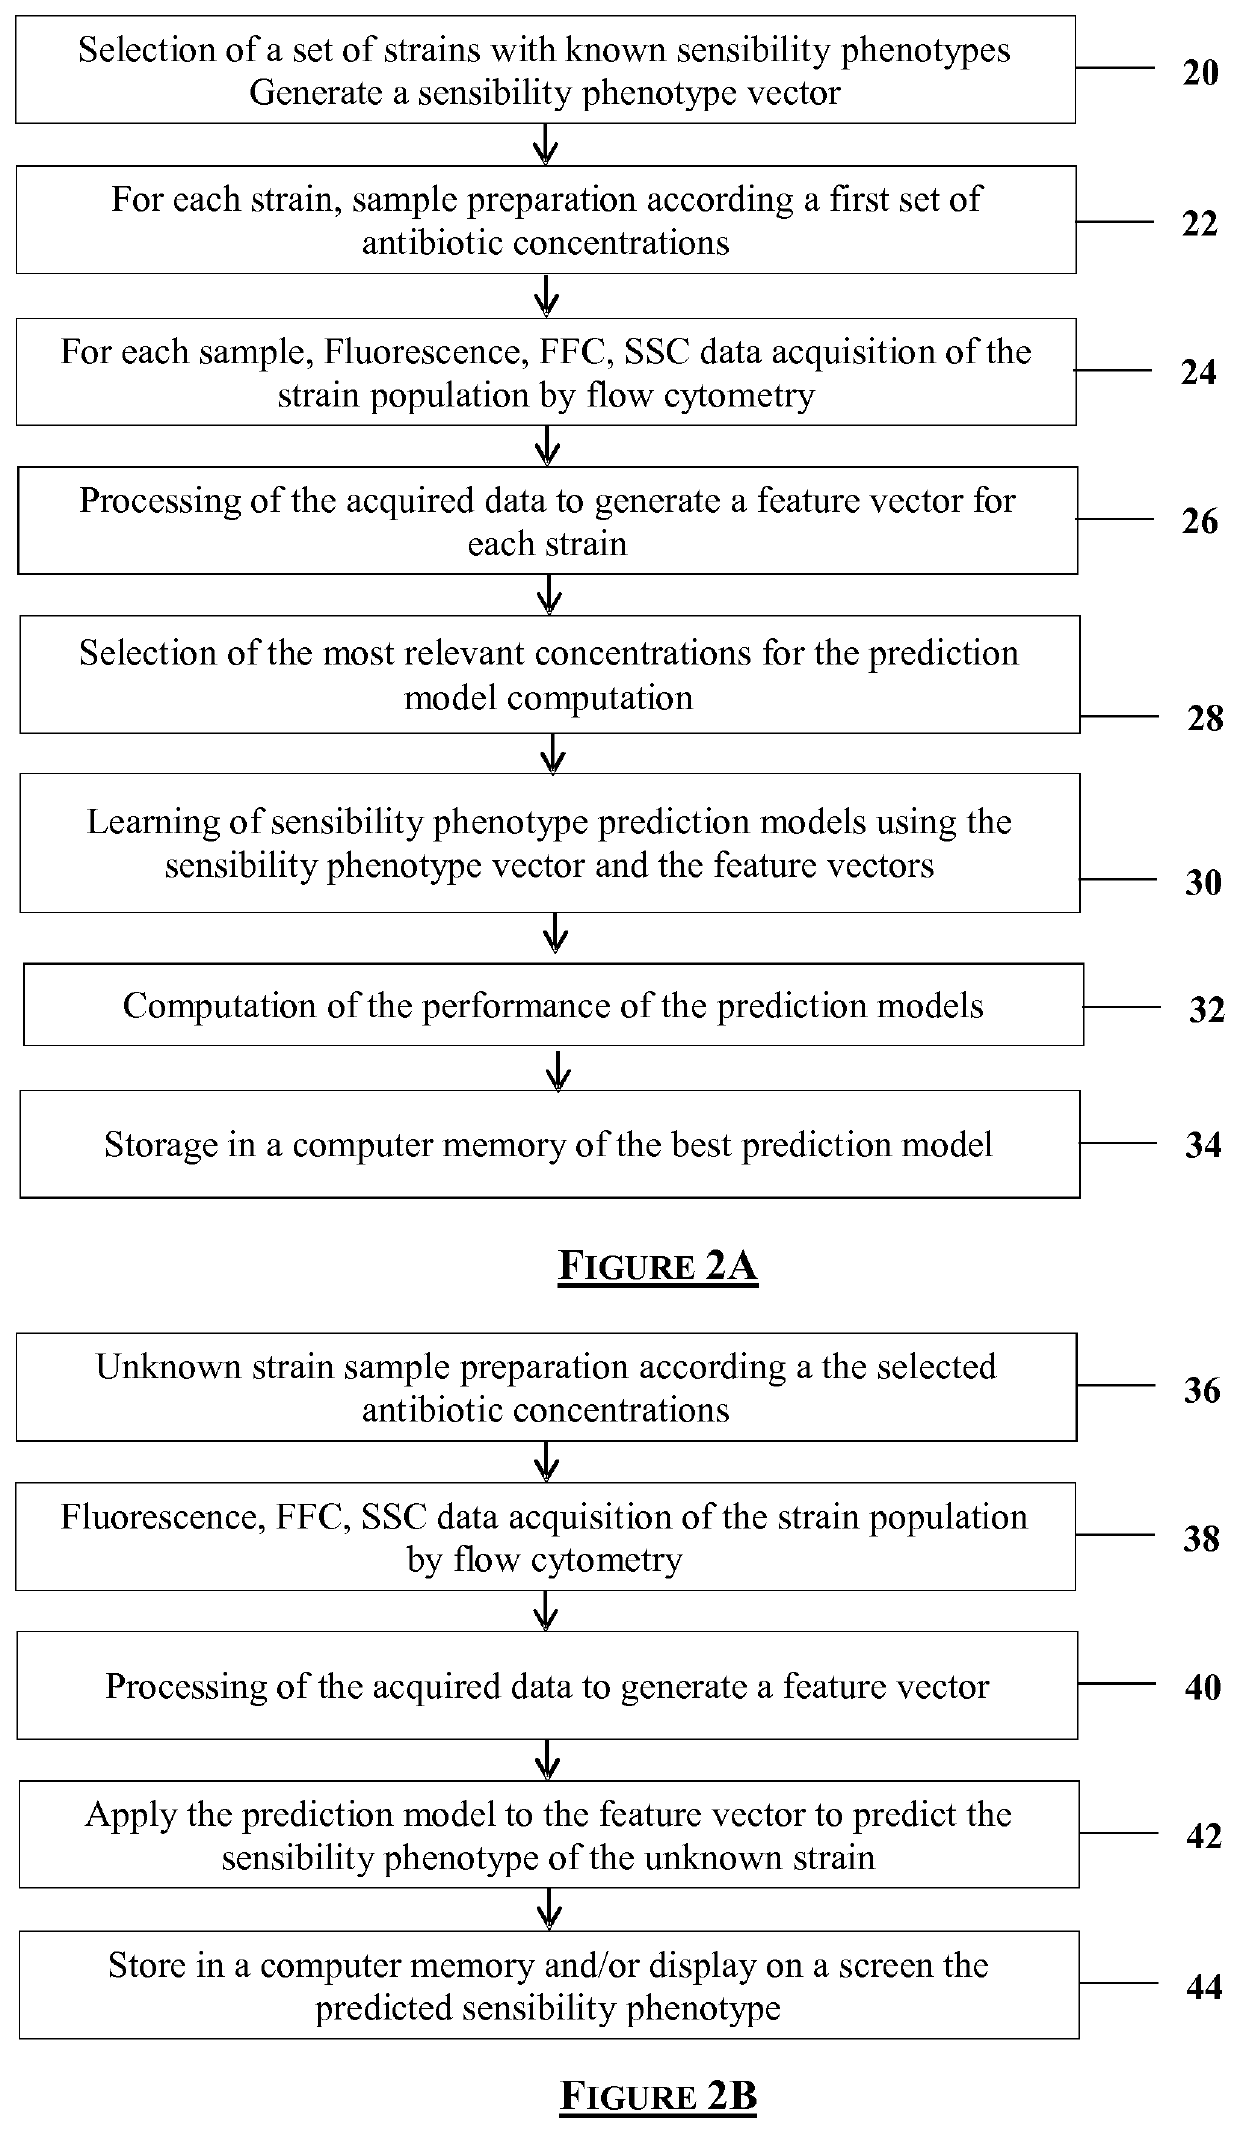
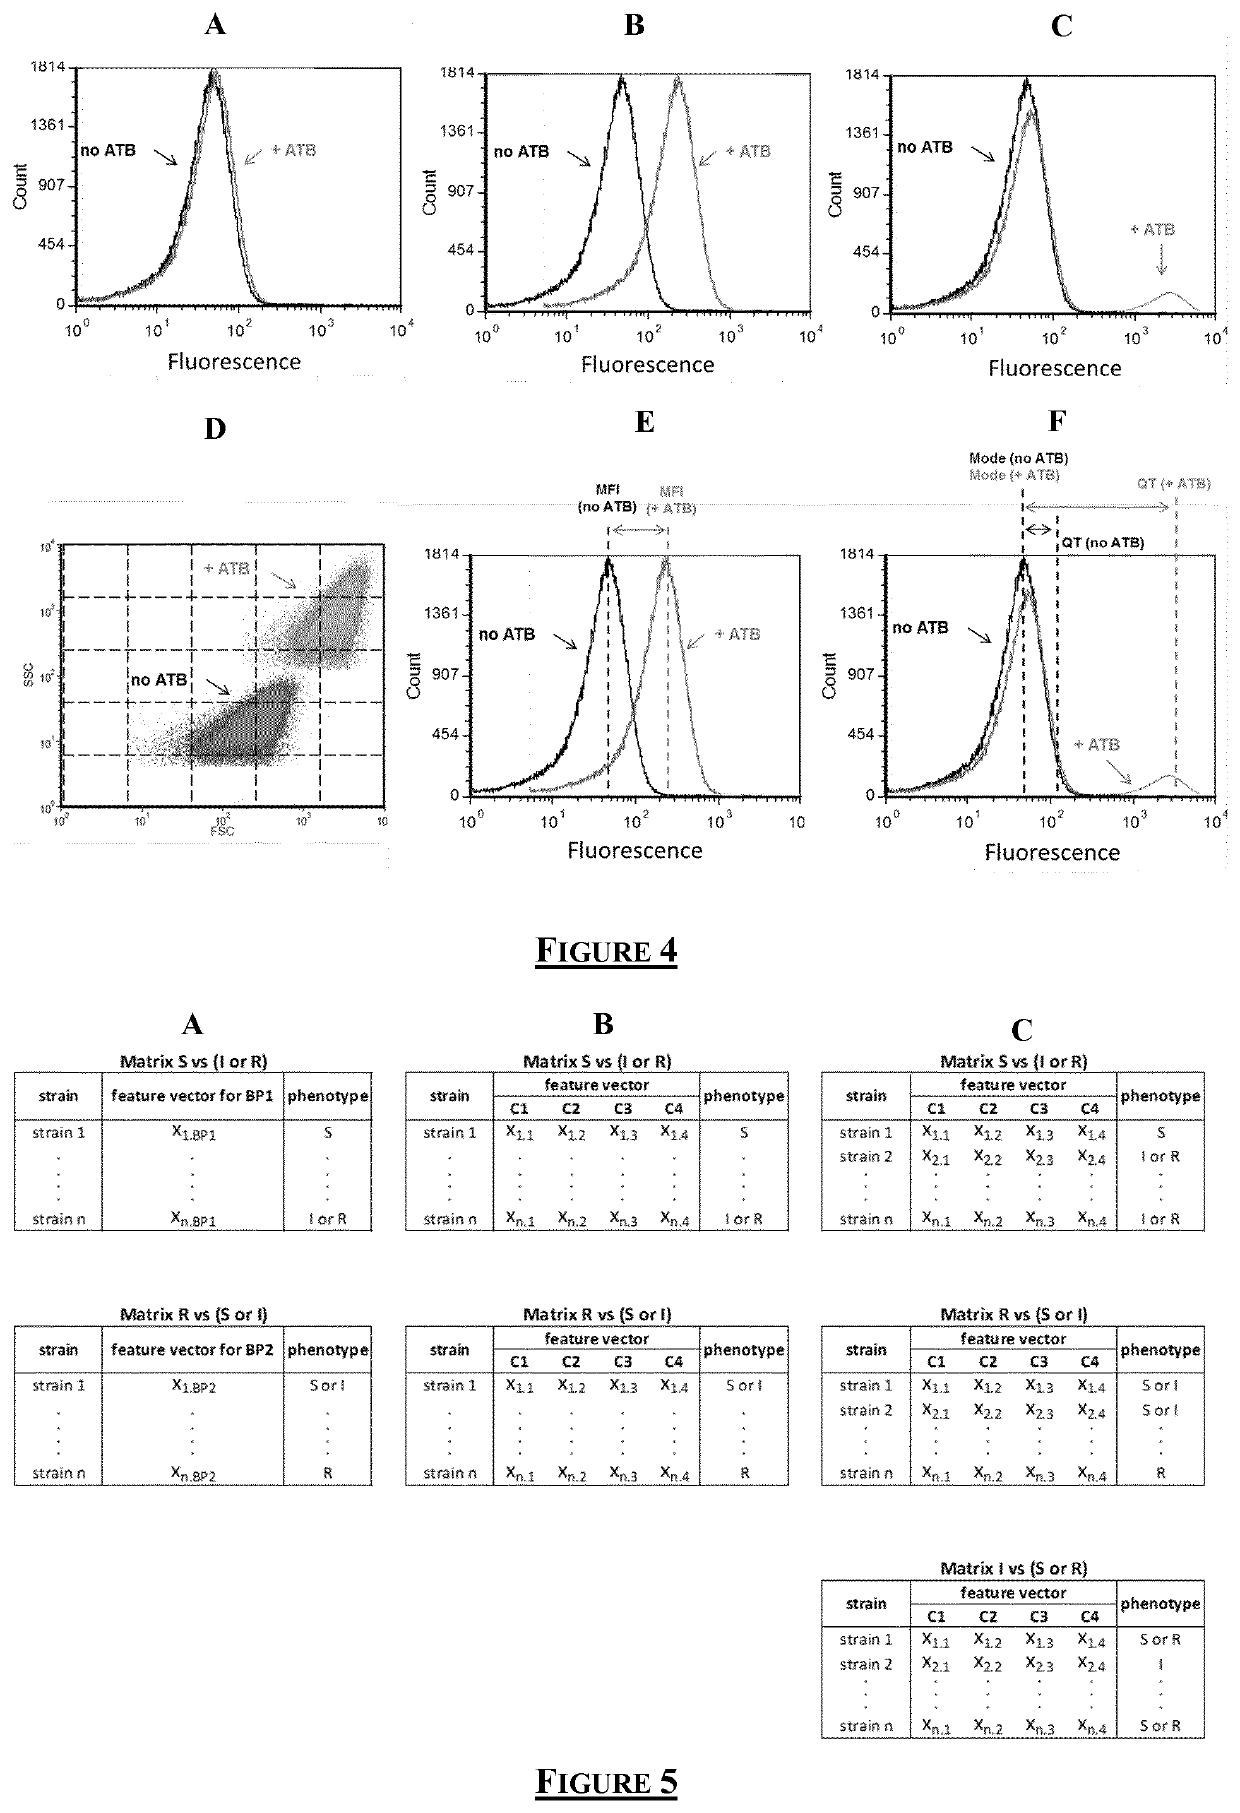
In particular, the MFI method fails to robust...

Method used


Image

  • Flow cytometry data processing for antimicrobial agent sensibility prediction
  • Flow cytometry data processing for antimicrobial agent sensibility prediction
  • Flow cytometry data processing for antimicrobial agent sensibility prediction

Examples


experiment 1

A. Evaluation of Quantile-Based Prediction Models for Heterogeneous Fluorescence Distributions

[0166]A.i. Fluorescence Distribution Profiles of Gentamicin-Treated Strains

[0167]The experiment was performed as described in the following lines:[0168]A panel of 107 Enterobacteriaceae strains (FIG. 6: Distribution of the panel of strains according to their MICs for Gentamicin) were treated with 0, 2, 4 and 8 mg / L of Gentamicin following the protocol described in FIG. 3 and analyzed by FCM. Reference phenotypes of all strains were determined by broth microdilution method according to CLSI breakpoints;[0169]Fluorescence distribution were observed for all strains and classified based on their profiles;[0170]Prediction models were generated from FCM data and the performance was evaluated as described above.

[0171]FCM fluorescence distribution obtained from Gentamicin-treated samples showed 3 main profiles when compared to untreated samples (FIG. 7: Spectra from 3 susceptible strains which are...

experiment 2

B. In-Depth FCM Analysis and Selection of Prediction Models

[0184]B.i. Performance Evaluation of Discrimination Strategies

[0185]In this experiment, we have made an evaluation of wide range of prediction models for Ceftazidime:[0186]128 Enterobacteriaceae strains (FIG. 9: Distribution of the panel of strains according to their MICs for Ceftazidime) were treated or not with four different concentrations of Ceftazidime (1, 2, 4 and 8 mg / L) using the FCM protocol described in FIG. 3;[0187]FCM data were used to generate feature vectors as described above;[0188]For each strategy (BPS, GS and GMS), 7 type of prediction models were built based on the feature vectors generated (FIG. 10: Number of predictions models generated. “FL1” means fluorescence);[0189]The performance of all models were evaluated following cross validation as described above.

[0190]As shown in FIG. 10, 37 prediction models were generated for each discrimination strategy which makes a total number of 111 prediction models...

experiment 3

C. Selection of Relevant Antibiotic Concentrations

[0197]As shown in FIG. 12, the best prediction model for Ceftazidime is a 3D model that was built using the GS strategy. This model processes four concentrations of Ceftazidime (1, 2, 4 and 8 mg / L). In an effort to investigate the relevance of these concentrations in the discriminating potential of the 3D model, we have used the Lasso analytical tool to build a 3D model based on GS strategy as described above.

[0198]The 3D prediction model obtained using the Lasso tool showed relatively good performance with an error score slightly higher the score of the 3D model obtained with SVM analysis (FIG. 13: Performance comparison of 3D prediction models (GS) and VITEK 2. The confusion matrices show the correlation and discrepancies between the reference phenotype and the phenotypes predicted by the 3D models and VITEK® 2 from bioMérieux. The table at the bottom, shows the mean score values and the average number of prediction errors (mE, ME...


PUM


Abstract

A method for quantifying the sensibility of a test microorganism to a concentration of an antimicrobial agent includes: preparing two liquid samples including the microorganism, one having the antimicrobial agent and one without; for each sample acquiring, by a flow cytometer, a digital set values including a fluorescence, forward, or side scatter distribution, and computing: a first coordinate value corresponding to the acquired distribution main mode and an acquired distribution first area for values greater than the first coordinate value, and a second coordinate value, greater than the first, for which an acquired distribution second area between the values equals a first area predefined percentage over 50%; computing a ratio according to:
Q=QT(ATB)-Mode(ATB)QT(noATB)-Mode(noATB)
where Mode(ATB) and QT(ATB) are the first and second coordinate values with the antimicrobial agent concentration, and Mode(no ATB) and QT(no ATB) are respectively the first and second coordinate values without the antimicrobial agent concentration.

Description

FIELD OF THE INVENTION[0001]The invention relates to the prediction of sensibility of a microorganism to an antimicrobial agent using flow cytometry, in particular sensibility of a bacteria to an antibiotic.BACKGROUND OF THE INVENTION[0002]As known per se, two critical concentrations, or “breakpoints”, are defined for a antimicrobial agent, and if the minimal inhibitory concentration (“MIC”) measured for a microorganism is lower than the first breakpoint the microorganism is susceptible to said agent, if the measured MIC is greater than the second breakpoint the microorganism is resistant to said agent, and if the measured MIC is in between the microorganism is intermediate to said agent. The gold-standard methods currently used in laboratories to evaluate the MIC of a microorganism, and then its sensibility phenotype, to an antimicrobial agent are usually based on measurement of growth inhibition. These techniques include the broth micro-dilution reference method as well as manual ...

Claims


Application Information

Patent Timeline
IPC IPC(8): C12Q1/18G01N21/64G16B40/00G06N20/10G16B40/10G16B40/20
CPCG06N20/10G01N2021/6439C12Q1/18G01N21/6428G16B40/00G16B40/10G16B40/20G01N21/64
Inventor RAMJEET, MAHENDRASINGHMAHE, PIERREKANEKO, GAËLCHAPEL, MARGAUX
Owner BIOMERIEUX SA
Why Eureka
Try Eureka