Check patentability & draft patents in minutes with Patsnap Eureka AI!

Signal analysis device, signal analysis method, and signal analysis program

a signal analysis and signal analysis technology, applied in image analysis, machine learning, image enhancement, etc., can solve problems such as difficult operation, defective products flowing out, and non-detection, and achieve high-reliable determination and suppress over-learning

Active Publication Date: 2020-02-27
ANRITSU CORP
View PDF0 Cites 0 Cited by
  • Summary
  • Abstract
  • Description
  • Claims
  • Application Information

AI Technical Summary

Benefits of technology

The present invention allows for more precise analysis of signals by using multiple machine learning classifiers to determine if a signal is normal or abnormal. By comparing identification results with a threshold value, the technology can make accurate determination even when the signal is small in change or abnormality. This helps in preventing over-learning and distinguishing abnormal signals, which leads to higher accuracy in signal analysis.

Problems solved by technology

On the other hand, if the threshold value is set to be loosened, there is a possibility that non-detection occurs and a defective product flows out, and there are cases where it is difficult to perform operation only by a threshold setting.
However, in the automatic inspection by the computer, (1) there is an individual difference and the automatic inspection cannot be numerically defined, (2) an error is likely to occur due to a fine difference in measurement conditions, and (3) relative sizes of inspection areas are different due to a size and a shape of a target object and it is difficult to perform a single process on the inspection area.
Therefore, in some cases, even if algorithms of the signal process are combined, there are many target objects which cannot be automated and accuracy may be low.
However, on the other hand, since there is a problem that a determination reference is distorted due to a person or a physical condition and an environment, it is difficult to pass on the know-how of a skilled inspector, and there is a problem such as a labor shortage due to low-birth and aging, automation is desired.

Method used


Image

  • Signal analysis device, signal analysis method, and signal analysis program
  • Signal analysis device, signal analysis method, and signal analysis program
  • Signal analysis device, signal analysis method, and signal analysis program

Examples


Embodiment Construction

[0032]Hereinafter, an embodiment of the present invention will be described in detail with reference to the accompanying drawings.

[0033]In a system of analyzing a measured waveform and detecting a change and an abnormality, the present invention provides a signal analysis device, a signal analysis method, and a signal analysis program capable of performing a high-accuracy signal analysis by suppressing over-learning and appropriately distinguishing an abnormal signal even in a case where learning data is small.

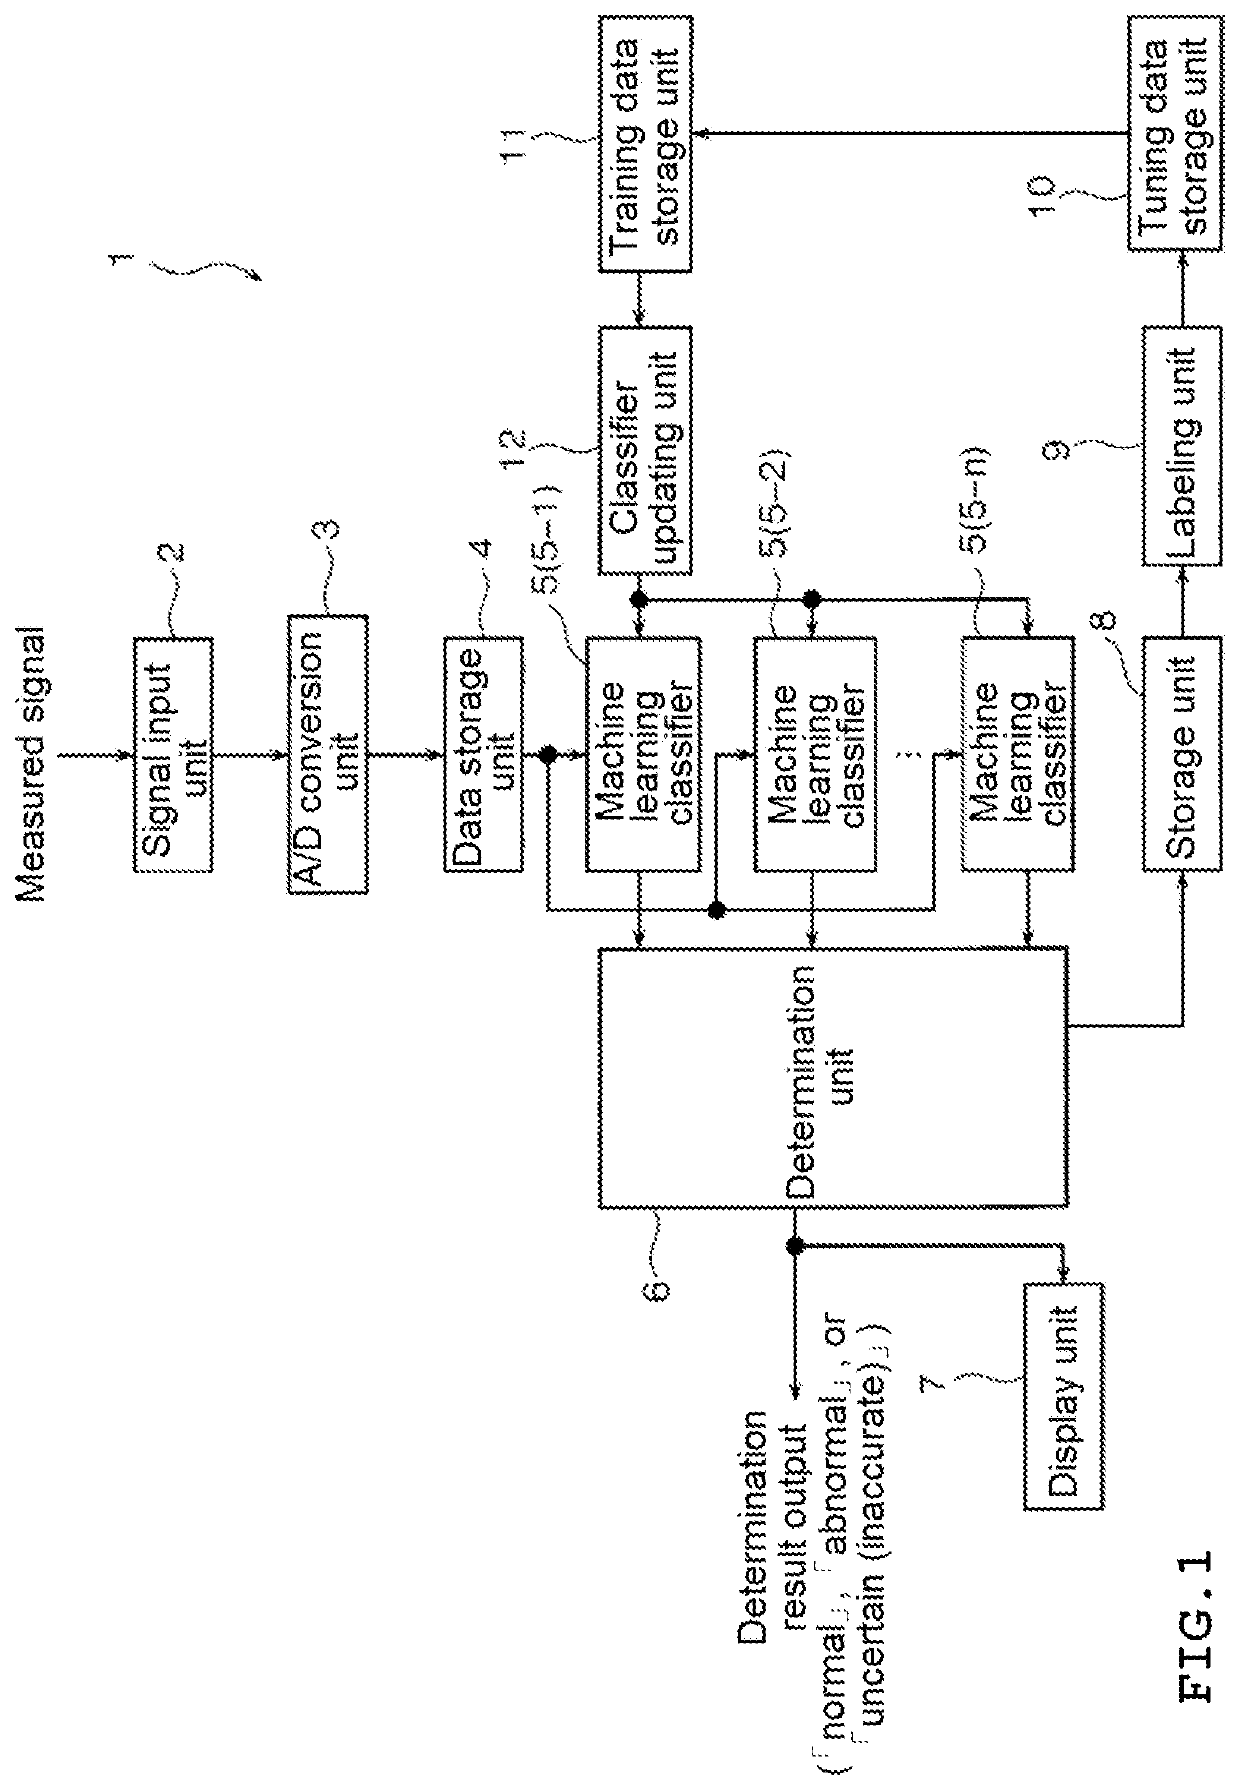
[0034]As illustrated in FIG. 1, a signal analysis device 1 is schematically configured to include a signal input unit 2, an A / D conversion unit 3, a data storage unit 4, a machine learning classifier 5, a determination unit 6, a display unit 7, a memory unit 8, a labeling unit 9, a tuning data storage unit 10, a training data storage unit 11, and a classifier updating unit 12, during operation.

[0035]For example, an analog signal from various sensors such as a microphone, a vib...


PUM


Abstract

A highly reliable signal analysis is performed by suppressing over-learning and appropriately distinguishing an abnormal signal. A signal analysis device 1 includes a data storage unit 4 which stores digital data of a measured signal, a training data storage unit 11 which stores training data to which a label of normality or abnormality is attached, a plurality of machine learning classifiers 5 which identify whether the measured signal is normal or abnormal by comparing the digital data of the measured signal stored in the data storage unit 4 with an identification boundary value and output identification results according to machine learning by the training data, and a determination unit 6 which determines whether the measured signal is normal, abnormal, or uncertain by comparing the identification results of the plurality of machine learning classifiers 5 with a determination threshold value.

Description

TECHNICAL FIELD[0001]The present invention is related to a signal analysis device, a signal analysis method, and a signal analysis program for analyzing signals measured by various sensors such as a microphone, a vibration sensor, an optical sensor, and the like, for example.BACKGROUND ART[0002]For example, when detecting an abnormality in an apparatus such as vibration or operation noise of a machine, belt conveyor vibration, bearing wear, and the like, in a case of analyzing waveforms measured by various sensors, for example, such as a microphone, a vibration sensor, an optical sensor, and the like and detecting the abnormality from the change, it is necessary to analyze signals with wide ranges from electrical or mechanical high-speed transients to a low-speed repetitive phenomenon.[0003]For example, in a case of performing a defect inspection of an electronic component, first, a three-dimensional displacement distribution of a measurement target is imaged or is converted into im...

Claims


Application Information

Patent Timeline
Patent Type & Authority Applications(United States)
IPC IPC(8): G06N20/00G06T7/00
CPCG06N20/00G06T2207/20081G06T7/0004G06T2207/20084G06N20/20G06N20/10G06N3/08G06N3/045
Inventor SHIOIRI, KEN
Owner ANRITSU CORP
Features
  • R&D
  • Intellectual Property
  • Life Sciences
  • Materials
  • Tech Scout
  • Unparalleled Data Quality
  • Higher Quality Content
  • 60% Fewer Hallucinations
Learn More