Intensity data visualization

a data visualization and intensity technology, applied in the field of data visualization, can solve the problems of large amount of labeled data training, time-consuming and laborious manual labeling of data, and few traditional tools to facilitate the process of labeling data, so as to facilitate the labeling of objects

Active Publication Date: 2021-01-28
SCALE AI INC
View PDF0 Cites 1 Cited by
  • Summary
  • Abstract
  • Description
  • Claims
  • Application Information

AI Technical Summary

Benefits of technology

[0008]One advantage of the disclosed techniques is that point cloud colorings can be determined from intensity data in different formats. In addition, materials with different reflectance properties can be shown in different colors. The different colors applied to materials can, in turn, facilitate the labeling of objects comprising such materials and / or verification of prior labeling. These technical advantages represent one or more technological advancements over prior art approaches.

Problems solved by technology

Many machine learning models, including deep neural networks, require large amounts of labeled data to train and verify.
However, such manual labeling of data is time consuming and labor intensive, and few traditional tools exist to facilitate the process of labeling data.
However, using such simple color gradients to visualize LIDAR intensity data is of limited benefit to users trying to label LIDAR point clouds.

Method used


Image

  • Intensity data visualization
  • Intensity data visualization
  • Intensity data visualization

Examples


Embodiment Construction

[0019]In the following description, numerous specific details are set forth to provide a more thorough understanding of the present disclosure. However, it will be apparent to one of skilled in the art that the present disclosure may be practiced without one or more of these specific details.

System Overview

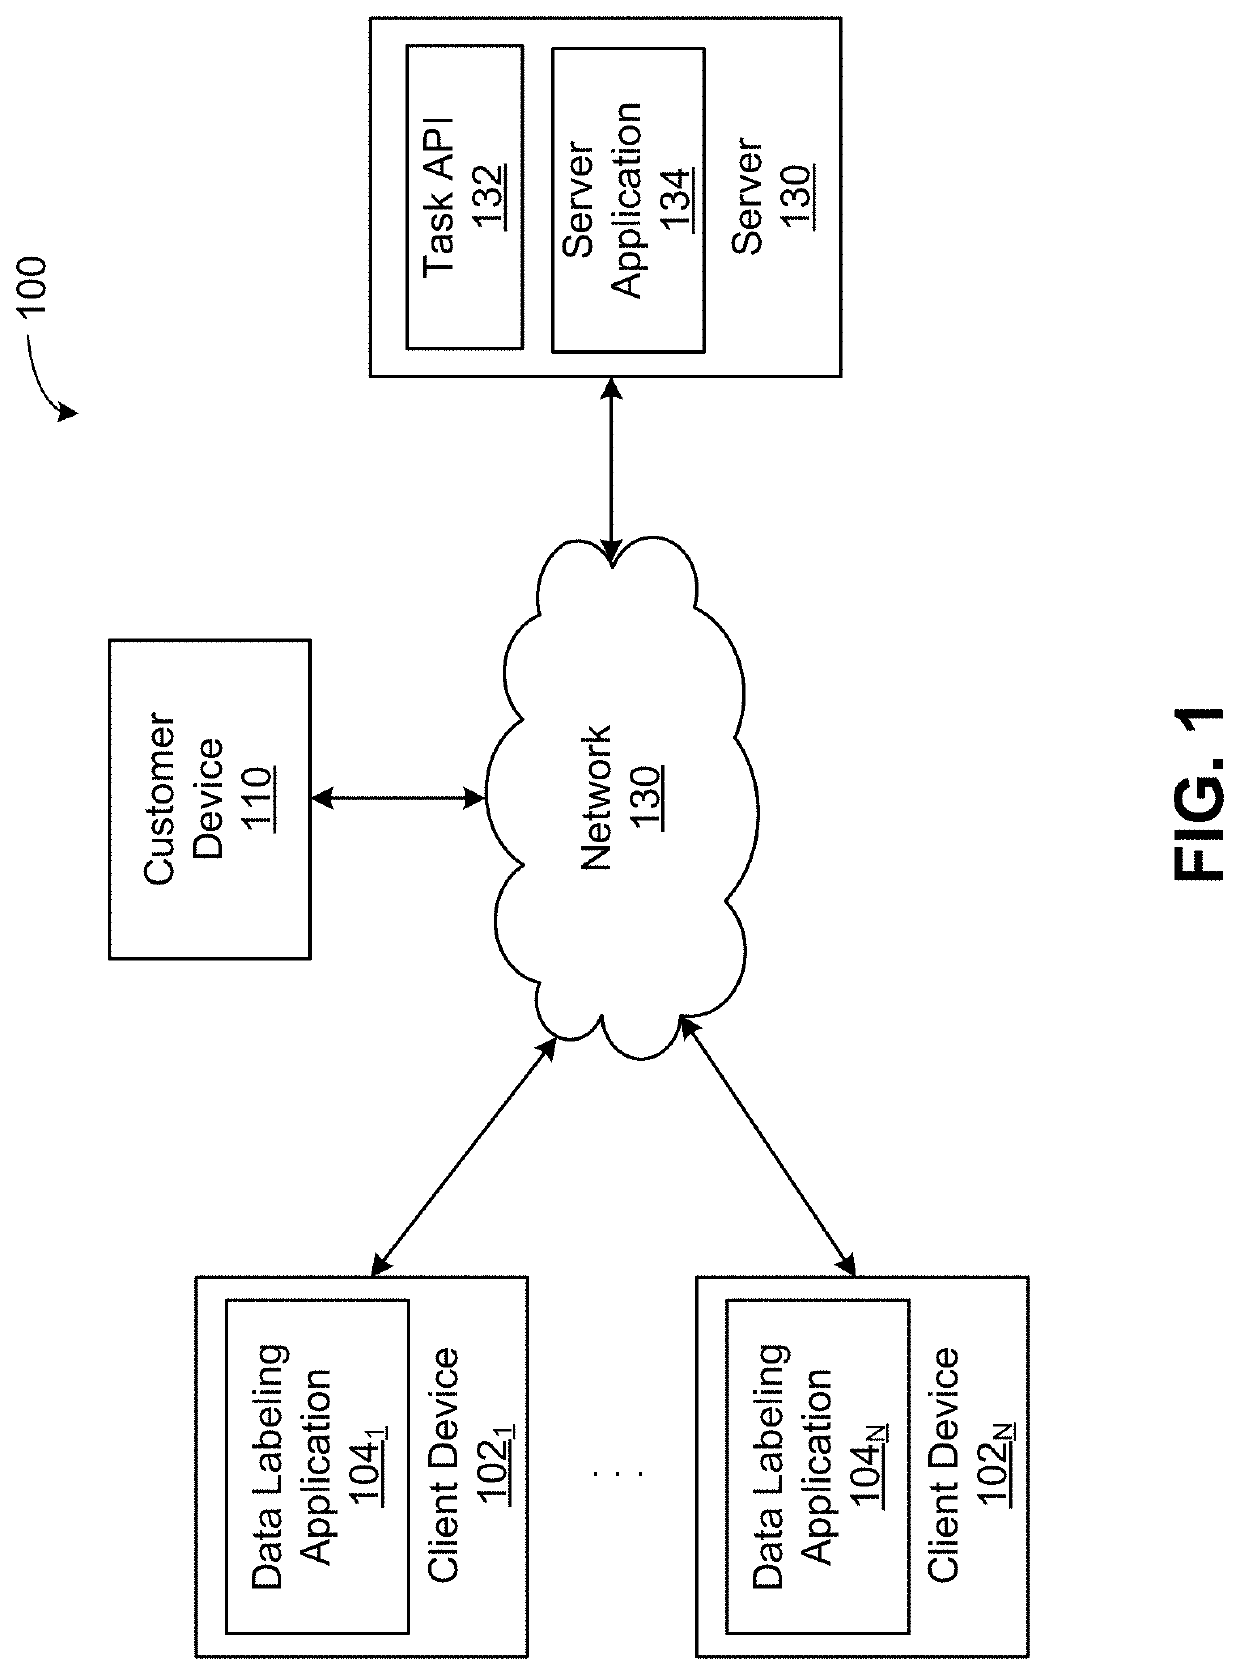
[0020]FIG. 1 is a conceptual illustration of a system 100 configured to implement one or more embodiments. As shown, the system 100 includes, without limitation, a server computing device 130 and a number of client devices 1021-N, each of which is referred to individually herein as a client device 102, that interoperate to facilitate data labeling by users of the client devices 1021-N, in response to a customer request. The server 130, the client devices 1021-N, and a customer device 110 communicate via a network 130, which may be a wide area network (WAN) such as the Internet, a local area network (LAN), or any other suitable network. Although a single server 130 and customer dev...


PUM


Abstract

Techniques for coloring a point cloud based on colors derived from LIDAR (light detection and ranging) intensity data are disclosed. In some embodiments, the coloring of the point cloud may employ an activation function that controls the colors assigned to different intensity values. Further, the activation function may be parameterized based on statistics computed for a distribution of intensities associated with a 3D scene and a user-selected sensitivity. Alternatively, a Fourier transform of the distribution of intensities or a clustering of the intensities may be used to estimate individual distributions associated with different materials, based on which the point cloud coloring may be determined from intensity data.

Description

BACKGROUNDTechnical Field[0001]Embodiments of the present disclosure relate generally to data visualization and, more specifically, to visualizing intensity data.Description of the Related Art[0002]Advances in the field of machine learning and increases in available computing power have led to a proliferation in the applications of machine learning. Many machine learning models, including deep neural networks, require large amounts of labeled data to train and verify. Such labeled data typically includes samples that have been tagged with labels. For example, labeled images in which the classifications and locations of objects (e.g., people, cars, etc.) have been tagged may be used to train a machine learning model to perform object classification and localization.[0003]Labeled data can be obtained by relying on human judgment to tag data with appropriate labels. However, such manual labeling of data is time consuming and labor intensive, and few traditional tools exist to facilitat...

Claims


Application Information

Patent Timeline
Patent Type & Authority Applications(United States)
IPC IPC(8): G06T11/00H04L29/08G06F3/0484G06T7/90G01S7/51G01S7/48
CPCG06T11/001H04L67/10G06F3/04847G06T7/90G06T2207/10044G01S7/4802G06T2207/10024G06T2207/10028G06T2200/24G01S7/51G06F3/0481G06T11/60H04L67/02G06T7/11G06T2207/30248G06T2207/20092
Inventor MOSS, EVANHAO, STEVENBRASWELL, LEIGH MARIE
Owner SCALE AI INC
Why Eureka
Try Eureka