Systems and methods for improving disease diagnosis using measured analytes

a technology of disease diagnosis and measured analytes, applied in the field of systems and methods for improving disease diagnosis using measured analytes, can solve the problems of high nonlinearity, high local variable outcome, and inability to improve diagnostic and analytical power in practice, so as to improve the predictive power and diagnostic accuracy of methods.

Pending Publication Date: 2021-02-04
OTRACES
View PDF0 Cites 0 Cited by
  • Summary
  • Abstract
  • Description
  • Claims
  • Application Information

AI Technical Summary

Benefits of technology

[0043]Without limiting the foregoing, in a preferred embodiment, the invention relates to improving the predictive power and diagnostic accuracy of methods for predicting disease states using multi-variable (multi-variant) correlation methods. These methods include proteomic, metabolomic and other techniques that involve the determination of levels of various biomarkers as found in bodily fluids and tissue samples.

Problems solved by technology

Persons skilled in the art recognize that many analytes and parameters that would seem to have predictive power do not improve diagnostic and analytical power in practice.
This method, though, is highly non-linear and susceptible to highly local variable outcomes with small measurement errors that can be more predictive in biological uses.
However, some independent variables that would logically seem to have a correlation in practice do not show a predictive trend.
This research has had limited or no success.
Numerous examples have been found but none have sufficiently low levels of false negatives to allow screening patients for the disease with the marker.
This test requires that the concentration that indicates a biopsy would be appropriate be heavily skewed to lower false negatives resulting in very high levels of false positives.
DNA markers also have been found to be very good in some cases for a sub-type of a cancer, but again are not suitable for screening for the same reasons as the HAPs noted above.
However, a problem with all of these methods is that many of the proteins selected do not have a strong correlation with progression from healthy to disease (and many do not have a known biological connection with a disease state, for example, as typically is the case with mass spectrometry).
Furthermore, mass spectrometry suffers a serious over-sampling problem due to the fact that the whole serum sample is interrogated by the spectrophotometer for protein levels and thus the training of the correlation algorithm is difficult.
Additional biopsies for monitoring are not acceptable to the medical community due to cost and are unacceptable to the patient due to pain and side effects.
Currently there are no regulatory approved methods for detecting diseases such as lung cancer and breast cancer by simple blood test.
Furthermore, these diseases can only assessed for severity by biopsy.

Method used


Image

  • Systems and methods for improving disease diagnosis using measured analytes
  • Systems and methods for improving disease diagnosis using measured analytes
  • Systems and methods for improving disease diagnosis using measured analytes

Examples


example 1

Clinical Study Assessing Breast Cancer Blood Test

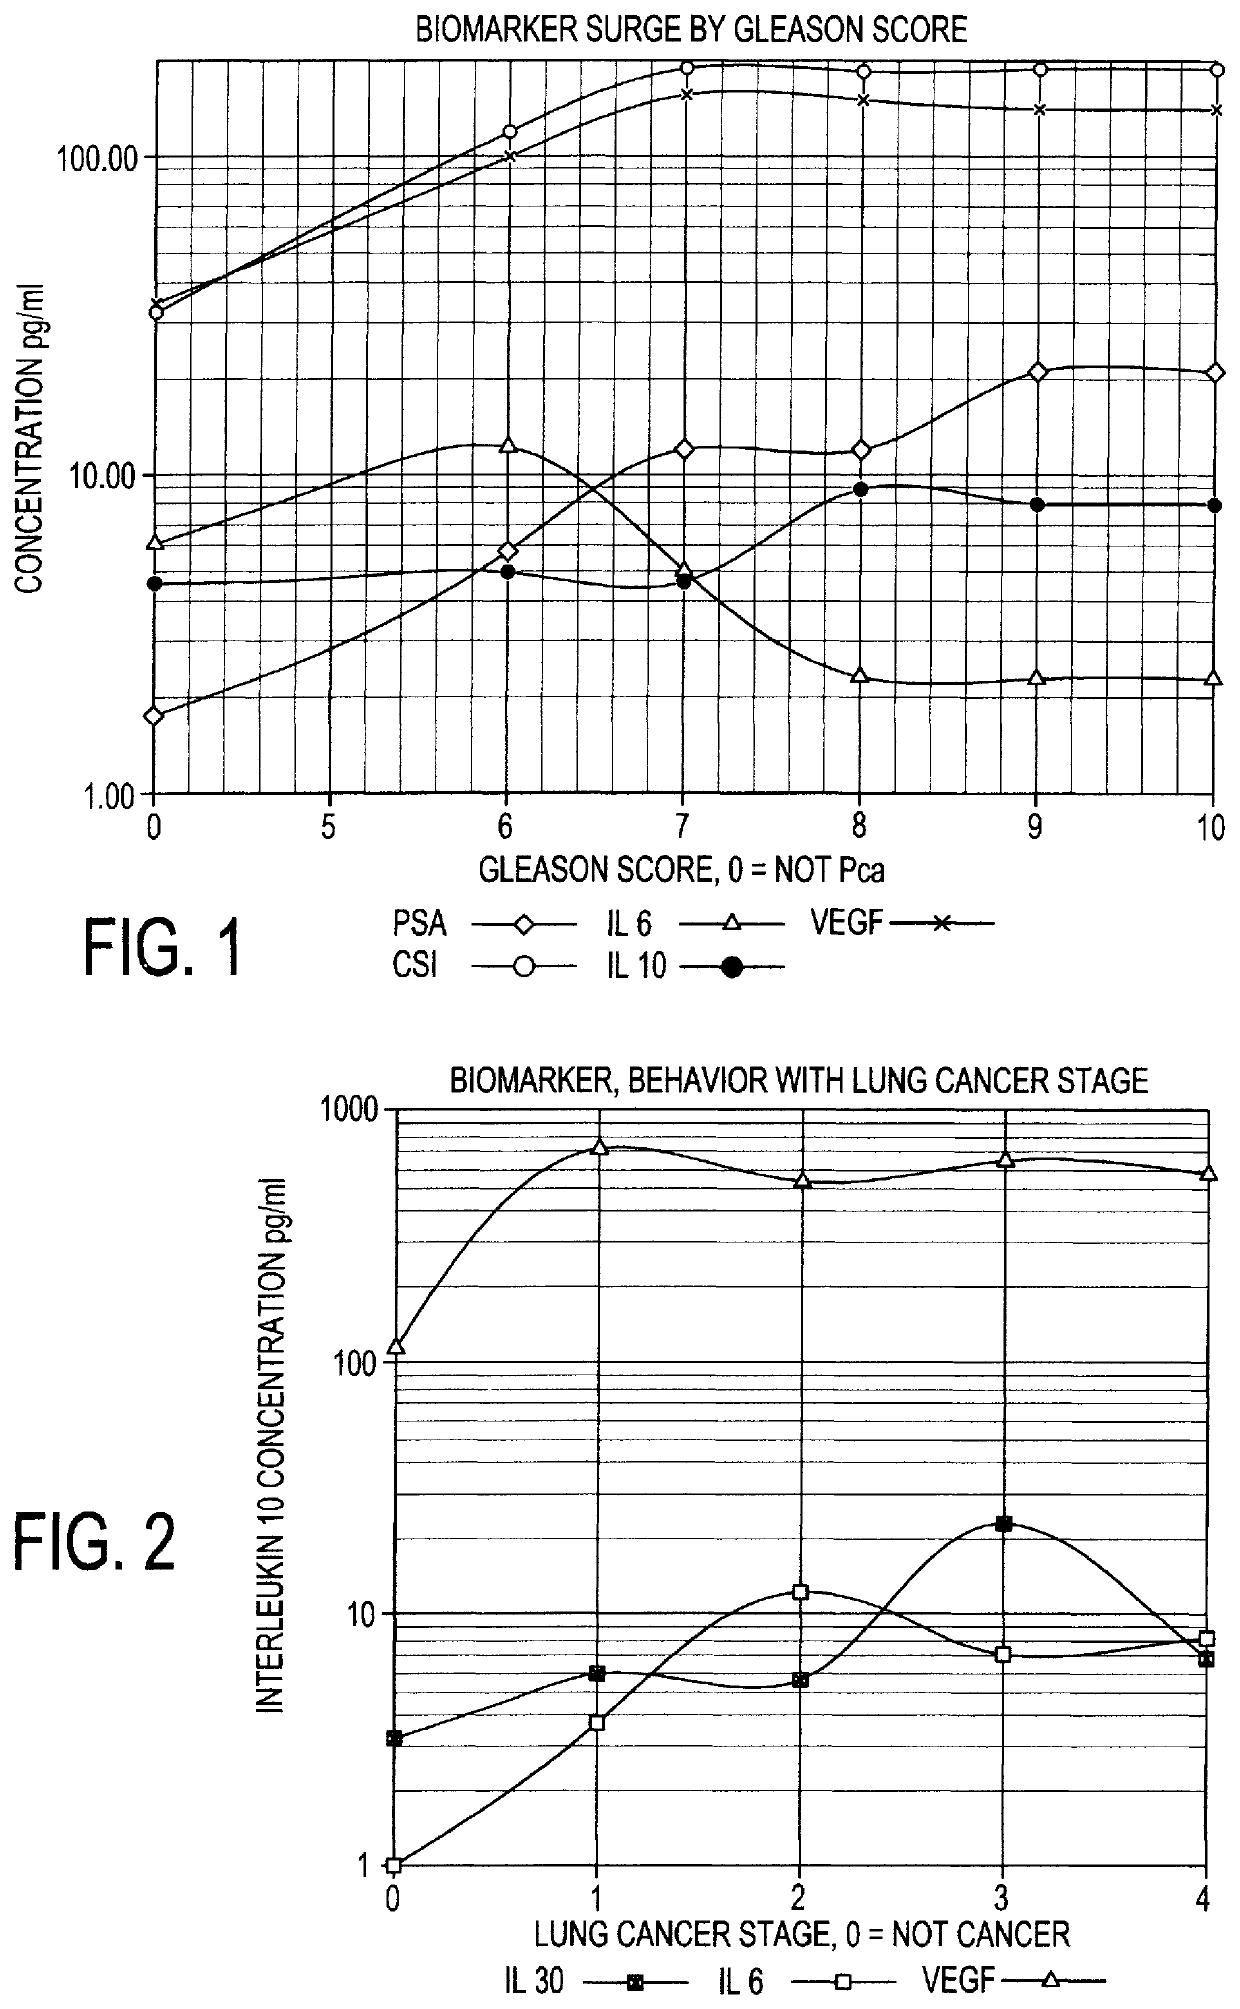
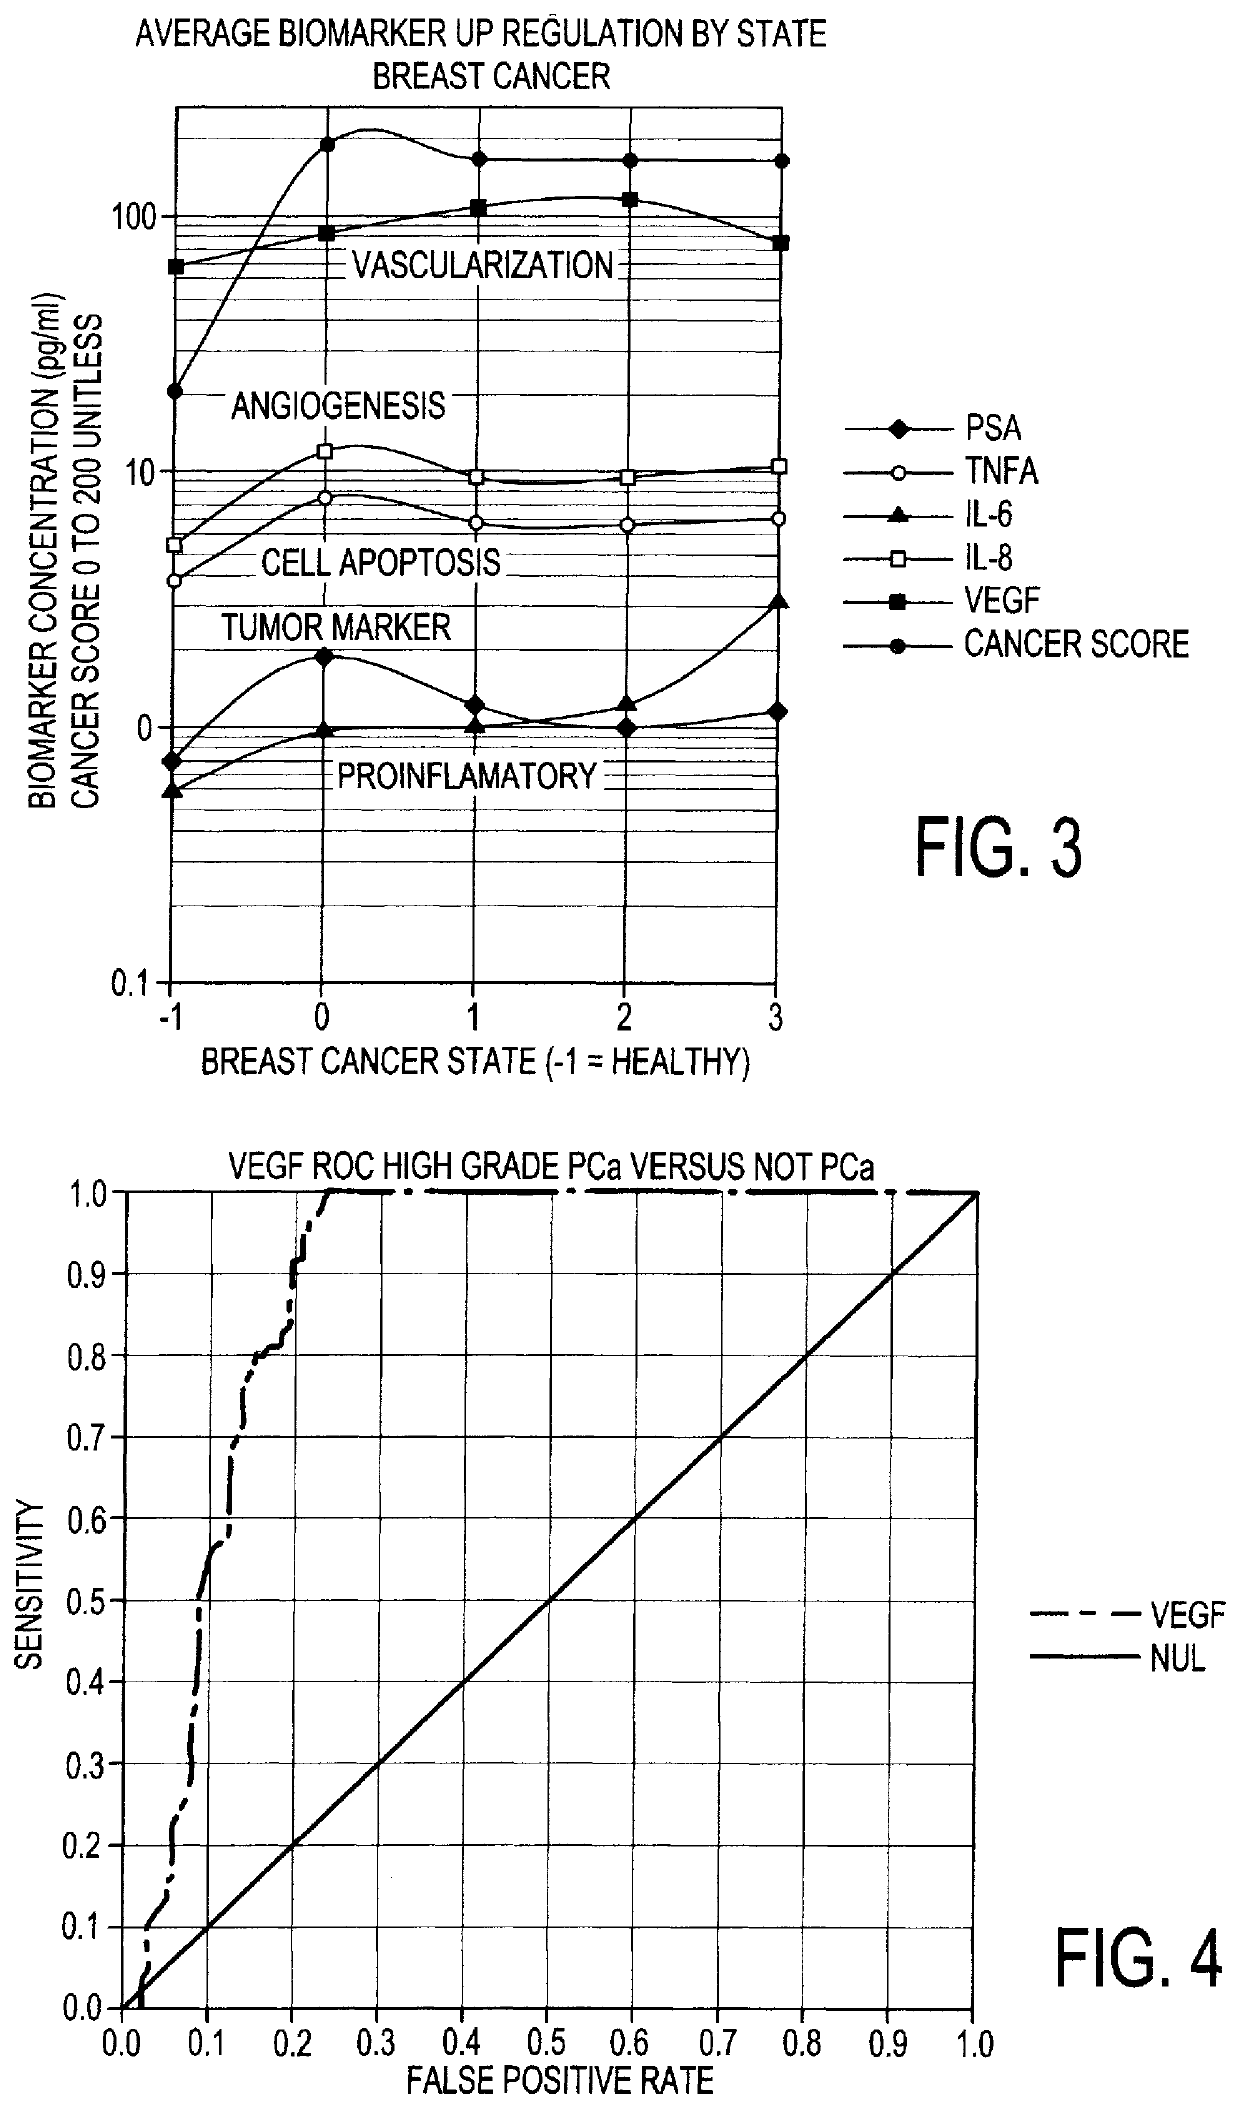
[0109]The performance of the OTraces BC Sera Dx test kit and OTraces CDx Immunochemistry Instrument System (www.otraces.com) was evaluated in an experiment to assess the risk of the presence of breast cancer. The test kit measures the concentrations of five very low-level cytokines and tissue markers, and uses a training set model that was developed as described above to calculate scores, CS1 and CSq, for assessing the risk of breast cancer. The proteins measured were IL-6, IL-8, VEGF, TNFα and PSA. The experiment consisted of measuring about 300 patient samples split roughly 50% between breast cancer cases diagnosed by biopsy and 50% from patients putatively considered non-diseased (or in this case not having breast cancer). Of this group, the biopsy results for 200 samples divided exactly into 50% non-disease and 50% having breast cancer disease and each group was further subdivided into specified age groupings.

[0110]The sample anal...

example 2

Use of the Meta-Variable “Age” to Improve Diagnostic Accuracy

[0117]Table 1 (below) shows the tabulated results for an 868 subject sample clinical study for breast cancer.

TABLE 1Summary of Diagnostic Accuracy for Breast CancerCorrectlyFalselyConditionCohortIdentifiedUncertainIdentifiedBreast Cancer49598.0%1.0%1.0%Healthy Women37398.0%0.5%1.5%

[0118]Table 2 (below) shows the comparison of various methods for the correlation calculation. The standard method, logistic regression, showed only an 82% predictive power. Standard Spatial Proximity analysis improved on this, yielding about 88% predictive power in linear form and 90% predictive power in logarithmic form. The methods described in this specification using the meta-variable and weighting approaches, topology stability conditioning, immune system response grouping and weighting conditioning for assay performance—coupled with instability testing of blind samples and incongruent algorithm correction—yielded greater than 97% predictiv...

example 3

Use of the Meta-Variable “Age” to Improve Diagnostic Accuracy in an Ovarian Cancer Study

[0119]Table 3 (below) shows the results of a study of 107 women with ovarian cancer or not having ovarian cancer using the meta-variable method described in the embodiments herein. This study did not use all of the predictive power improvements described in this specification but still achieved a relatively superior predictive power of about 95%.

TABLE 3Summary of Diagnostic Accuracy for Ovarian CancerCorrectlyFalselyConditionCohortIdentifiedUncertainIdentifiedOvarian Cancer5194.1%3.9%0.0%Healthy Women5696.4%3.6%0.0%


PUM


Abstract

Systems and methods for diagnosing diseases such as prostate cancer, breast cancer, lung cancer, ovarian cancer, and their stages are disclosed. In certain embodiments, the disclosed systems and methods collect patient samples, calculate concentrations and Proximity Scores of biomarkers, and use those calculations to produce a training set model that is used to correlate biomarker concentrations and Proximity Scores to disease diagnoses and disease states (e.g. cancer stages). In certain embodiments, the correlation techniques used include simple regression, a ROC curve area maximization, a topology stabilization, or a Spatial Proximity Correlation analysis.

Description

CROSS-REFERENCE TO RELATED APPLICATIONS[0001]This application claims the benefit of U.S. Provisional Application No. 62 / 542,865, filed Aug. 9, 2017, the entirety of which is hereby incorporated by reference herein.[0002]A related patent application, International Application No. PCT / US2014 / 000041, filed Mar. 13, 2014, (hereby incorporated by reference in its entirety herein) describes methods for improving disease prediction using an independent variable for the correlation analysis that is not the concentration of the measured analytes directly but a calculated value termed “Proximity Score” that is computed from the concentration but is also normalized for certain age (or other physiological parameters) to remove age drift and non-linearities in how the concentration values drift or shift with the physiological parameter (e.g., age, menopausal status, etc.) as the disease state shifts from not-disease to disease.FIELD OF THE INVENTION[0003]The present invention relates to methods ...

Claims


Application Information

Patent Timeline
Patent Type & Authority Applications(United States)
IPC IPC(8): G16H10/40G16H50/20G16H50/30
CPCG16H10/40G16H50/30G16H50/20
Inventor KRASIK, GLAINALINGENFELTER, KEITH
Owner OTRACES
Why Eureka
Try Eureka