Method for analyzing and correcting measurement variability in pet images

a technology of measurement variability and pet images, applied in image enhancement, instruments, angiography, etc., can solve the problems of most prone to noise, prone to scatter effects, and prone to variability, and achieve accurate and reliable assessment of the validity of a single scan measurement

Inactive Publication Date: 2021-02-25
ADM DIAGNOSTICS INC
View PDF0 Cites 0 Cited by
  • Summary
  • Abstract
  • Description
  • Claims
  • Application Information

AI Technical Summary

Benefits of technology

The invention provides methods for evaluating the validity of measurements of change in tracer signal between two scans of the brain using PET imaging. These methods correct for variations in measurement caused by scanner field of view and provide more accurate and reliable results compared to conventional methods. The methods can be used with different radiotracers and imaging techniques, and can be applied to various regions of the brain. The invention also includes a method for comparing changes in signals between different regions of the brain using a reference region. Overall, the invention improves the accuracy and reliability of evaluating the effectiveness of treatments for amyloid plaque in the brain.

Problems solved by technology

However, variability arises from, for example, the cerebellum's low signal relative to sources of noise, proximity to the edge of the scanner FOV where noise and truncation can occur, and vulnerability to scatter effects.
Signal levels vary from inferior to superior slices in cerebellar cortex, with the most inferior slices most prone to noise and inter-scanner variability, and measurements are susceptible to contamination by higher white matter values or low CSF values if head motion occurs.
Measurement variance may arise due to its relatively small volume and sensitivity to rotational head motion.
However, despite the various approaches taken in reference region definition for amyloid imaging, measurement is plagued by noise and inconsistency across reference regions.
These inconsistencies are particularly problematic in amyloid imaging trials of new drugs, where the objective is to detect differences between a placebo group, where accumulation rates may be small (a few percent), and a drug group, where amyloid may either be removed (a decrease of a few percent) or slowed in accumulation.
They are also problematic when evaluating subjects at the threshold of amyloid positive vs. negative, since this information is being used to help determine subject inclusion in clinical trials and to guide diagnosis in the clinic.
The same problems influence measurements made of glucose, tau, or receptor binding activity, since the sources of variability are not imaging target dependent.

Method used


Image

  • Method for analyzing and correcting measurement variability in pet images
  • Method for analyzing and correcting measurement variability in pet images
  • Method for analyzing and correcting measurement variability in pet images

Examples


application example 1

[0080]The subject was imaged at three visits with 11C-PiB, and changed trajectory with regard to cortical average as referenced to gray cerebellum and pons, both times in magnitude well beyond average. However, when referenced to subcortical white matter, changes were minimal. The ADNI reported values are shown below. A Biograph HiRez scanner was used on all three occasions.

Dx at Cortical Average Percent change from time SUVR, referenced to:prior scan, ref. to:of Gray Subcort Gray Subcort SubjectVisitscancerPonsWMcerPonsWM566m12MCI2.1261.1551.181566m24MCI2.3681.3691.155  11%  18%−2%566m36AD2.0701.2321.190−13%−10%  3%

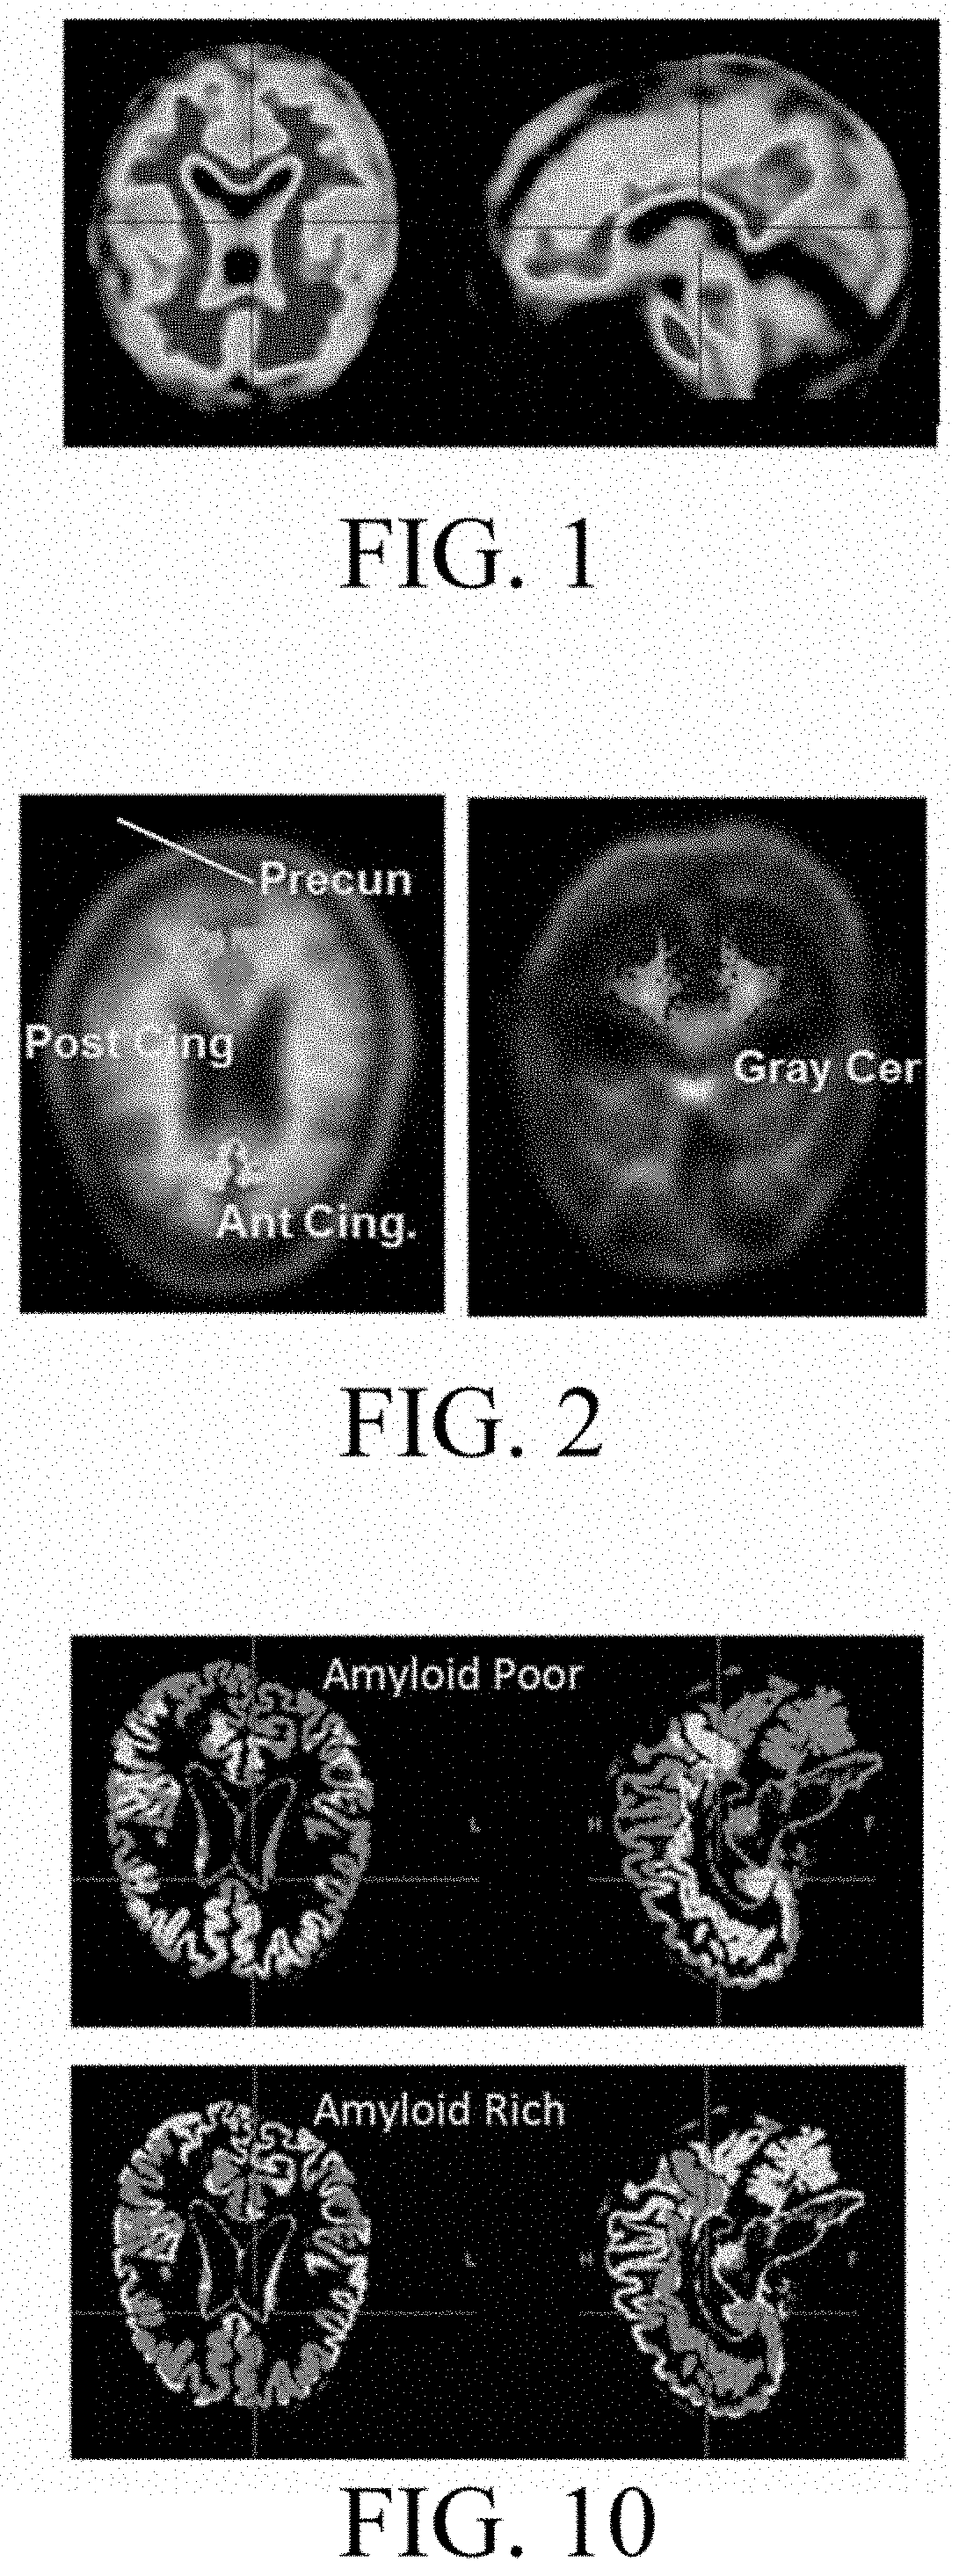
[0081]FIG. 10 shows examples of an amyloid poor (amyloid resistant) mask and an amyloid rich mask, with amyloid shown by dark gray. It is noted that these masks can and would be further refined by removing the tissue outlining the pons and brainstem, and just adjacent to CSF in the frontal region.

[0082]FIG. 11 shows the raw, non-intensity normalized values for each slice...

example 2

t Baseline and 24 Months with Florbetapir

[0086]Longitudinal percent change for this subject showed large increases in cerebellum and pons, not matched by subcortical white matter as a reference, as shown in the table below.

Clinical diagnosis at baselineMCIScannerSiemens Biograph 1093 / 94Baseline cortical ave SUVR1.7124 m change in Cortical Ave SUVRGray cerebellum19%Whole cerebellum17%White cer and pons10%Pons11%Centrum Ovale 1%Sensorimotor 2%

[0087]The slice-by-slice measures of raw values are shown in FIG. 14, and the percent changes for each non intensity normalized region are then shown in FIG. 15. It was seen that the % changes in cerebellum and also in pons are far less than that gray matter, even in amyloid poor regions. By using amyloid poor gray matter, a much less artifactual measure of change can be obtained, as compared to if cerebellum was used. Indeed, as shown in FIG. 16, the 24 month percent change when using regions other than cerebellum or pons are lower, aligned with...

example 3

[0088]This subject showed the largest increases among over 80 subjects imaged with florbetapir when VOIs were referenced to cerebellum (gray or whole). However, values referenced to pons showed minimal increases, and values referenced to subcortical white matter showed negative change (decreases). Using conventional methods, the industry would say only that “x” looks better, or more realistic, or that this subject is “an outlier.”

Clinical diagnosis at baselineMCI (converted to AD)ScannerSiemens HR+Baseline Cortical Ave. SUVR1.0924 m % change in Cortical Ave SUVRGray cer  36%Whole Cer  26%White Cer and pons   1%Pons −5%Centrum Ovale −9%Sensorimotor   6%

[0089]FIG. 17 shows the raw non-intensity normalized values for several reference regions and VOIs, while FIG. 18 shows the percent change in each of those regions over 24 months.

[0090]As described in FIG. 19, examining the slice-by-slice profile of the cerebellum would inflate change of other regions, whereas white matter would depres...


PUM


Abstract

A computer-implemented method for correcting measurement variability across a scanner field of view within an image scan, such as in PET imaging. The method operates on a slice-by-slice application and identifies and negates scan inconsistencies across the scanner field of view by normalizing values across the image scan as a function of reference signals measured across the field of view.

Description

CROSS REFERENCE TO RELATED APPLICATIONS[0001]This application is a continuation of U.S. patent application Ser. No. 14 / 909,364, which is a National Phase entry of PCT / US2014 / 049565, filed on 4 Aug. 2014, which claims the benefit of U.S. Provisional Patent Application, Ser. No. 61 / 861,677, filed on 2 Aug. 2013. The co-pending parent patent application is hereby incorporated by reference herein in its entirety and is made a part hereof, including but not limited to those portions which specifically appear hereinafter.FIELD OF THE INVENTION[0002]This invention relates generally to scanning and imaging using imaging agents, such as radiotracers and, in particular, to determining and compensating for measurement variability across a scanner field of view, such as for use in PET or SPECT imaging of the brain.BACKGROUND OF THE INVENTION[0003]Positron emission tomography (PET) is an imaging technology that measures chemical or functional activity in the brain or other parts of the body by d...

Claims


Application Information

Patent Timeline
Patent Type & Authority Applications(United States)
IPC IPC(8): A61B6/00G06T7/00G01T1/166A61B6/03G01T7/00
CPCA61B6/583G06T7/0014G01T1/1663A61B6/037A61B5/00A61B6/5217A61B6/582G01T7/005G06T7/0012A61B6/501A61B6/4258A61B6/504G16H50/30A61B6/5211A61B5/0035G01B15/00G06T2207/10104G06T2207/10108G06T2207/00G06T11/005G06T11/008G06T2207/20201
Inventor MATTHEWS, DAWN C.LUKIC, ANA S.MARENDIC, BORISANDREWS, RANDOLPH D.
Owner ADM DIAGNOSTICS INC
Why Eureka
Try Eureka