Method for analyzing and correcting measurement variability in PET images
a technology of measurement variability and pet images, applied in image enhancement, instruments, angiography, etc., can solve the problems of most prone to noise, prone to scatter effects, and prone to variability, and achieve accurate and reliable assessment of the validity of a single scan measurement
- Summary
- Abstract
- Description
- Claims
- Application Information
AI Technical Summary
Benefits of technology
Problems solved by technology
Method used
Image
Examples
application example 1
ADNI Subject
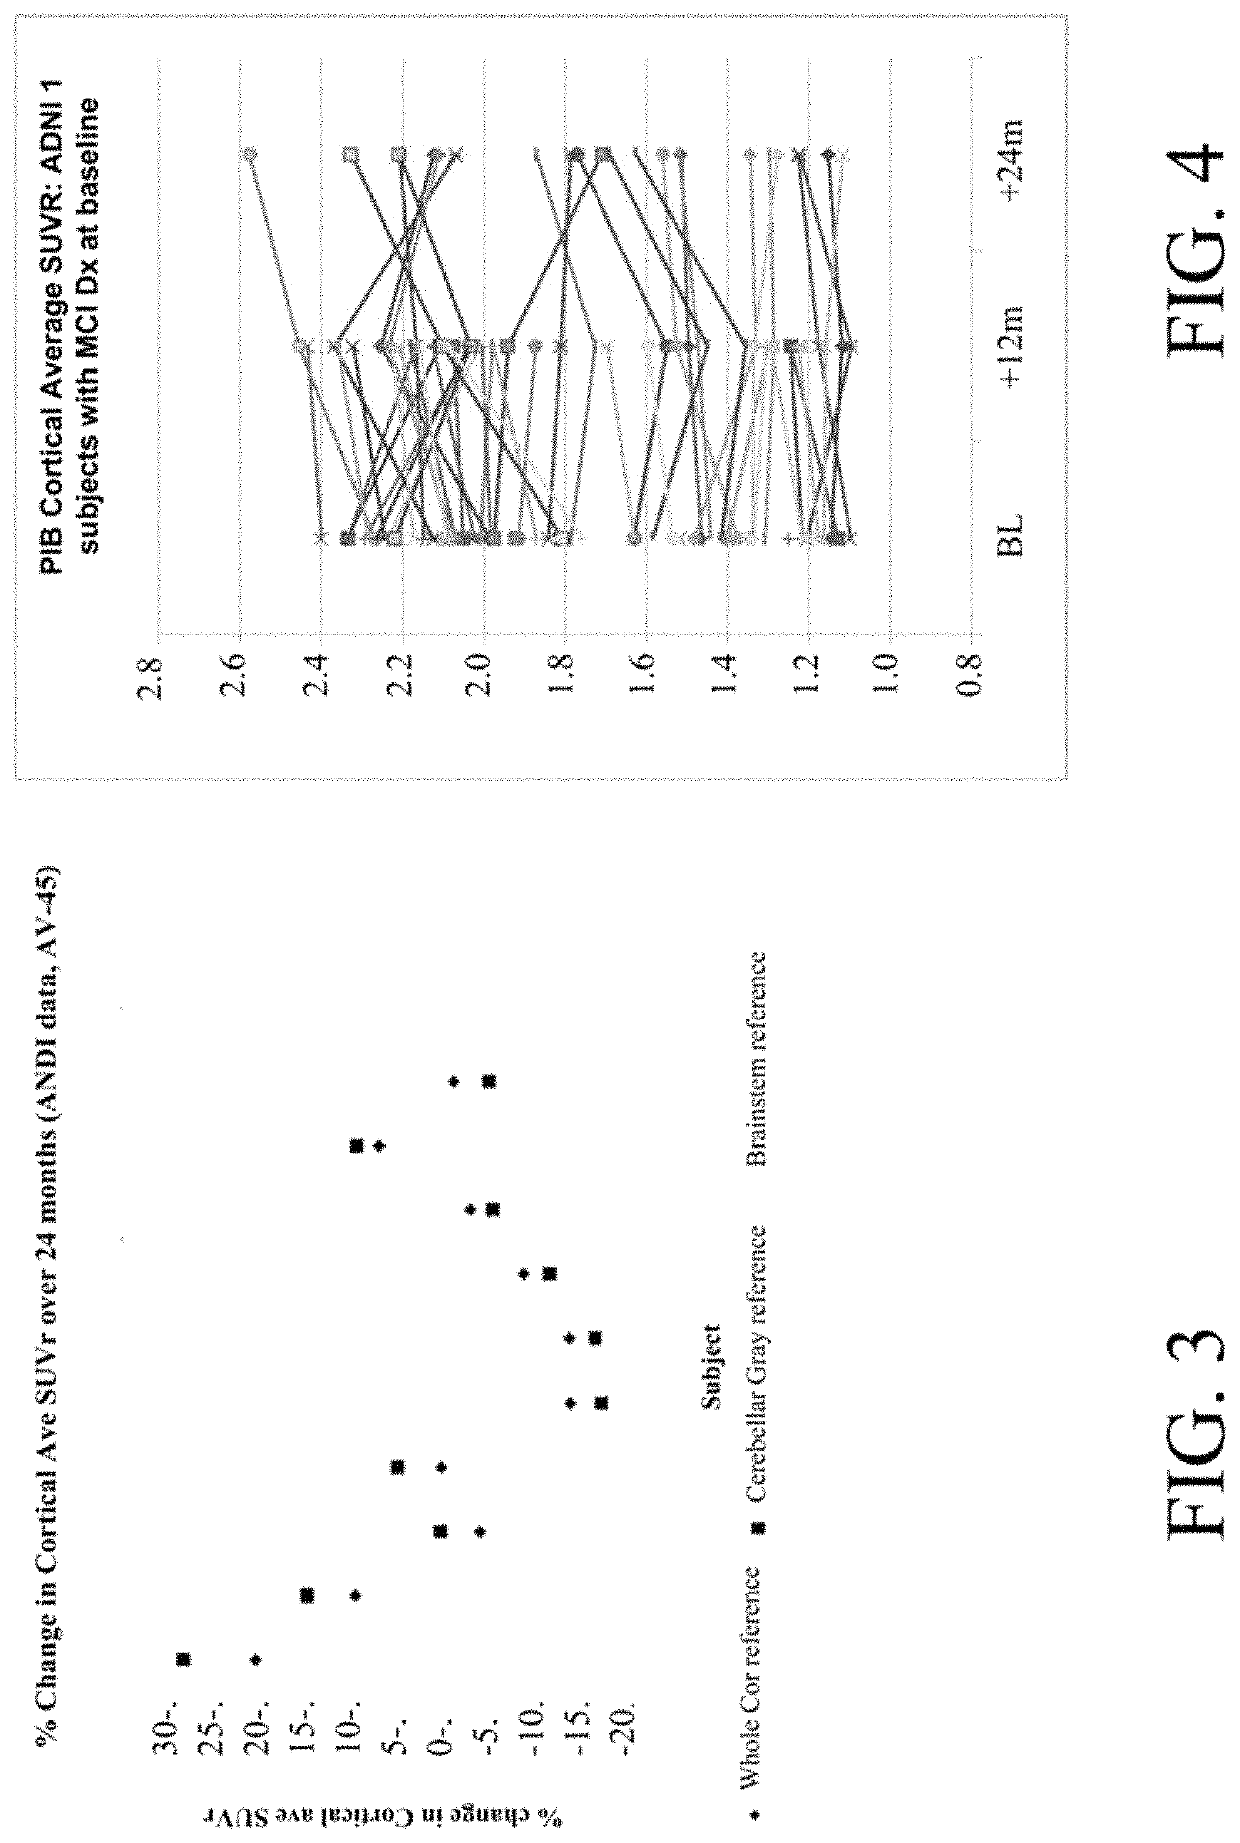
[0083]The subject was imaged at three visits with 11C-PiB, and changed trajectory with regard to cortical average as referenced to gray cerebellum and pons, both times in magnitude well beyond average. However, when referenced to subcortical white matter, changes were minimal. The ADNI reported values are shown below. A Biograph HiRez scanner was used on all three occasions.
[0084]
Cortical Average SUVR,Percent change fromreferenced to:prior scan, ref. to:Dx at timeGraySubcortGraySubcortSubjectVisitof scancerPonsWMcerPonsWM566m12MCI2.1261.1551.181566m24MCI2.3681.3691.155 11% 18%−2%566m36AD2.0701.2321.190−13%−10% 3%
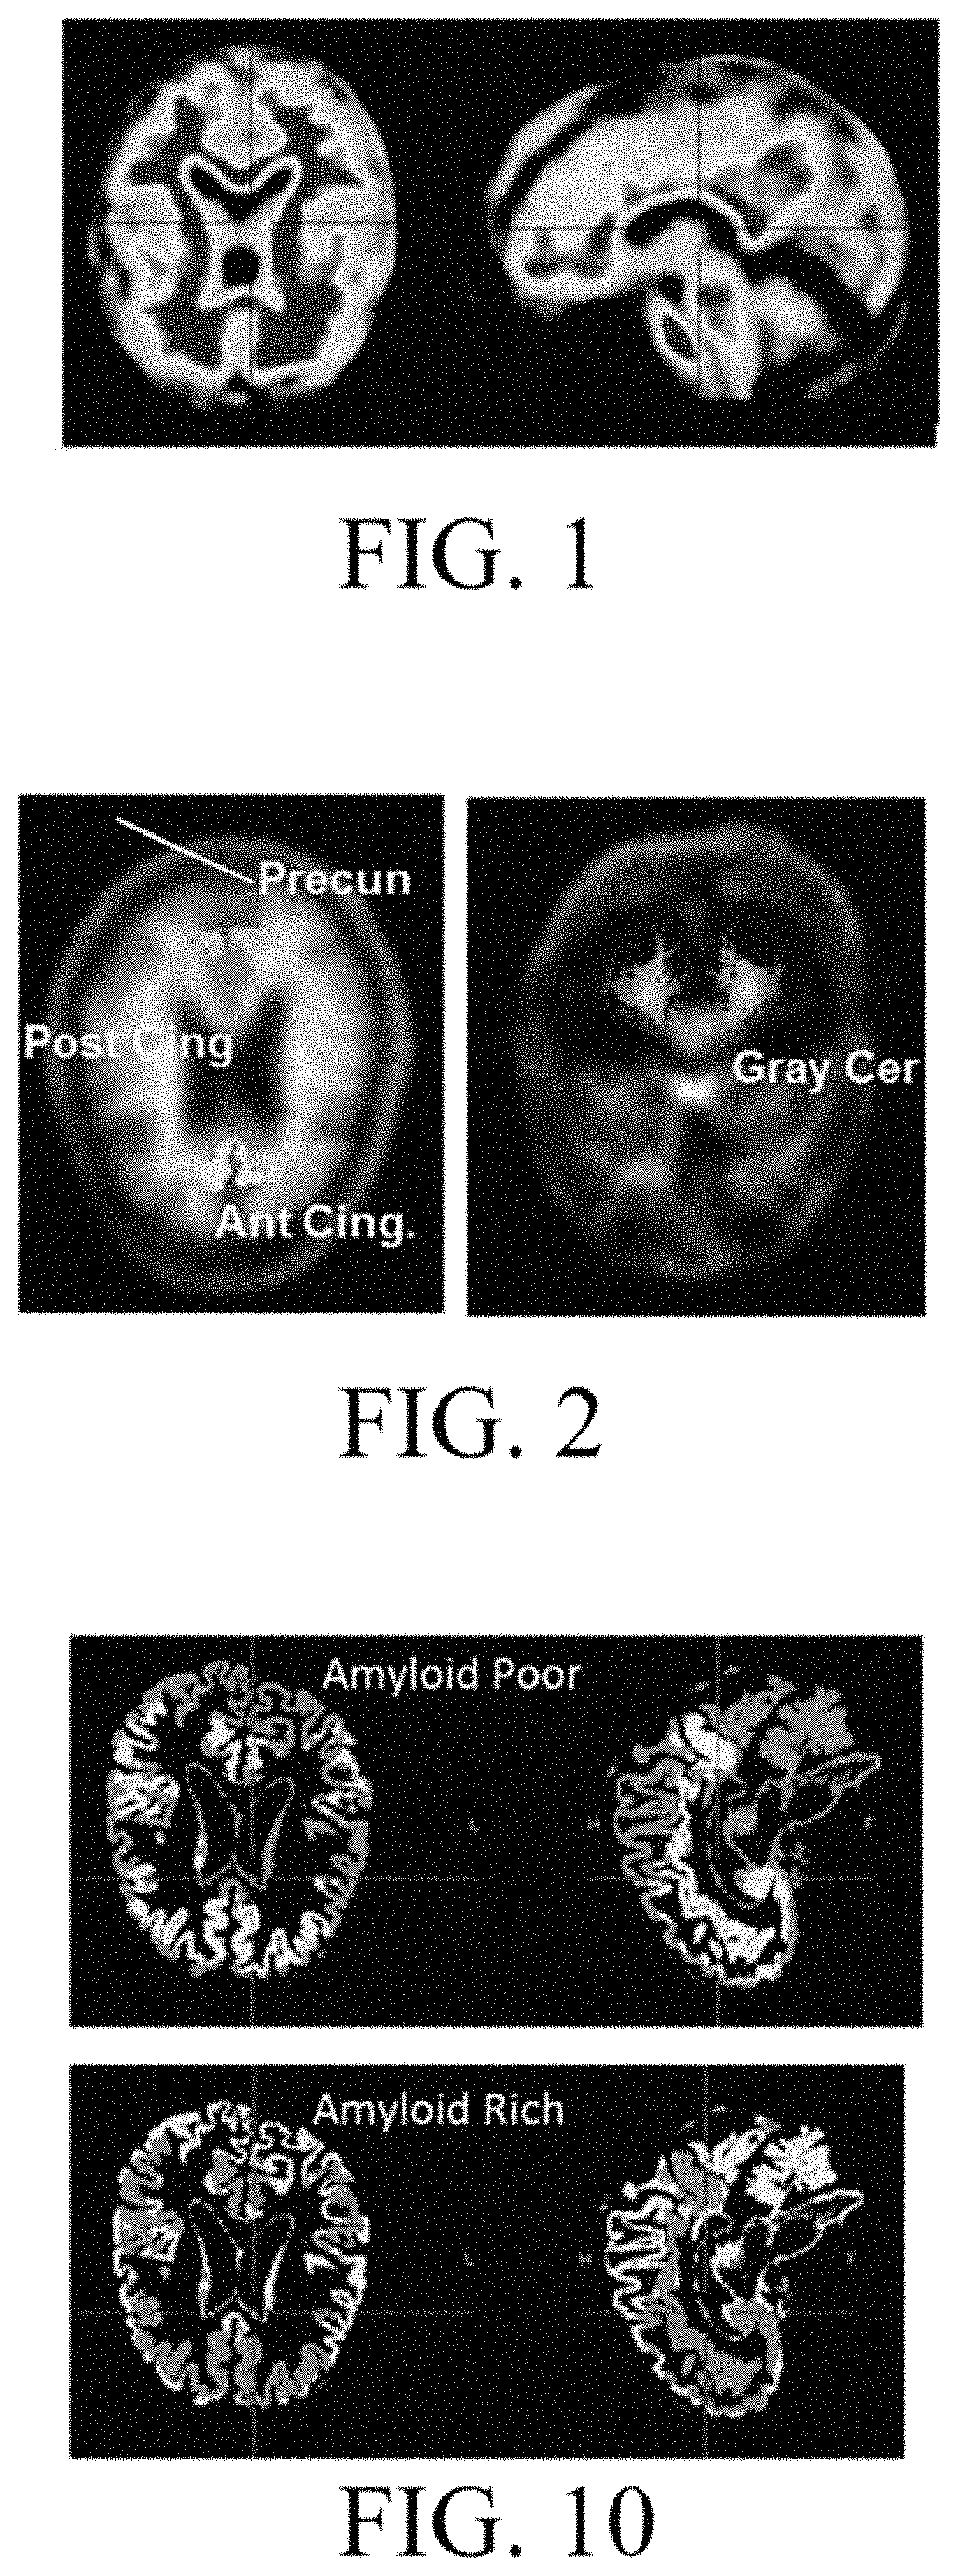
[0085]FIG. 10 shows examples of an amyloid poor (amyloid resistant) mask and an amyloid rich mask, with amyloid shown by dark gray. It is noted that these masks can and would be further refined by removing the tissue outlining the pons and brainstem, and just adjacent to CSF in the frontal region.
[0086]FIG. 11 shows the raw, non-intensity normalized values for ea...
example 2
Imaged at Baseline and 24 Months with Florbetapir
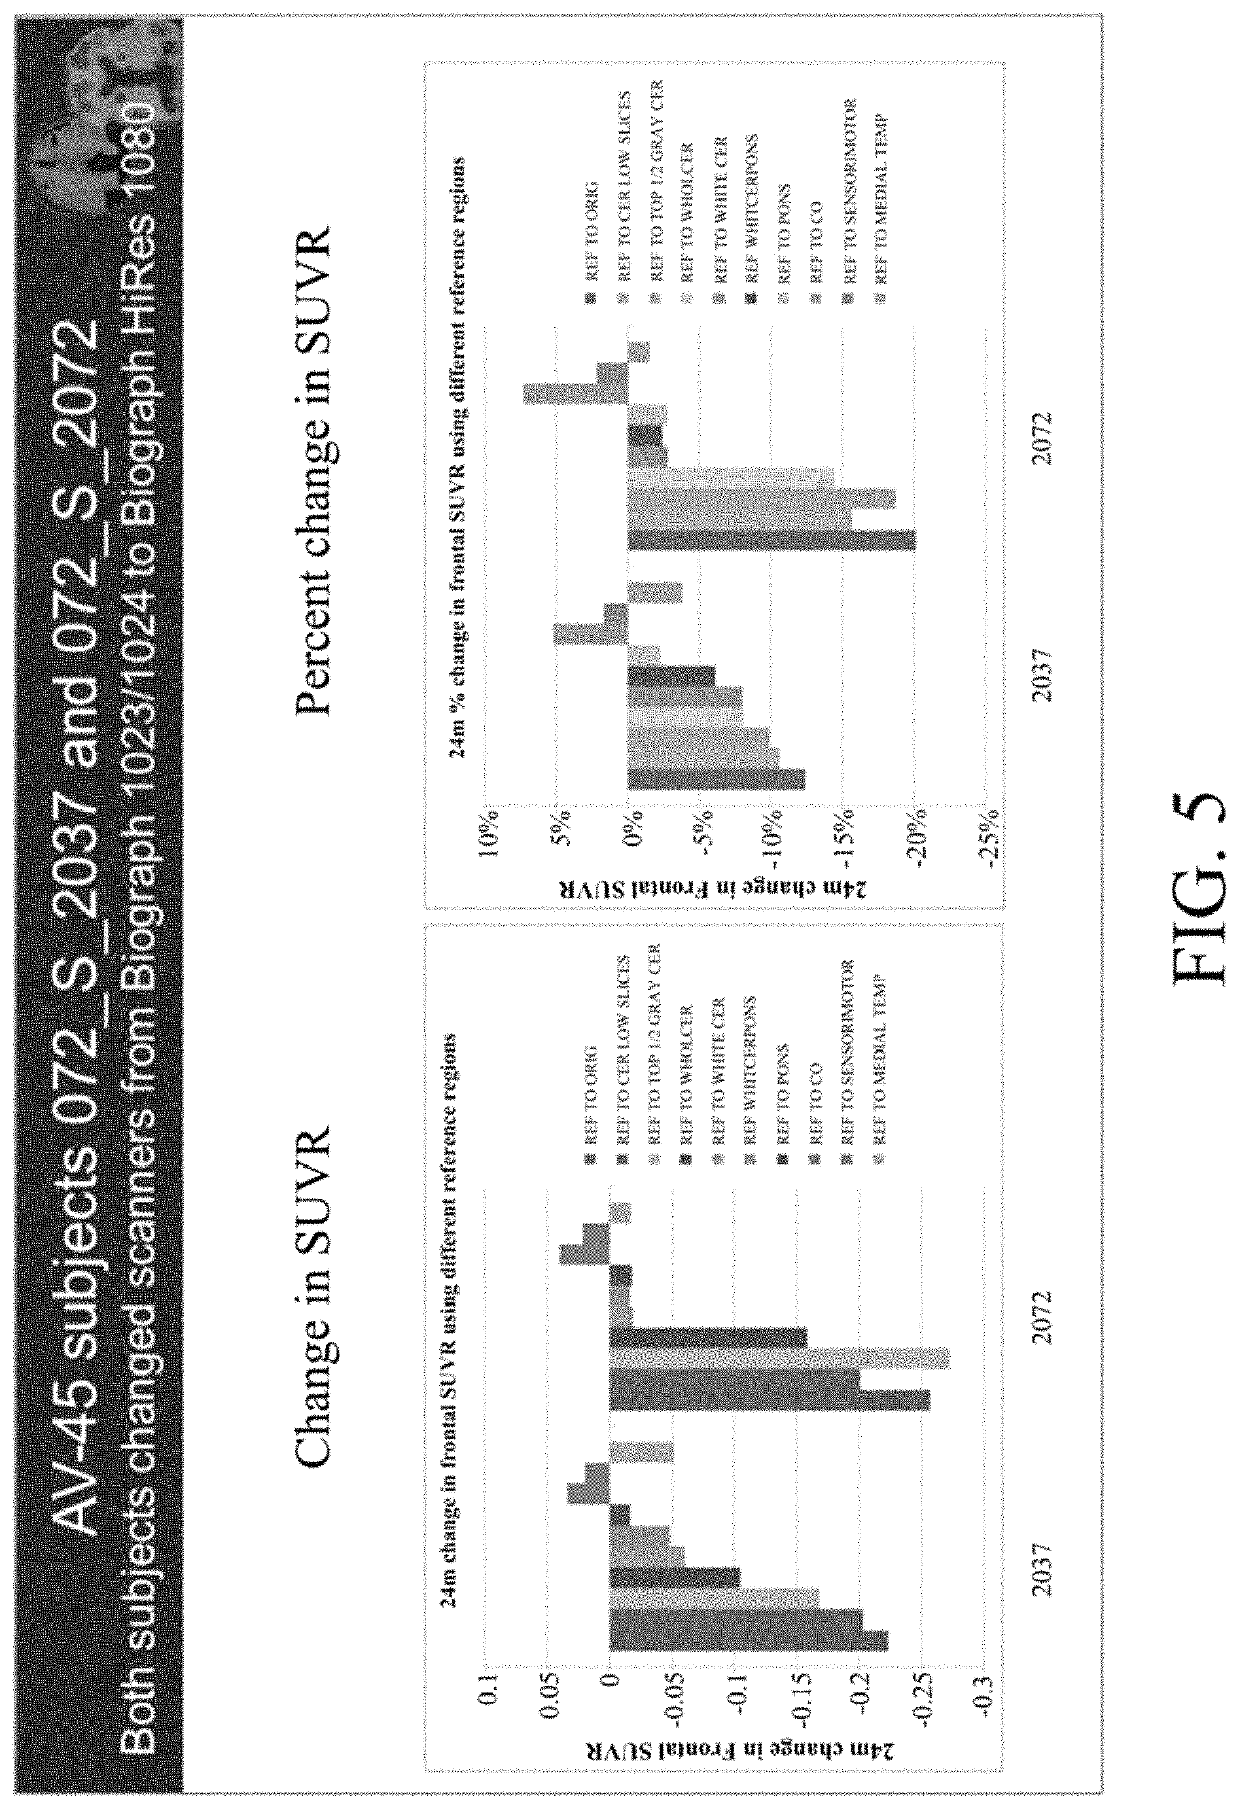
[0091]Longitudinal percent change for this subject showed large increases in cerebellum and pons, not matched by subcortical white matter as a reference, as shown in the table below.
[0092]
Clinical diagnosis at baselineMCIScannerSiemens Biograph 1093 / 94Baseline cortical ave SUVR1.7124 m change in Cortical Ave SUVRGray cerebellum19%Whole cerebellum17%White cer and pons10%Pons11%Centrum Ovale1%Sensorimotor2%
[0093]The slice-by-slice measures of raw values are shown in FIG. 14, and the percent changes for each non intensity normalized region are then shown in FIG. 15. It was seen that the % changes in cerebellum and also in pons are far less than that gray matter, even in amyloid poor regions. By using amyloid poor gray matter, a much less artifactual measure of change can be obtained, as compared to if cerebellum was used. Indeed, as shown in FIG. 16, the 24 month percent change when using regions other than cerebellum or pons are lower, ...
example 3
[0094]This subject showed the largest increases among over 80 subjects imaged with florbetapir when VOIs were referenced to cerebellum (gray or whole). However, values referenced to pons showed minimal increases, and values referenced to subcortical white matter showed negative change (decreases). Using conventional methods, the industry would say only that “x” looks better, or more realistic, or that this subject is “an outlier.”
[0095]
Clinical diagnosis at baselineMCI (converted to AD)ScannerSiemens HR+Baseline Cortical Ave. SUVR1.0924 m % change in Cortical Ave SUVRGray cer36%Whole Cer26%White Cer and pons1%Pons−5%Centrum Ovale−9%Sensorimotor6%
[0096]FIG. 17 shows the raw non-intensity normalized values for several reference regions and VOIs, while FIG. 18 shows the percent change in each of those regions over 24 months.
[0097]As described in FIG. 19, examining the slice-by-slice profile of the cerebellum would inflate change of other regions, whereas white matter would depress (cau...
PUM
 Abstract
Description
Claims
Application Information
 - R&D
- Intellectual Property
- Life Sciences
- Materials
- Tech Scout
- Unparalleled Data Quality
- Higher Quality Content
- 60% Fewer Hallucinations
Browse by: Latest US Patents, China's latest patents, Technical Efficacy Thesaurus, Application Domain, Technology Topic, Popular Technical Reports.
© 2025 PatSnap. All rights reserved.Legal|Privacy policy|Modern Slavery Act Transparency Statement|Sitemap|About US| Contact US: help@patsnap.com


