

Method for analyzing blood coagulation characteristics of blood specimen
- Summary
- Abstract
- Description
- Claims
- Application Information
AI Technical Summary
Benefits of technology
Problems solved by technology
Method used
Image

Examples
example 1
on of Test Parameters
[0208](1) Method
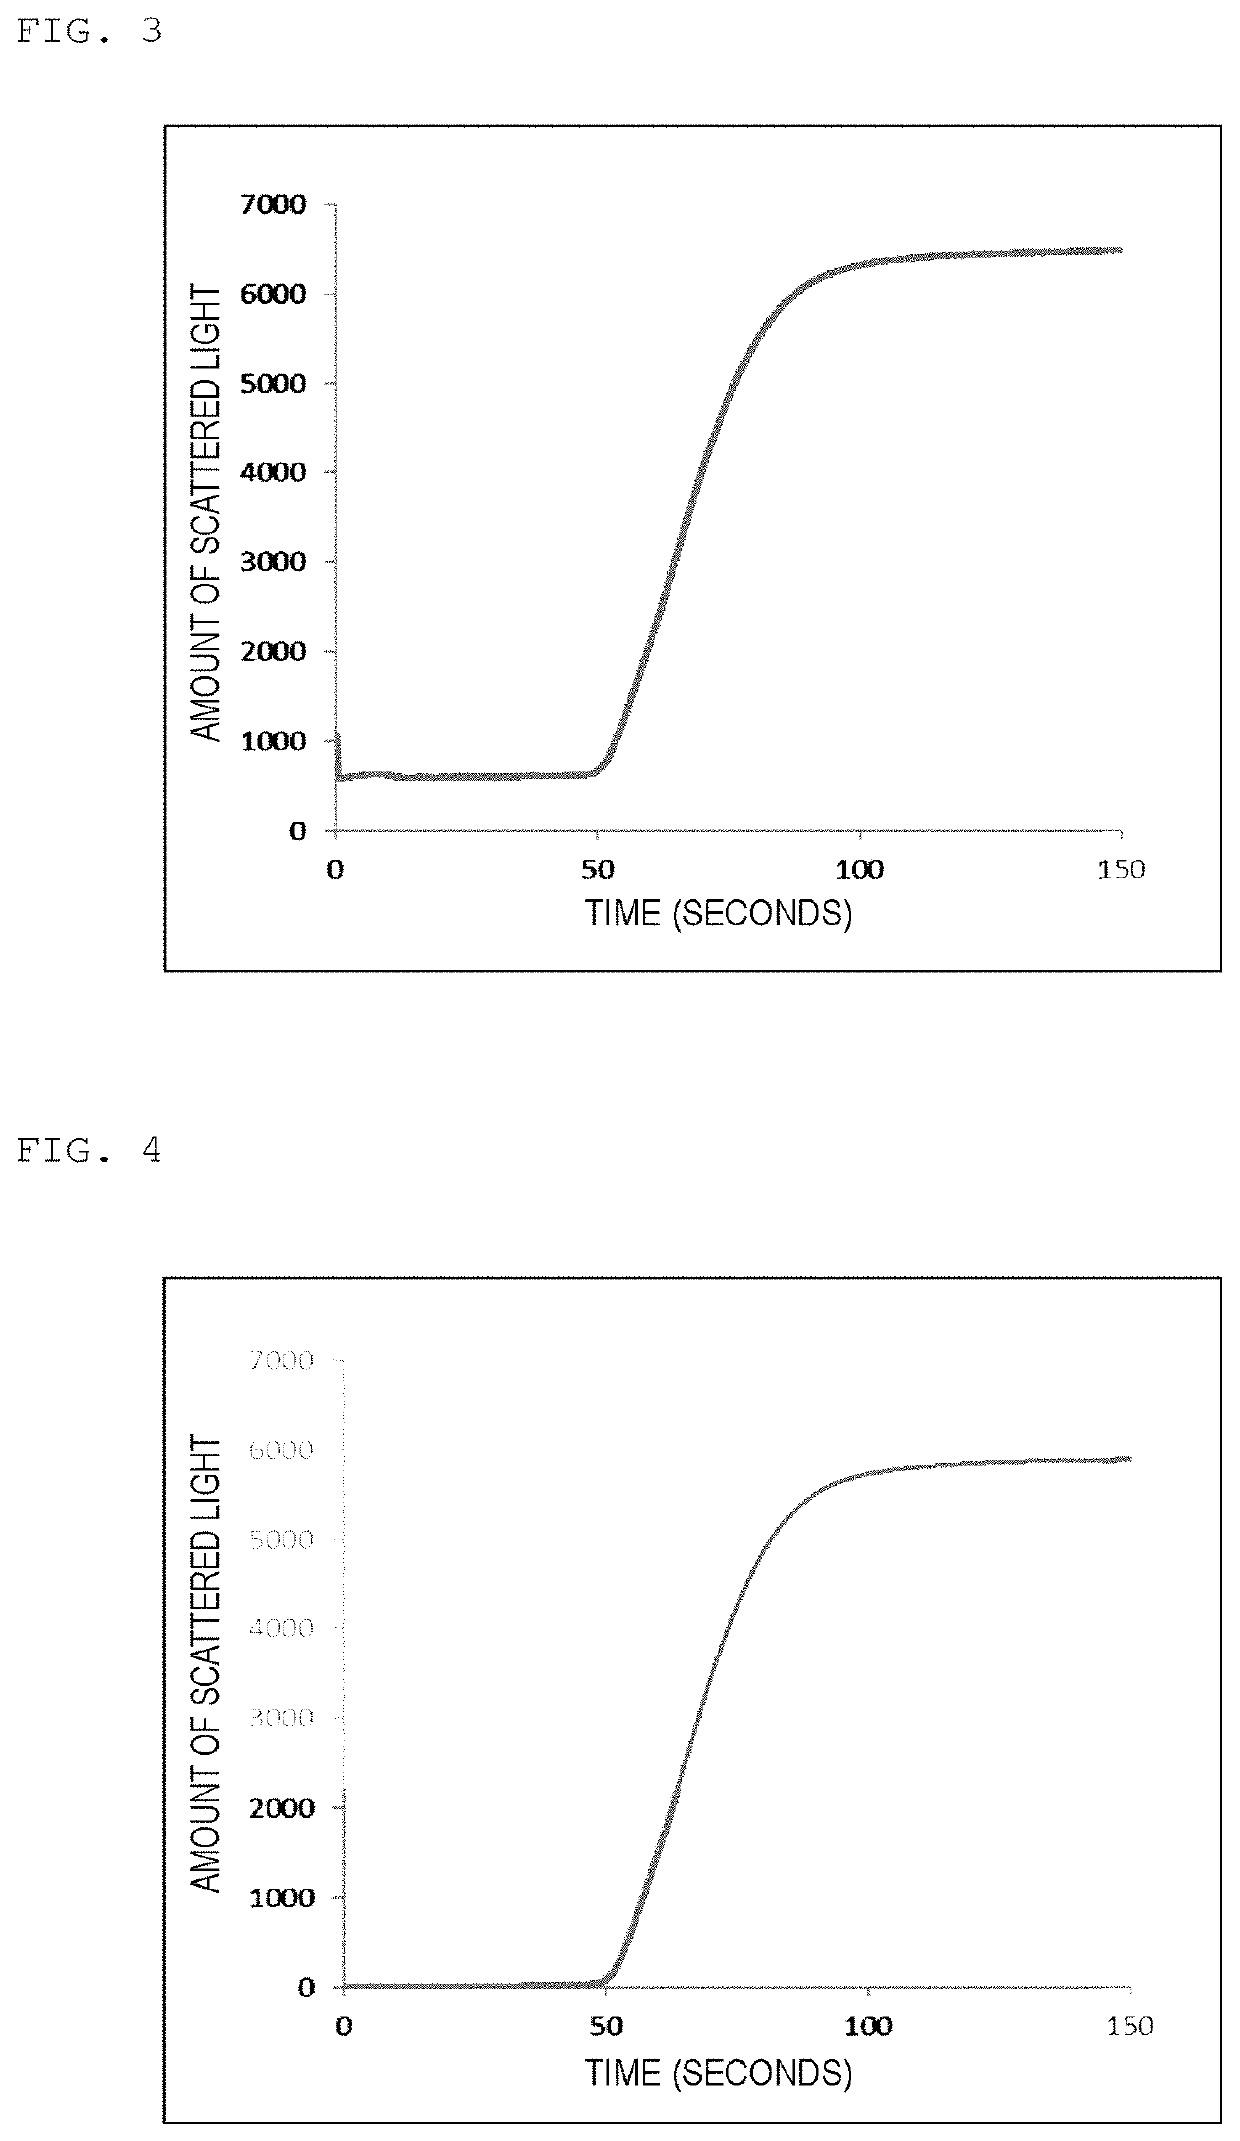
[0209]As a reagent for measurement, Coagpia APTT-N (manufactured by Sekisui Medical Co., Ltd.) being a reagent for APTT measurement was used, and as a calcium chloride solution, a calcium chloride solution, Coagpia APTT-N (manufactured by Sekisui Medical Co., Ltd.) was used. The coagulation reaction measurement of a sample containing a specimen was performed by using a blood coagulation automatic analyzer, CP3000 (manufactured by Sekisui Medical Co., Ltd.). In a cuvette, 50 μL of a reagent for measurement at around 37° C. was added into 50 μL of the specimen heated at 37° C. for 45 seconds, and into the mixture after the lapse of 171 seconds, 50 μL of a 25 mM calcium chloride solution was added to initiate the coagulation reaction. The reaction was performed at 37° C. In the measurement of the coagulation reaction, the cuvette was irradiated with light having a wavelength of 660 nm using a light-emitting diode (LED) as a light source, and the amo...
example 2
tion of FVIII Activity or Abnormality of Test Specimen Using Parameter Group
[0237](1) Determination of FVIII Activity
[0238]A regression analysis was performed between the test parameter group obtained from a test specimen, and the corresponding template parameter group obtained from each template specimen. As the parameter group, a parameter group A-1 acquired in Example 1 was used. FIG. 16 shows the results of the top 5 cases in descending order of the correlation coefficient among the results of regression analysis with a test specimen derived from a patient with severe hemophilia A (VS-HA) having a FVIII activity of less than 0.2% (Sample AF, APTT time: 118.1 seconds, and FVIII<0.2%). Further, the labels on the horizontal axis and the vertical axis of each diagram in FIG. 16 indicate the FVIII activity and APTT time of template and test specimens, respectively. Since the correlation coefficient of these 5 cases was 0.98 or more, the presence of a template specimen having a high c...
example 3
e in Determination Results Due to Difference in Evaluation Criteria for Correlation
[0244]In order to confirm the difference in the determination results due to the difference of the evaluation criteria for correlation, a comparison study was conducted under the following two conditions in which only the evaluation criteria for correlation are different. As the parameter group, a parameter group A-4 was used.
[0245]Evaluation criteria 1 for correlation: Linear regression equations for the parameter groups between all the template specimens and the test specimens were determined, template specimens having a tilt of the regression line in the range of from 0.87 to 1.13 were selected, and a template specimen with which the correlation coefficient was the highest was selected from the selected template specimens (the same evaluation criteria as in Example 2).
[0246]Evaluation criteria 2 for correlation: Linear regression equations for the parameter groups between all the template specimens...
PUM
 Abstract
Description
Claims
Application Information