Combinative multivariate calibration that enhances prediction ability through removal of over-modeled regions

a multi-variate calibration and prediction capability technology, applied in the field of multi-variate analysis of spectral signals, can solve the problems of erroneous prediction of subsequent prediction matrices, noise in the data may be incorporated into the model, and the disadvantage of multi-variate techniques such as principal component regression and partial least squares regression

Inactive Publication Date: 2005-03-22
GLT ACQUISITION
View PDF6 Cites 53 Cited by
  • Summary
  • Abstract
  • Description
  • Claims
  • Application Information

AI Technical Summary

Problems solved by technology
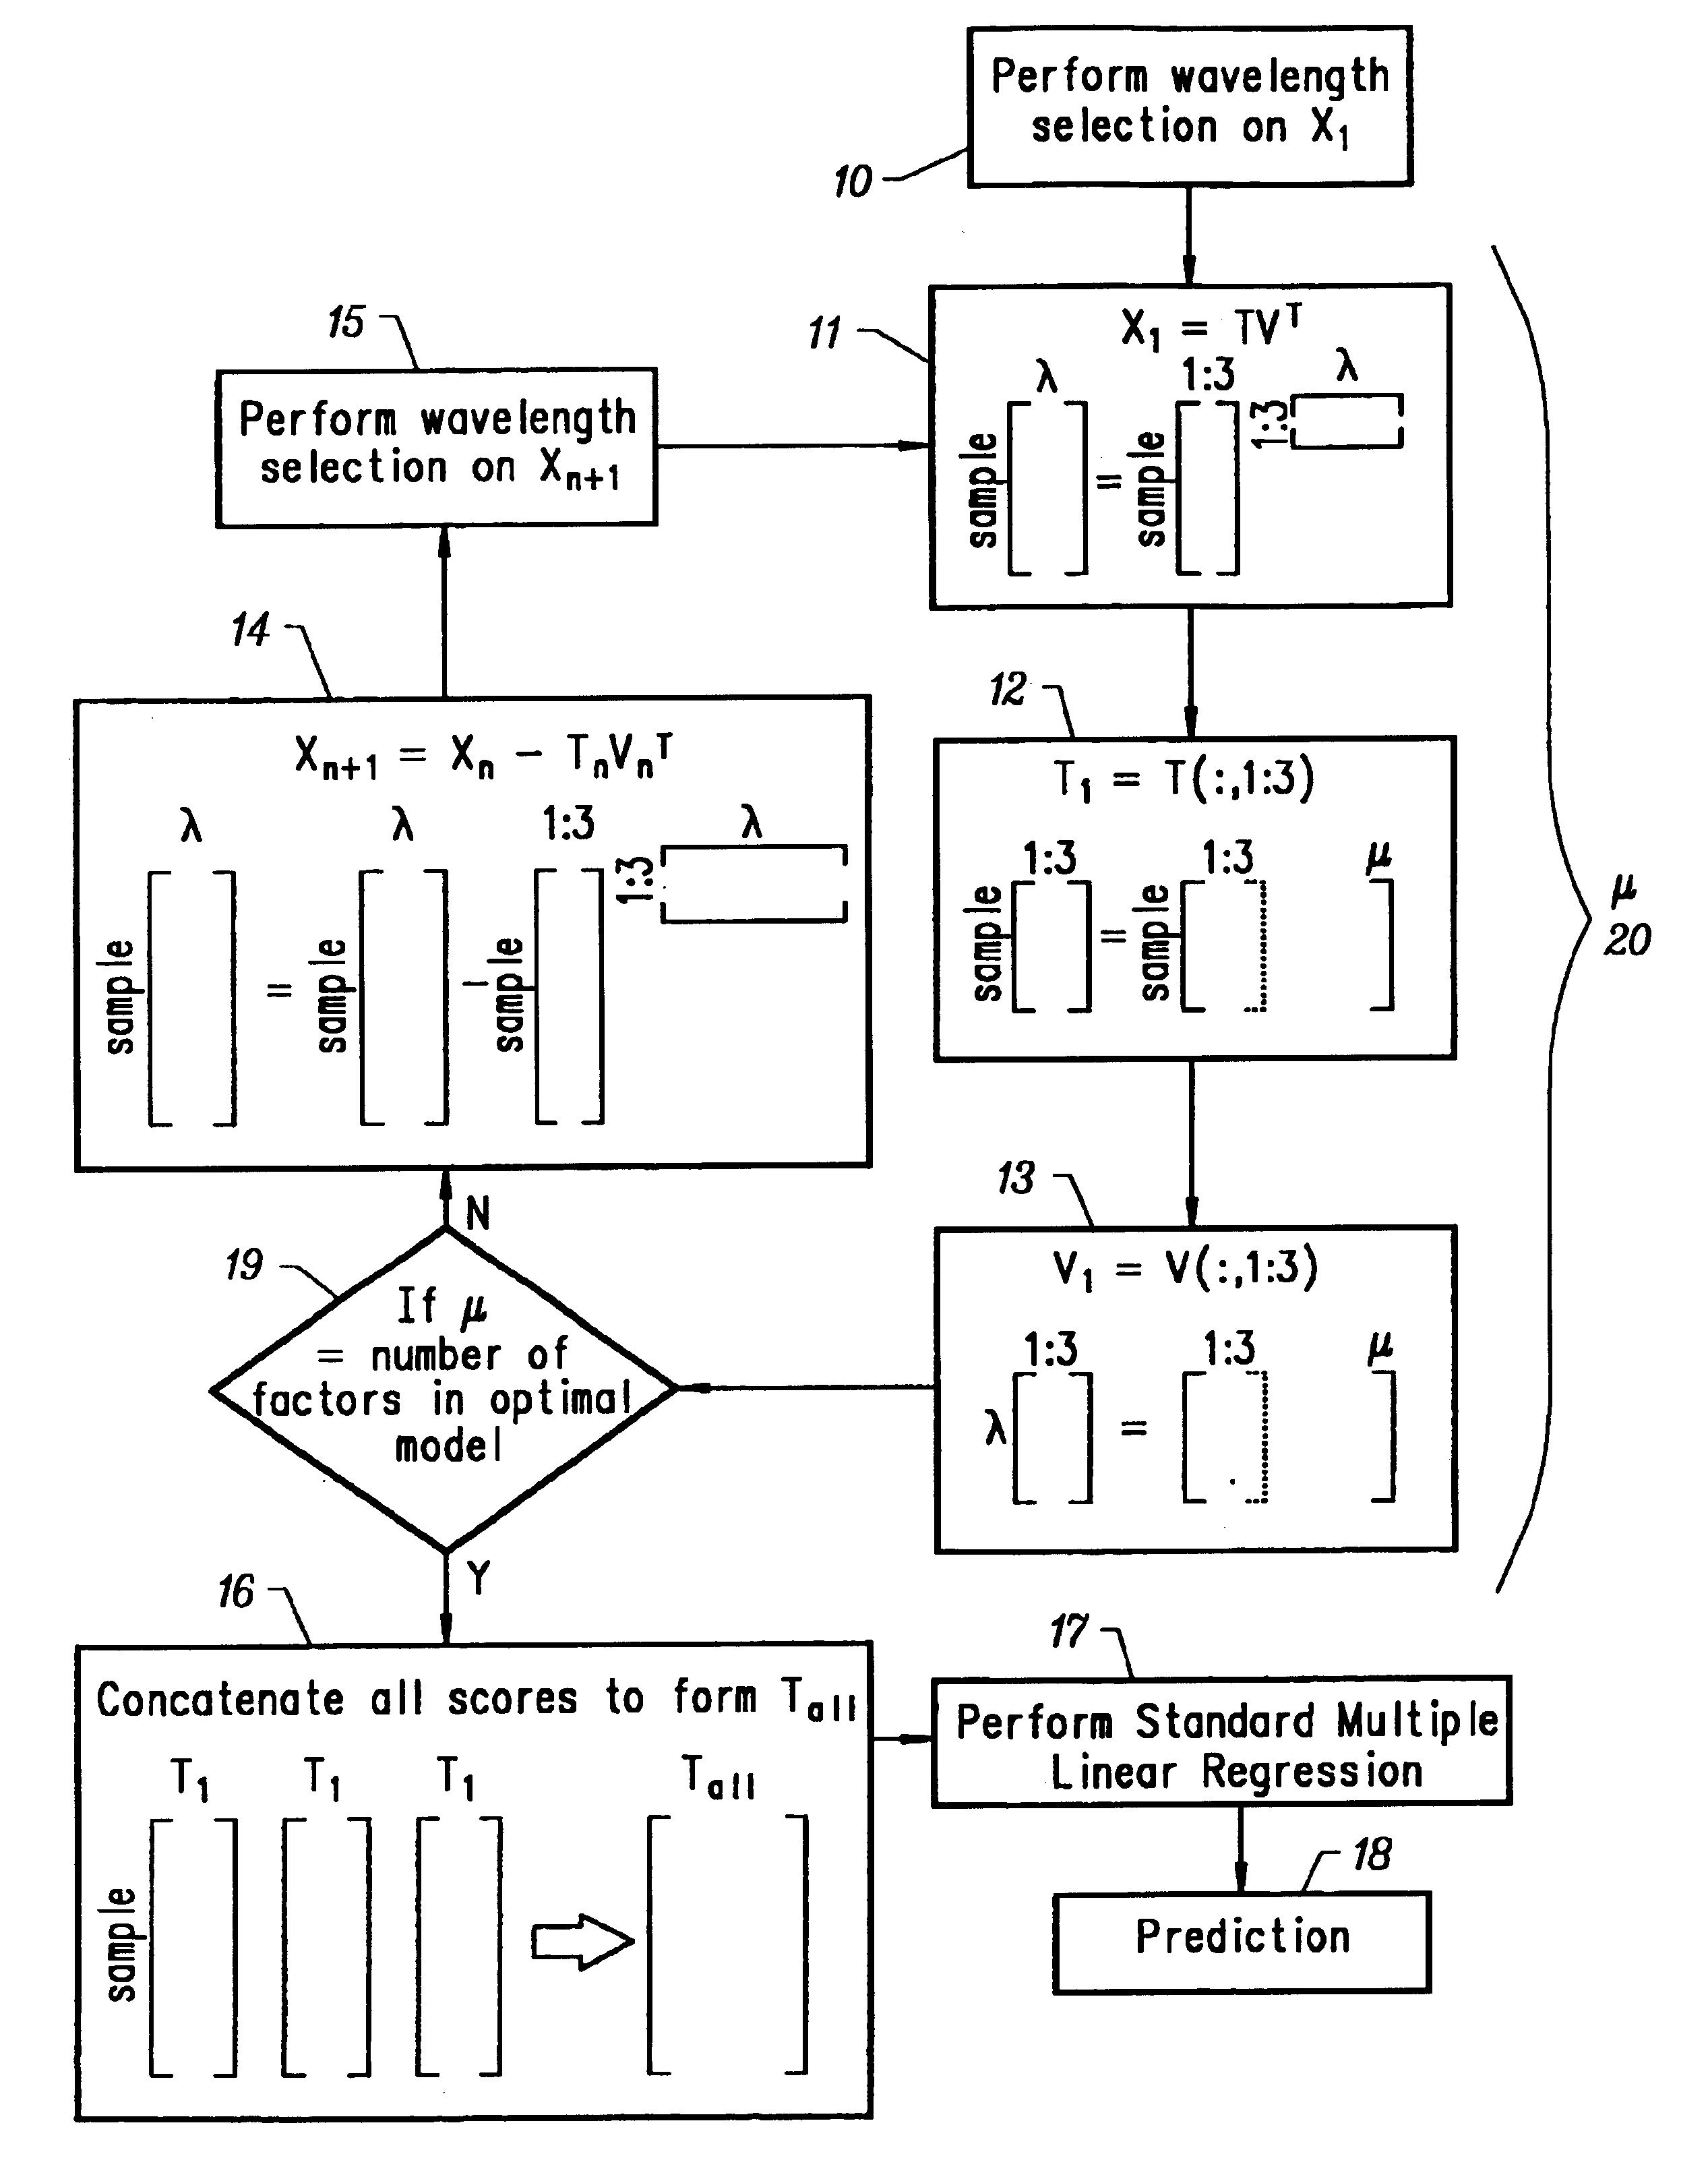
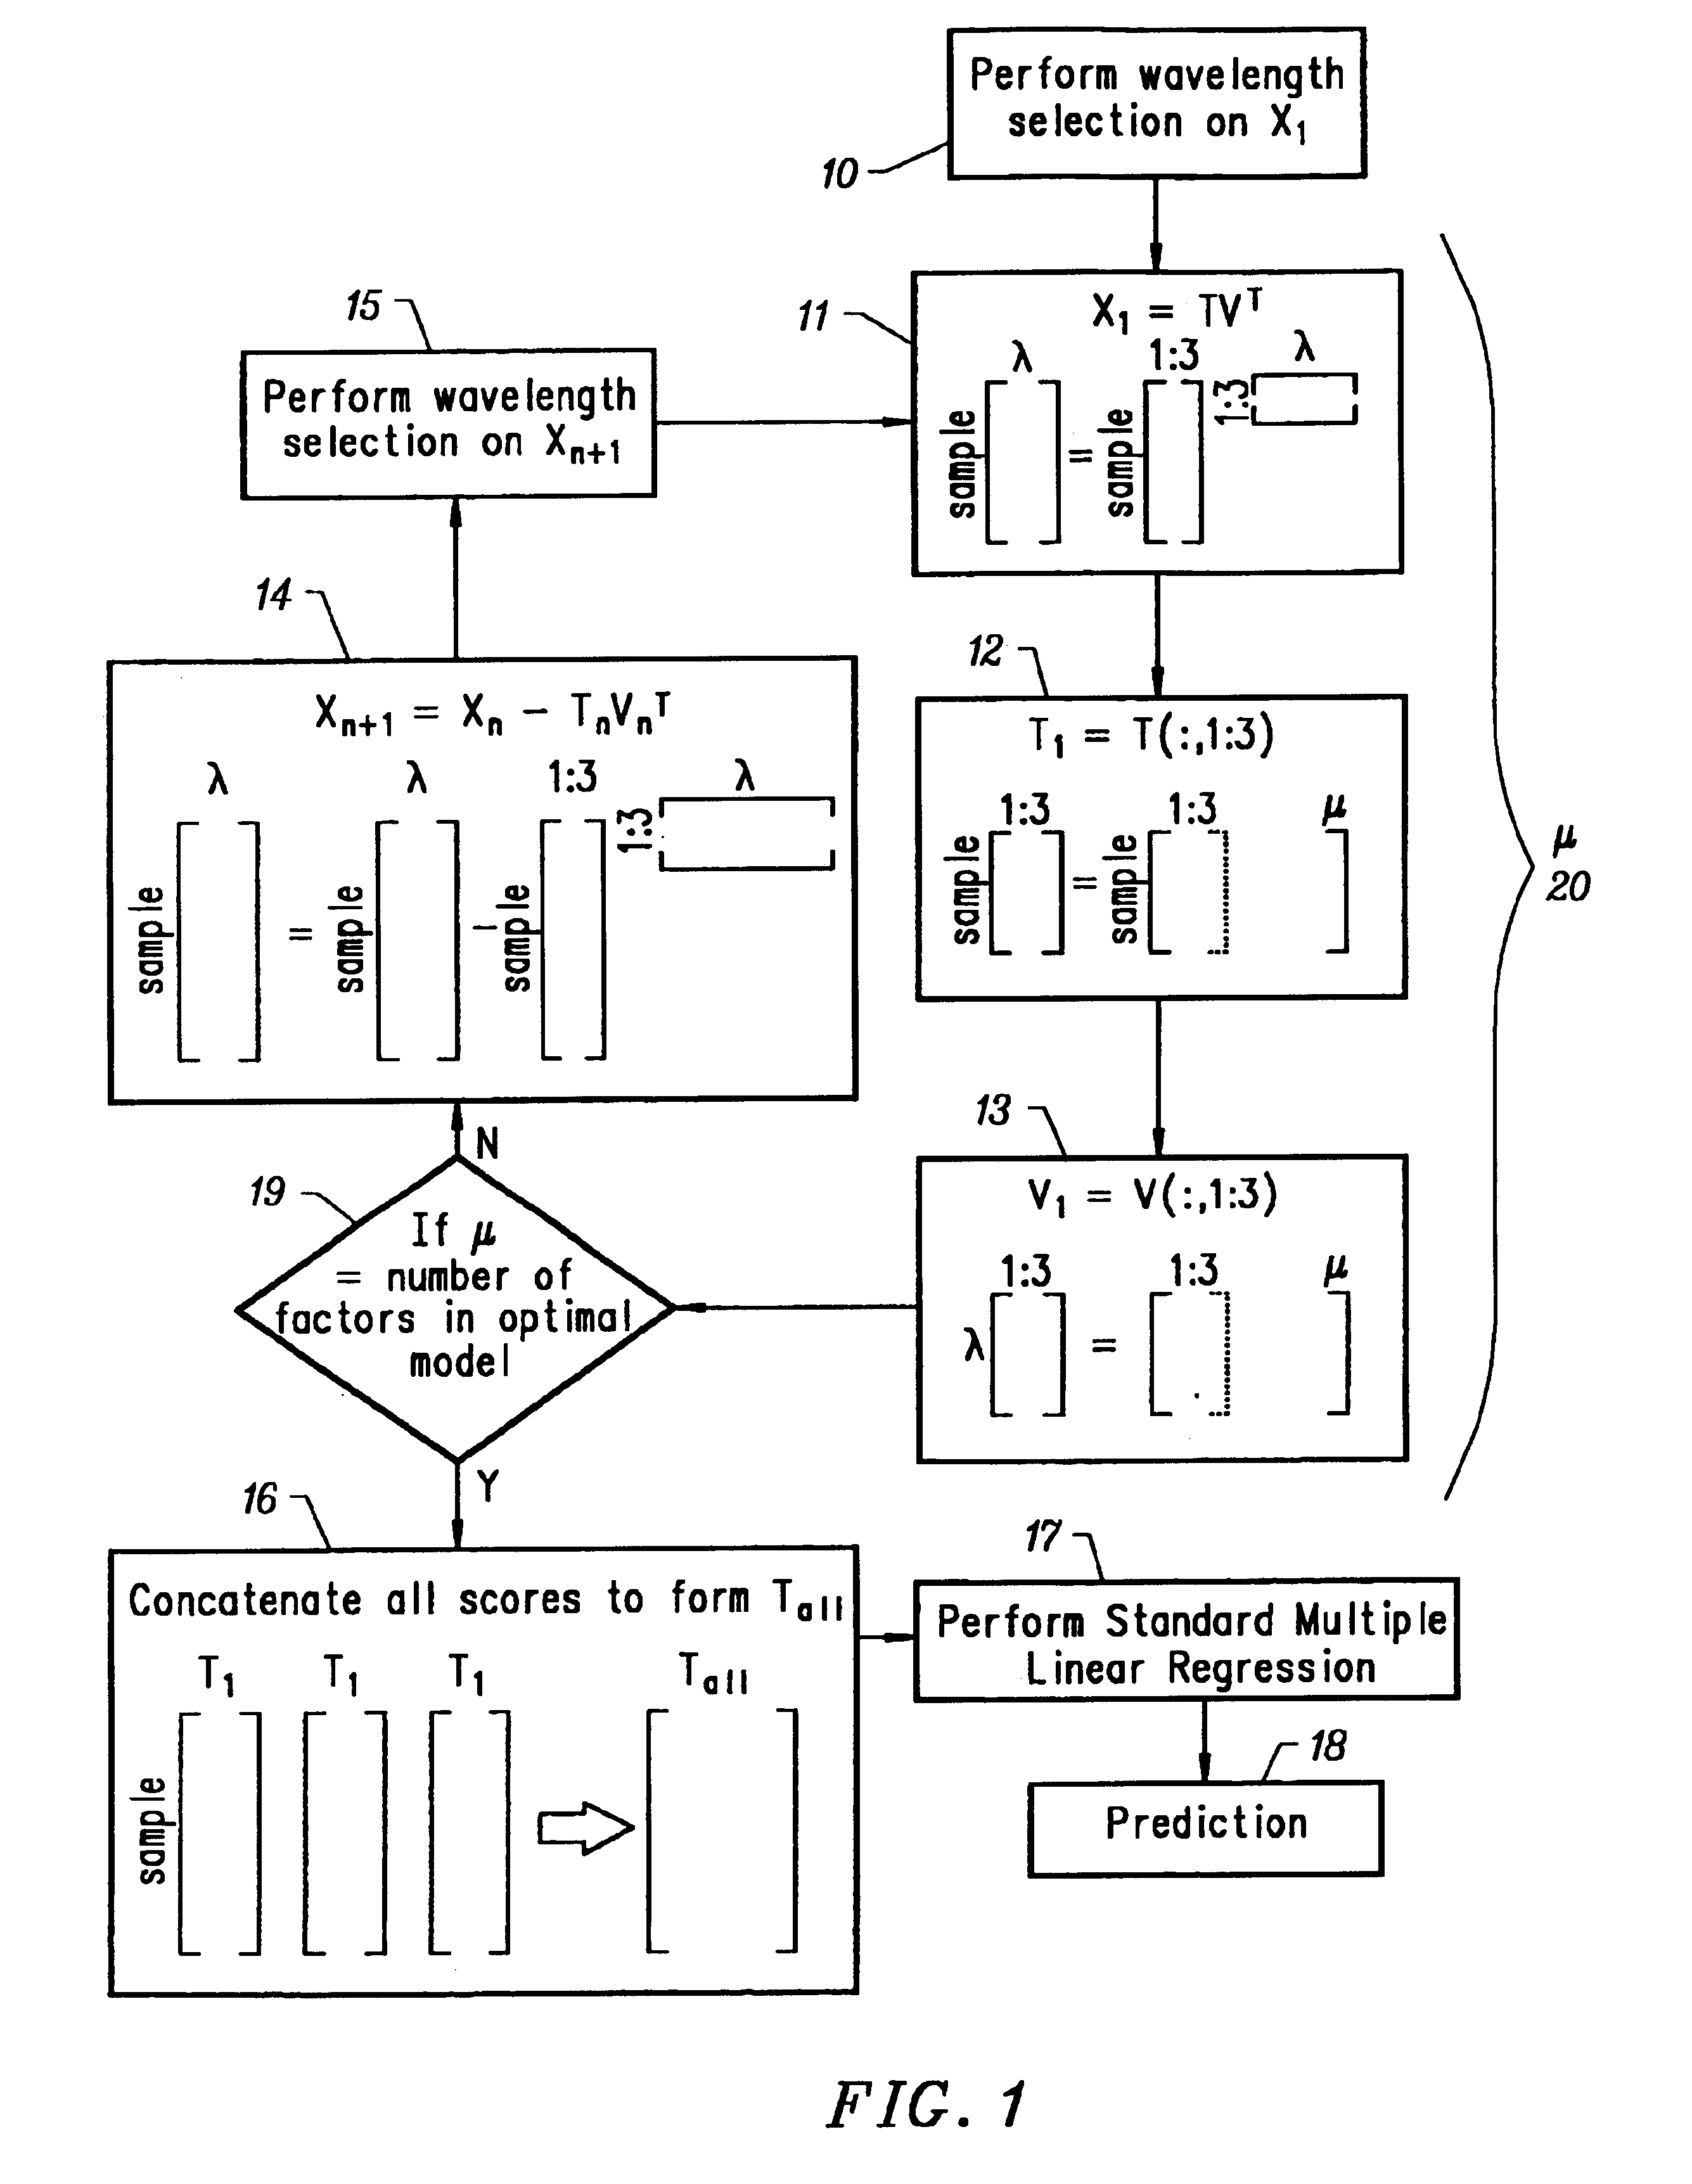
However, multivariate techniques such as principal component regression (PCR) and partial least squares regression (PLS) have some inherent disadvantages.
One well-documented problem with multivariate analysis is that noise in the da

Method used


Image

  • Combinative multivariate calibration that enhances prediction ability through removal of over-modeled regions
  • Combinative multivariate calibration that enhances prediction ability through removal of over-modeled regions
  • Combinative multivariate calibration that enhances prediction ability through removal of over-modeled regions

Examples


example

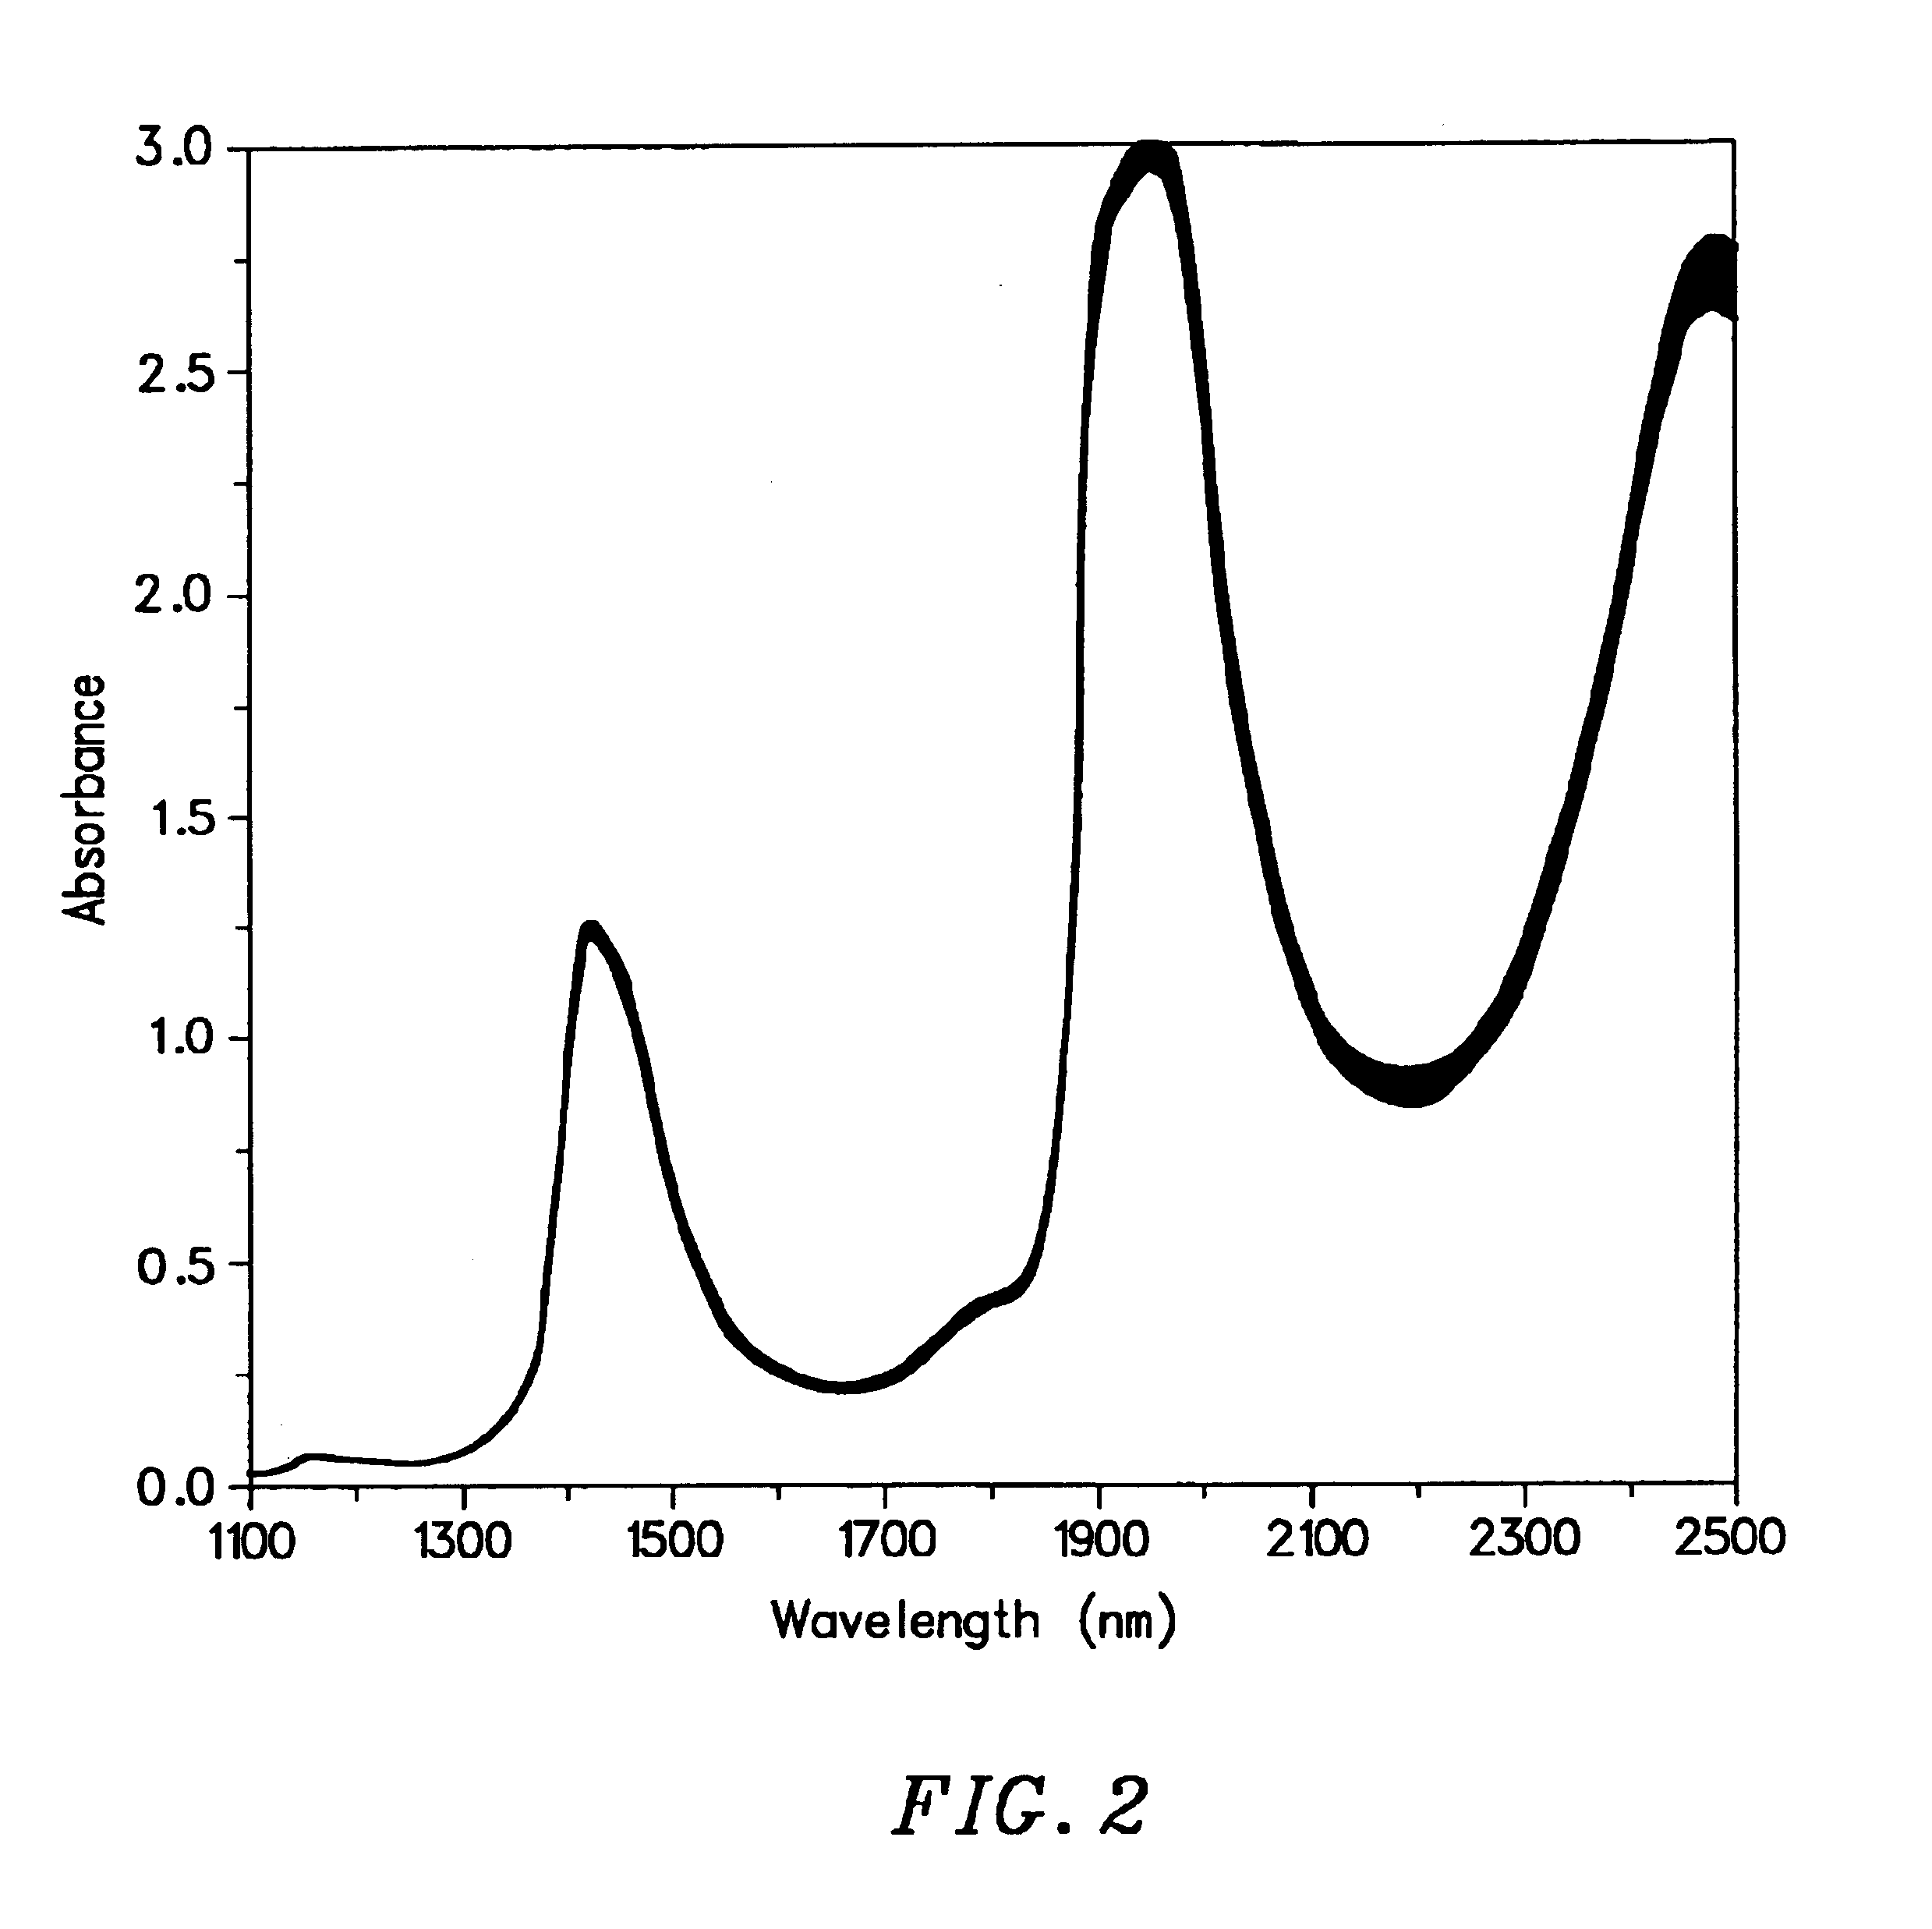
Phantom Serum Spectra Generation: Near-IR absorbance spectra of water, albumin, triglycerides, cholesterol, glucose and urea with a concentration of 1 g / dL at 37.0° C. and a 1 mm pathlength were generated from spectra collected on a NICOLET 860 IR Spectrometer, supplied by Nicolet Instrument Corporation of Madison Wis., in transmission mode with subsequent multivariate curve resolution analysis. The pure component spectra were used to generate phantom serum spectra by additive additions of the absorbances of the constituent components, where the concentration of each constituent was randomly selected from the concentration ranges in Table 1, below. Noise proportional to the resulting spectral absorbance at each wavelength was then added, with the standard deviation of the added noise being a percentage of the total absorbance; thus yielding spectra with increased noise levels at higher absorbance levels.

TABLE 1Concentration Range of Constituents Used in Serum Phantom.ConcentrationCo...


PUM


Abstract

A novel multivariate model for analysis of absorbance spectra allows for each wavelength or spectral region to be modeled with just enough factors to fully model the analytical signal without the incorporation of noise by using excess factors. Each wavelength or spectral region is modeled utilizing its own number of factors independently of other wavelengths or spectral regions. An iterative combinative PCR algorithm allows a different number of factors to be applied to different wavelengths. In an exemplary embodiment, a three-factor model is applied over a given spectral region. The residual of the three-factor model is calculated and used as the input for an additional five-factor model. Prior to the additional five factors being applied, some of the wavelengths are removed. This leads to a three-factor model over the first region and an eight-factor model over the second region. This analysis of residuals can be repeated such that a one to n factor model could be applied to any given wavelength, or rather any number of factors may be employed to model any given frequency or spectral region. A method of predicting concentration of a target analyte from sample spectra applies a calibration developed using the inventive PCR algorithm to a matrix of sample spectral to generate a vector of predicted concentrations for the target analyte.

Description

BACKGROUND OF THE INVENTION1. Field of the InventionThe invention relates to multivariate analysis of spectral signals. More particularly, the invention relates to a method of multivariate analysis of: a spectral signal that allows for a wavelength or spectral region to be modeled with just enough factors to fully model the analytical signal without the incorporation into the model of noise by using excess factors.2. Description of Related ArtMultivariate analysis is a well-established tool for extracting a spectroscopic signal, usually quite small, of a target analyte from a data matrix in the presence of noise, instrument variations, environmental effects and interfering components. Various methods and devices have been described that employ multivariate analysis to determine an analyte signal. For example, R. Barnes, J. Brasch, D. Purdy, W. Loughheed, Non-invasive determination of analyte concentration in body of mammals, U.S. Pat. No. 5,379,764 (Jan. 10, 1995) describe a method ...

Claims


Application Information

Patent Timeline
IPC IPC(8): G01N21/27G01N21/31G01N21/35G01N21/25
CPCG01N21/274G01N21/359G01N21/3577
Inventor HAZEN, KEVIN H.THENNADIL, SURESHRUCHTI, TIMOTHY L.
Owner GLT ACQUISITION
Why Eureka
Try Eureka