

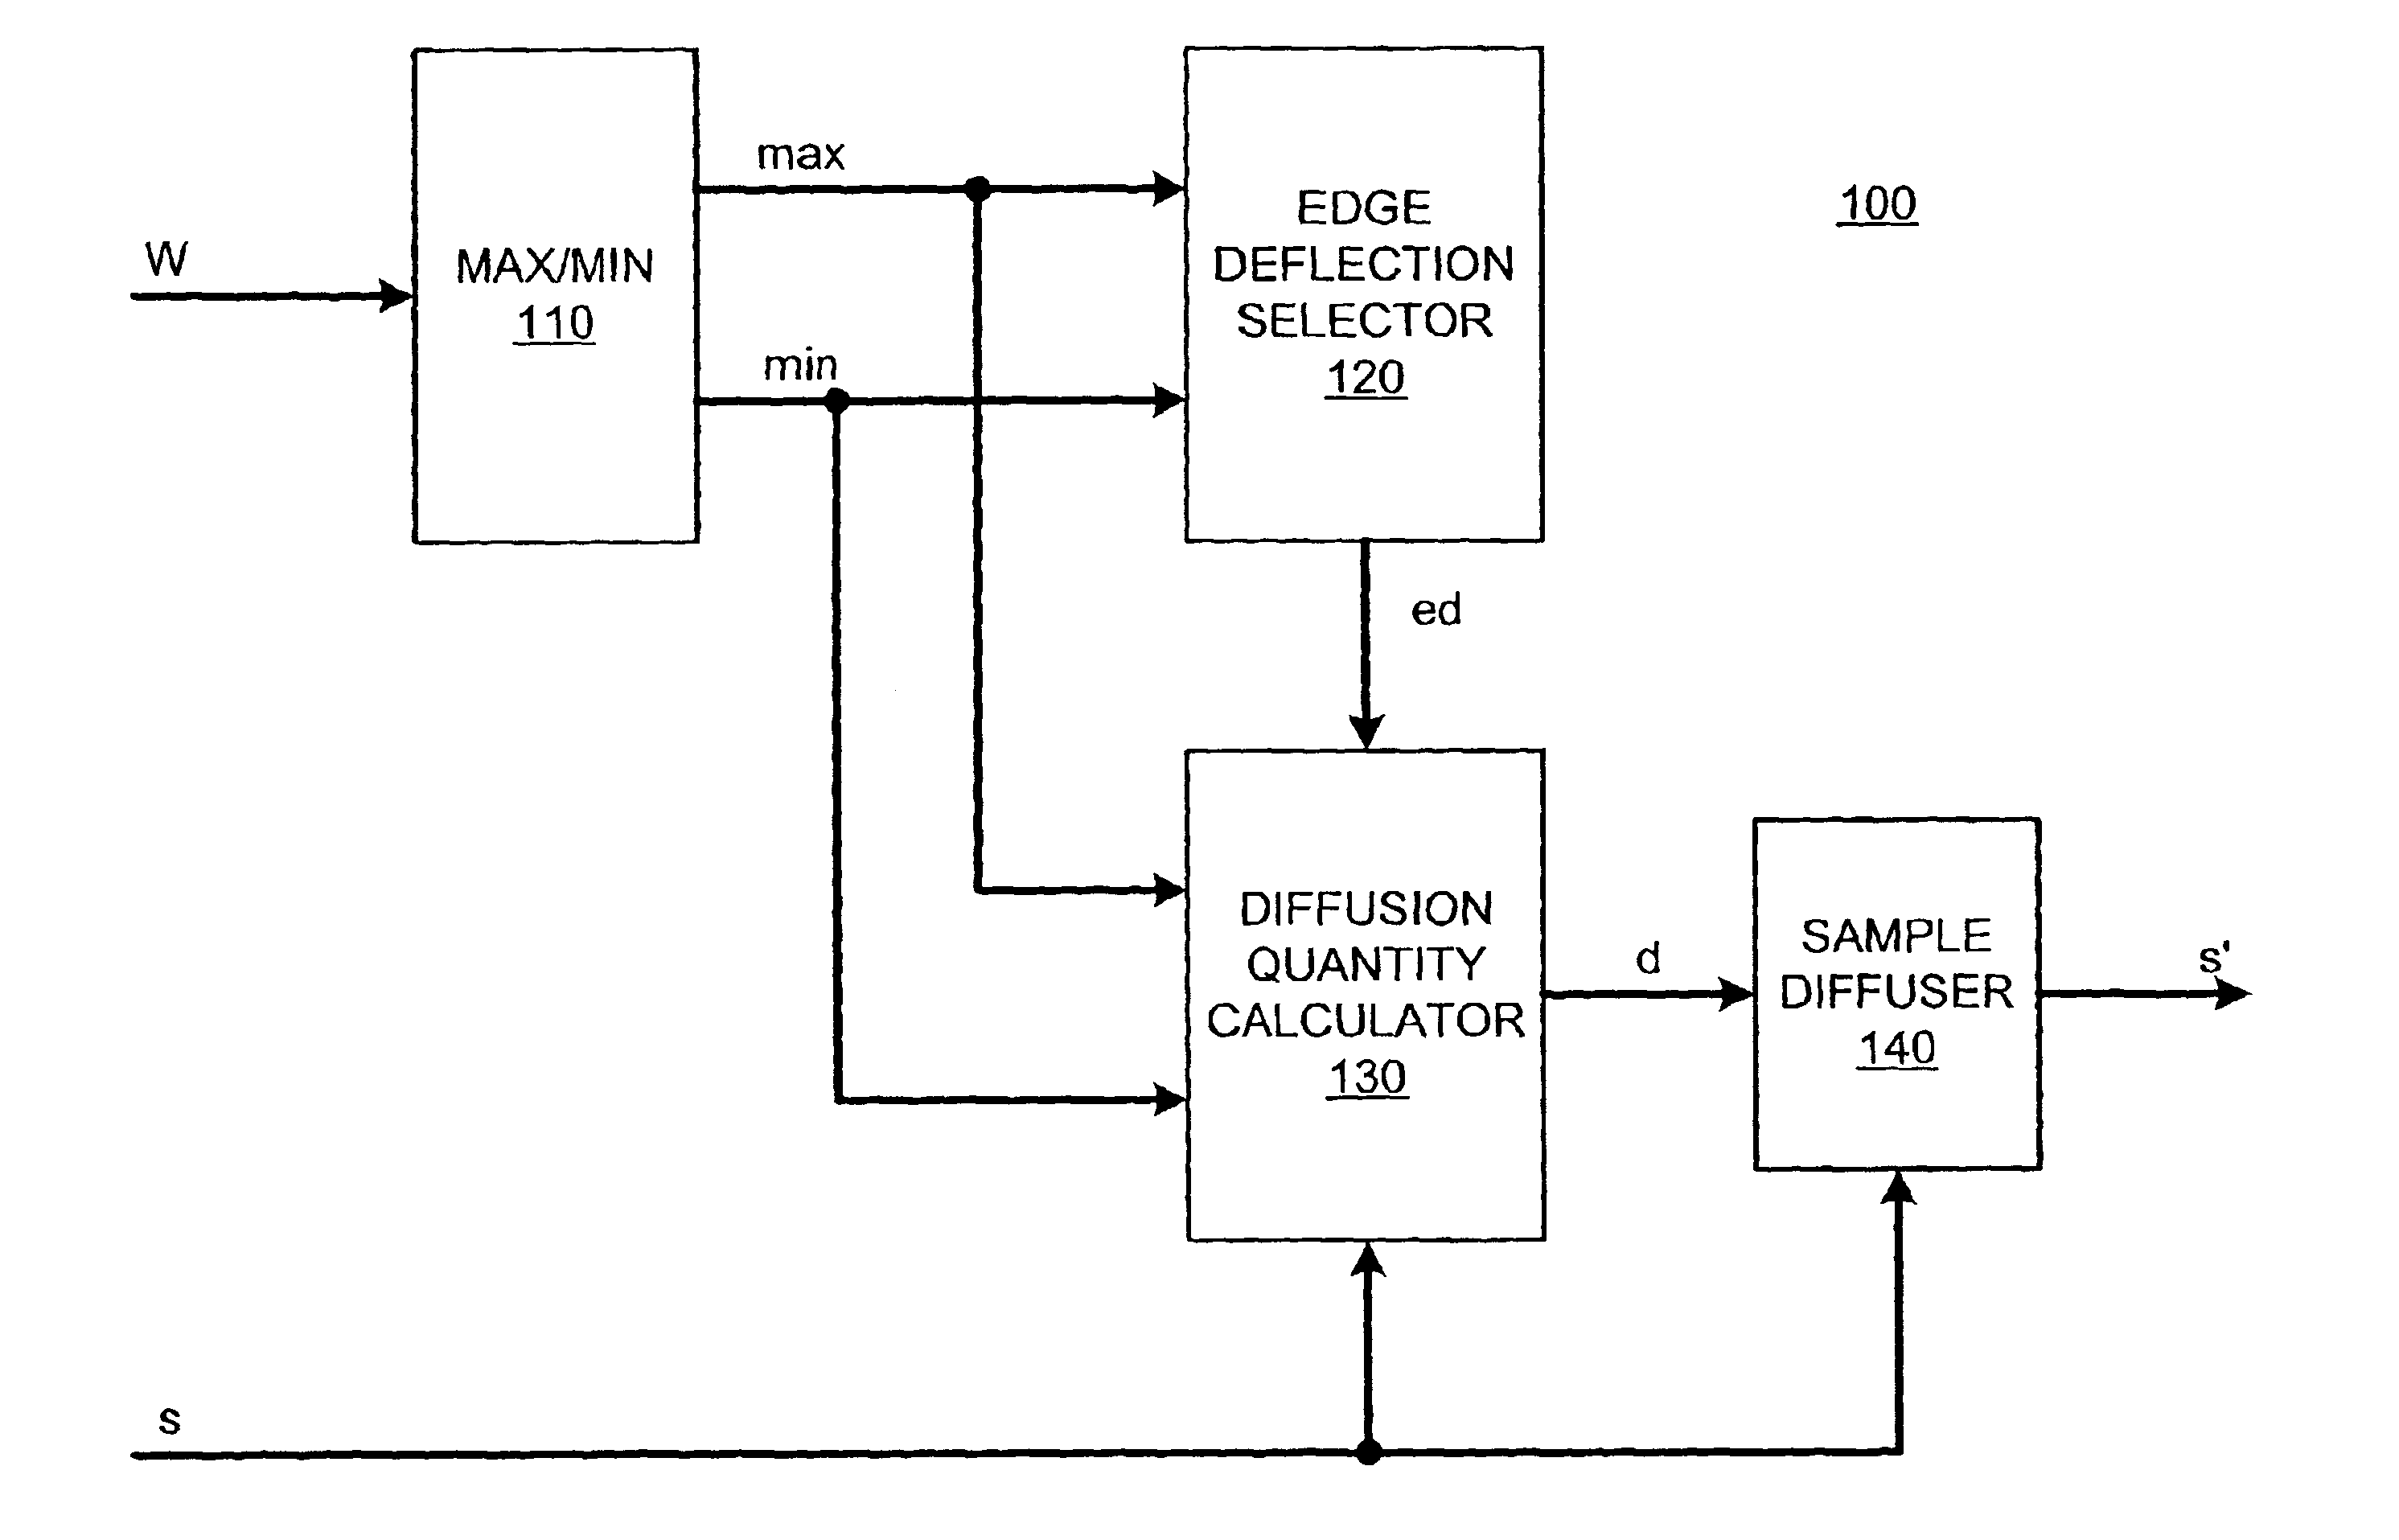
Nonlinear edge-enhancement filter
- Summary
- Abstract
- Description
- Claims
- Application Information
AI Technical Summary
Benefits of technology
Problems solved by technology
Method used
Image

Examples
Embodiment Construction
The following examples rely heavily on one-dimensional digital data arrays, such as might be obtained by temporally sampling the output of a sensor. Such examples are easily comprehended and are presented for ease of description. Nevertheless, those skilled in the art will recognize that the present invention has application for a general n-dimensional array, regardless of the source of the data in the array. Particular embodiments of the present invention have been demonstrated to work well on two-dimensional data arrays such as grayscale and color images.
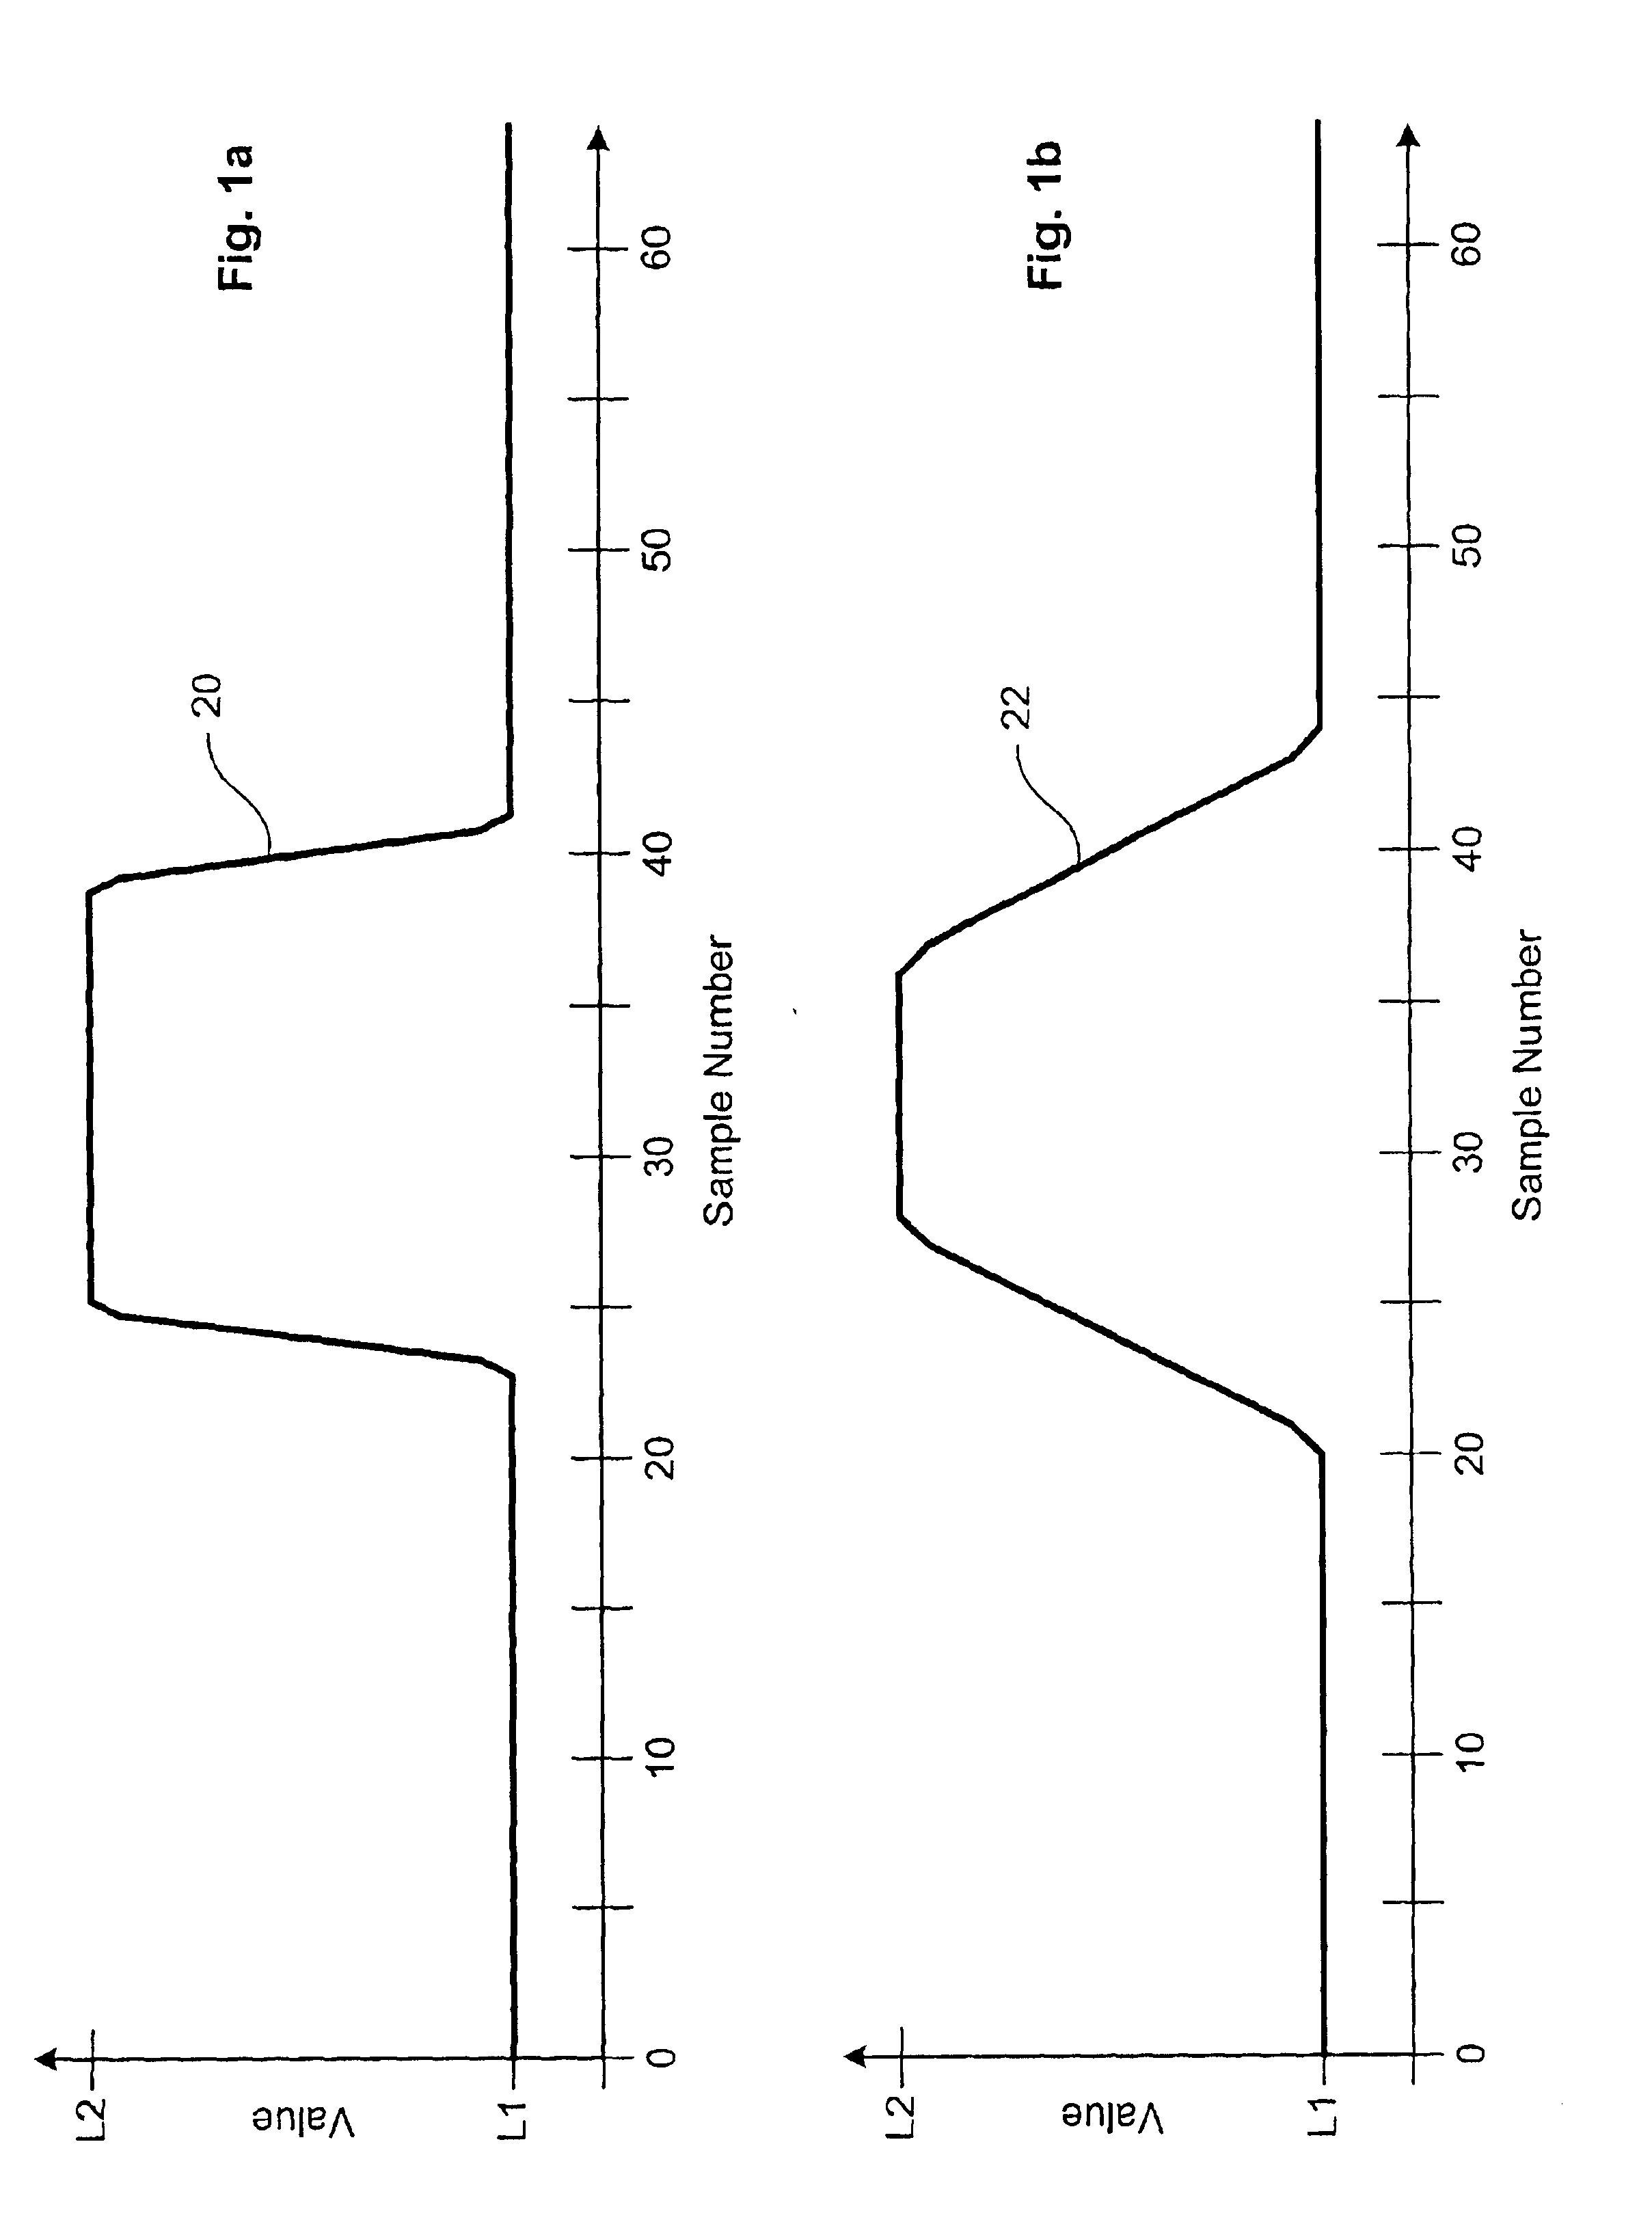
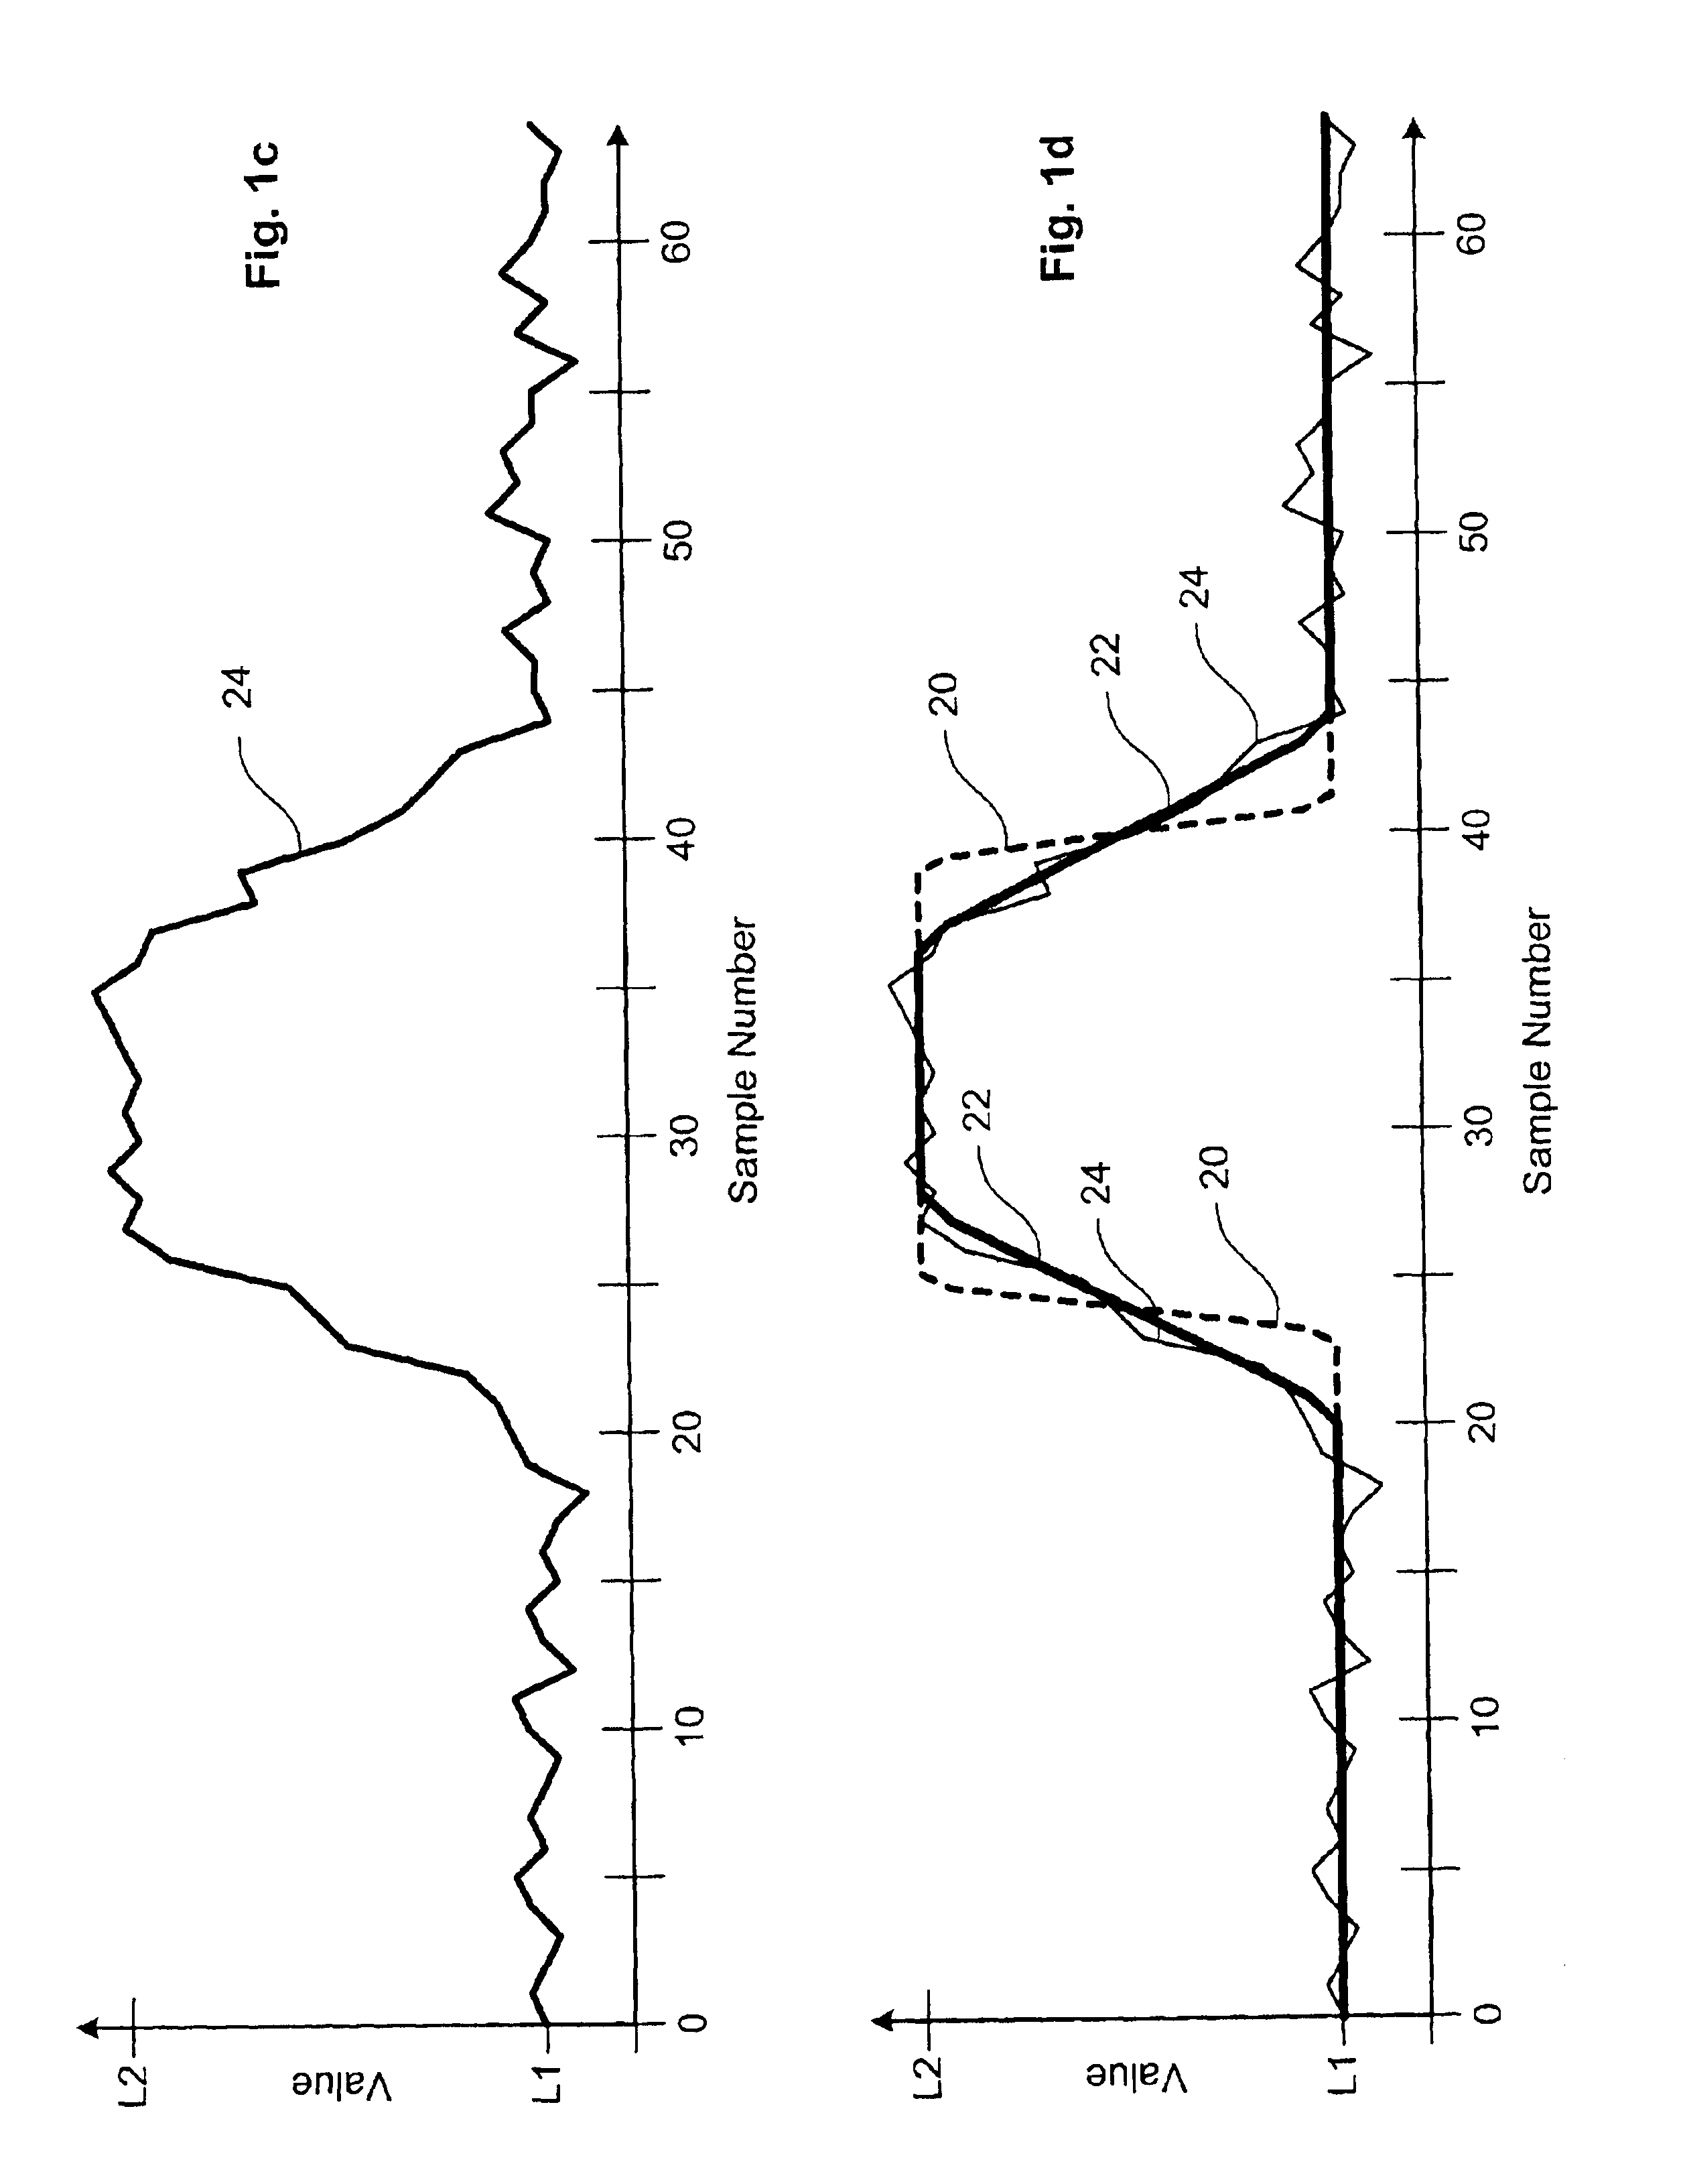
Referring first to FIGS. 1a and 1b, a one-dimensional digitally sampled rectangular pulse is illustrated, with the leading pulse edge centered at sample 24 and the trailing pulse edge centered at sample 40. Each pulse has a minimum value L1 and a maximum value L2. The difference between the two figures is the sharpness of the pulse edges. For a one-dimensional signal s(x), a positive step edge can be characterized by the equation ...
PUM
 Abstract
Description
Claims
Application Information