Method and system for visually representing network configurations

a network configuration and network configuration technology, applied in data switching networks, instruments, digital transmission, etc., can solve the problems of hub network layout, application adaptation not being able to facilitate network managers or other users to efficiently use, and the expected increase in the complexity of network configurations

Inactive Publication Date: 2005-09-06
CIENA
View PDF10 Cites 100 Cited by
  • Summary
  • Abstract
  • Description
  • Claims
  • Application Information

AI Technical Summary

Benefits of technology

[0010]According to a further embodiment of the present invention there is provided a computer program product for representing a network configuration including a plurality of distinct network segments coupled to a centralized node. The product comprises a computer-readable medium and a display module stored on the computer-readable medium for displaying the representation of the network configuration. The product also comprises a list module coupled to the display module for displaying a plurality of attributes of

Problems solved by technology

As new technology is developed the complexity of network configurations is expected to increase, where the complexity of the hub network configuration can be a function of the number of attached segments and the number of network elements per attached segment.
Another issue in networks is hub network layout, which is an intensive and extensive process wherein each network item is carefully mapped to facilitate differentiable and selectable item representations.
Unfortunately, these applications are not adapted to facilitate the Network Managers or other users to efficiently layout, represent, or manage the dense hub network configurations.
However, experience has shown that this single view is only practical in maintaining the hub network with a limited number of segments and associated nodes, such as two to four rings depending upon the complexity of each attached ring.
The single view display can be difficult to interpret by the Network Manager as more connections are represented in the network, since representations of dense complex hub network configurations can create a mesh of lines crossing in all directions.
This can cause problems in distinguishing between specific adjacent attached network segments, in identifying the common node, and in selecting specific network items contained in the display.
Consequently, the topology and connection logic may get lost in a graphical chaos, which can increase the amount of time the Network Manager must spend in analyzing the network.
Furthermore, the nodes and associated link alarms can be overlaid or hidden from view, which can make the visual clutter more acute.
As well

Method used


Image

  • Method and system for visually representing network configurations
  • Method and system for visually representing network configurations
  • Method and system for visually representing network configurations

Examples


Embodiment Construction

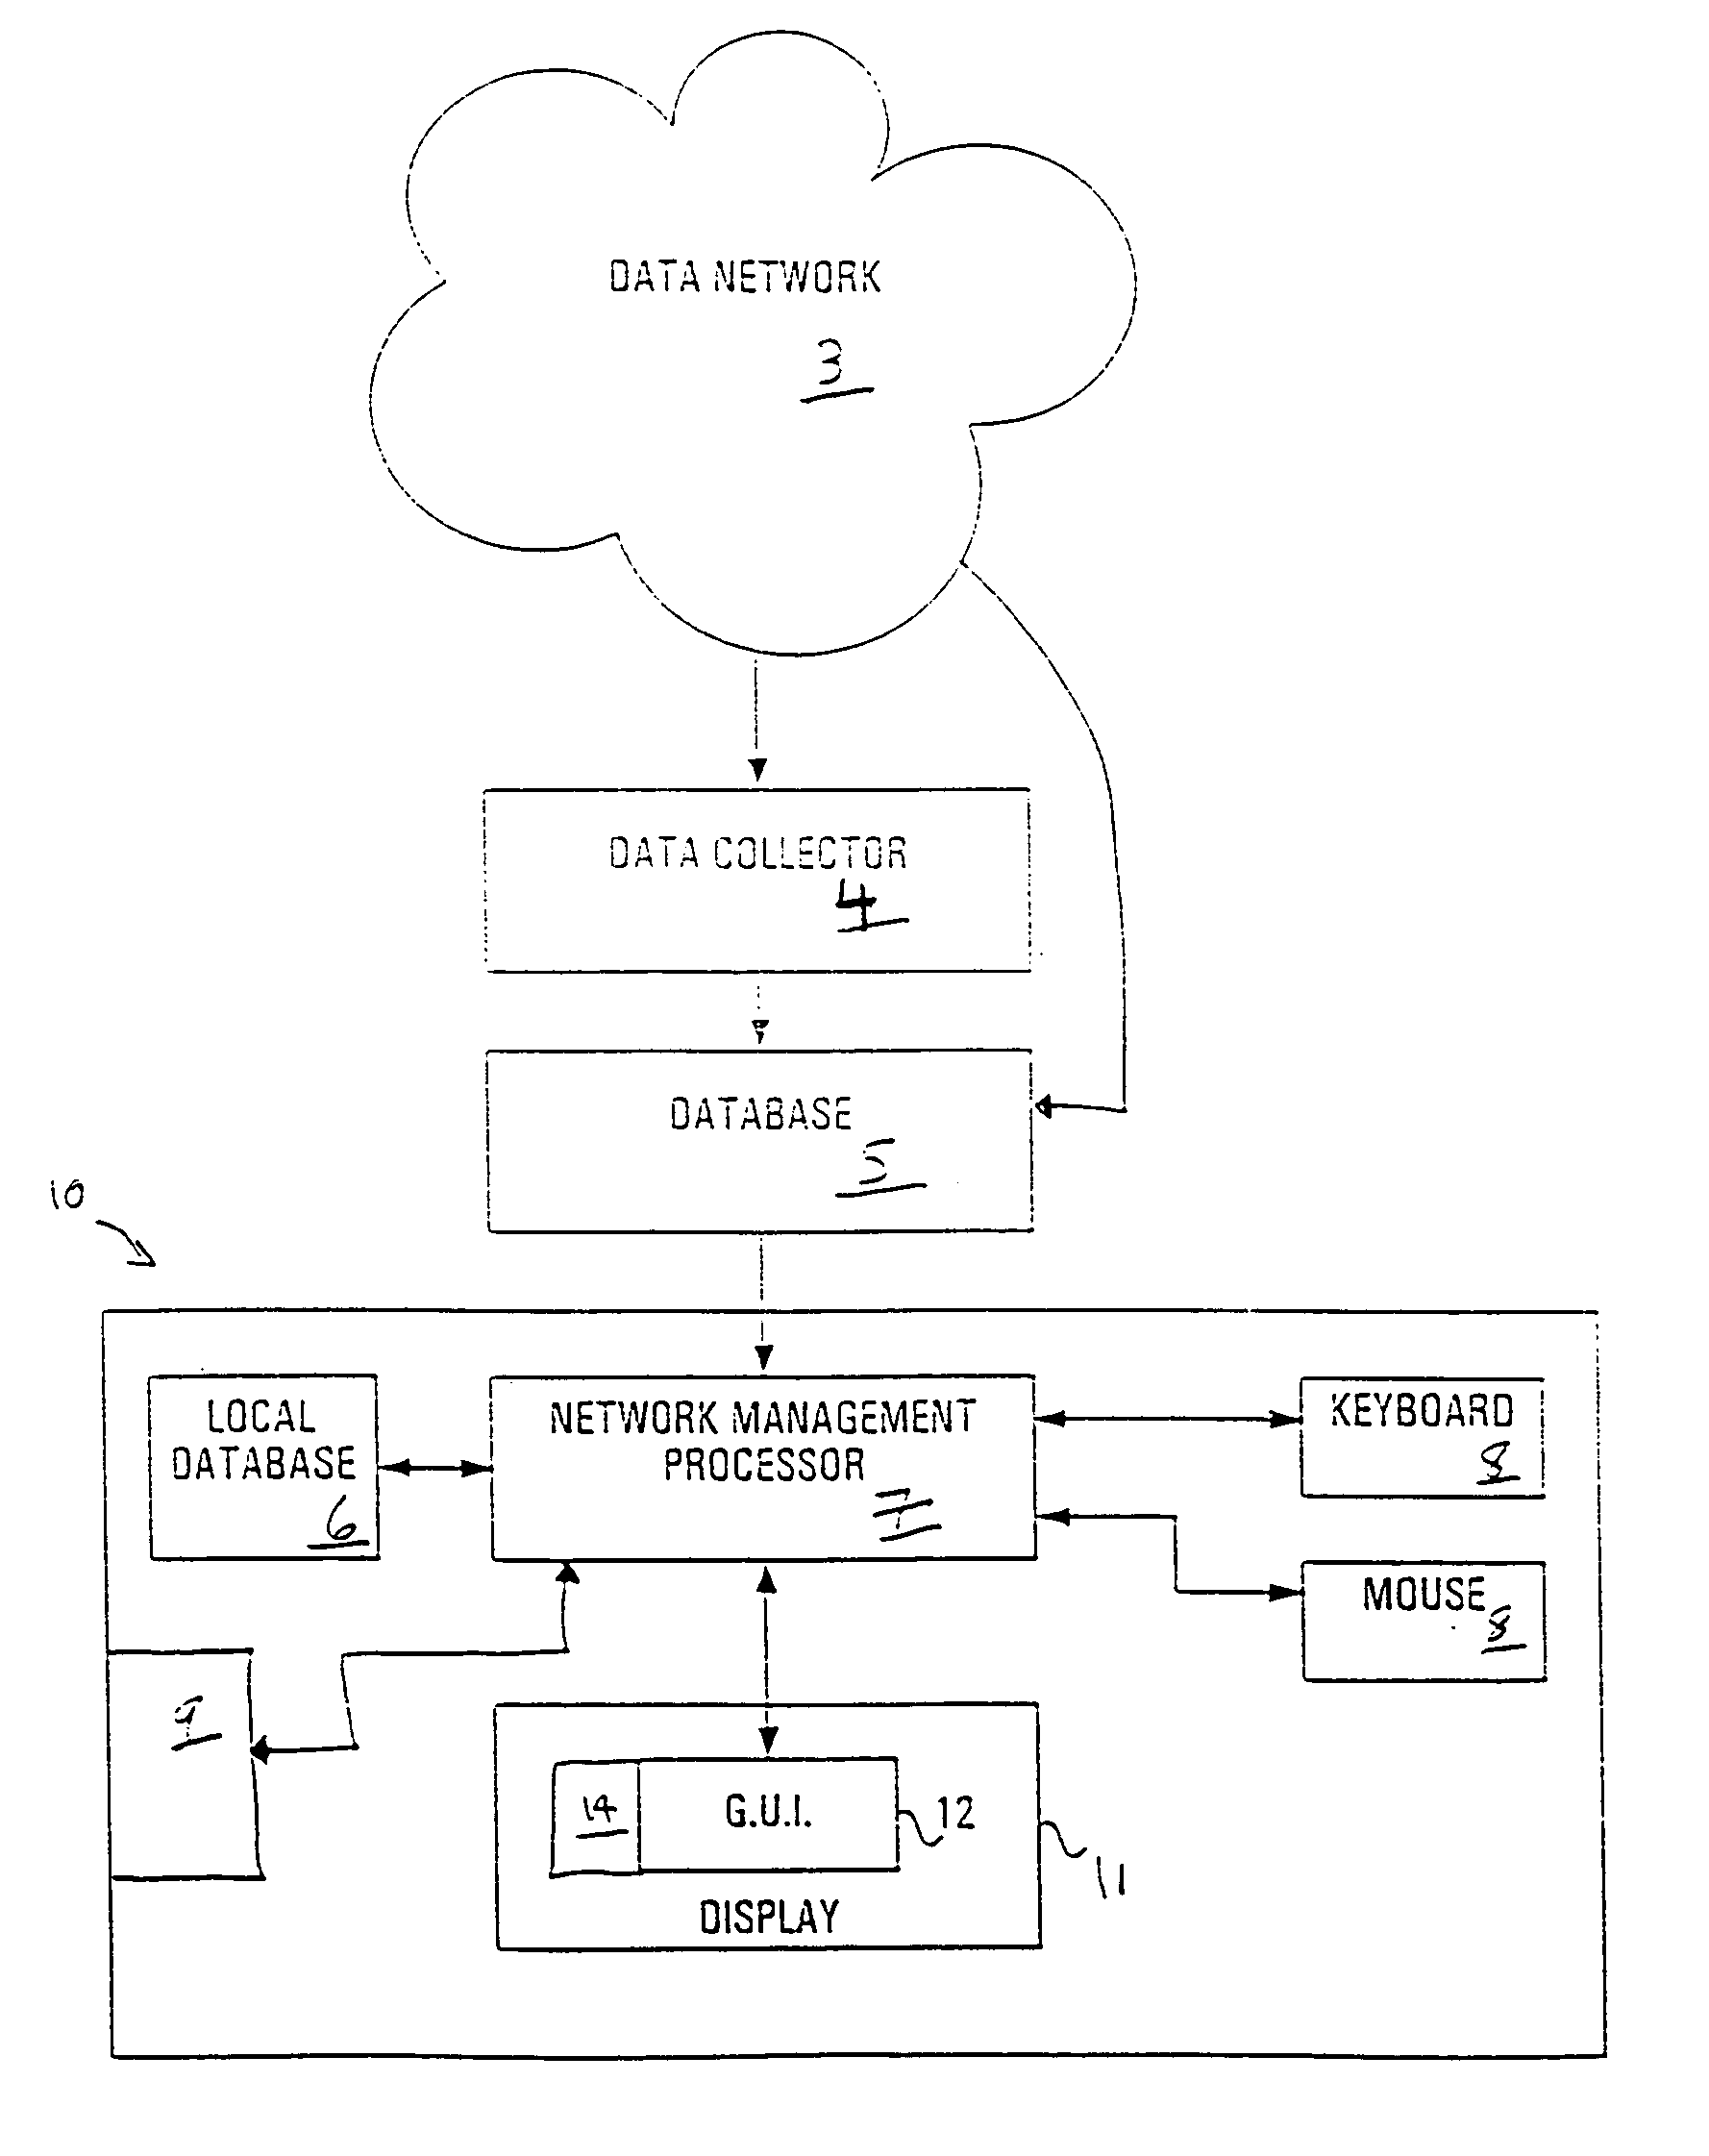
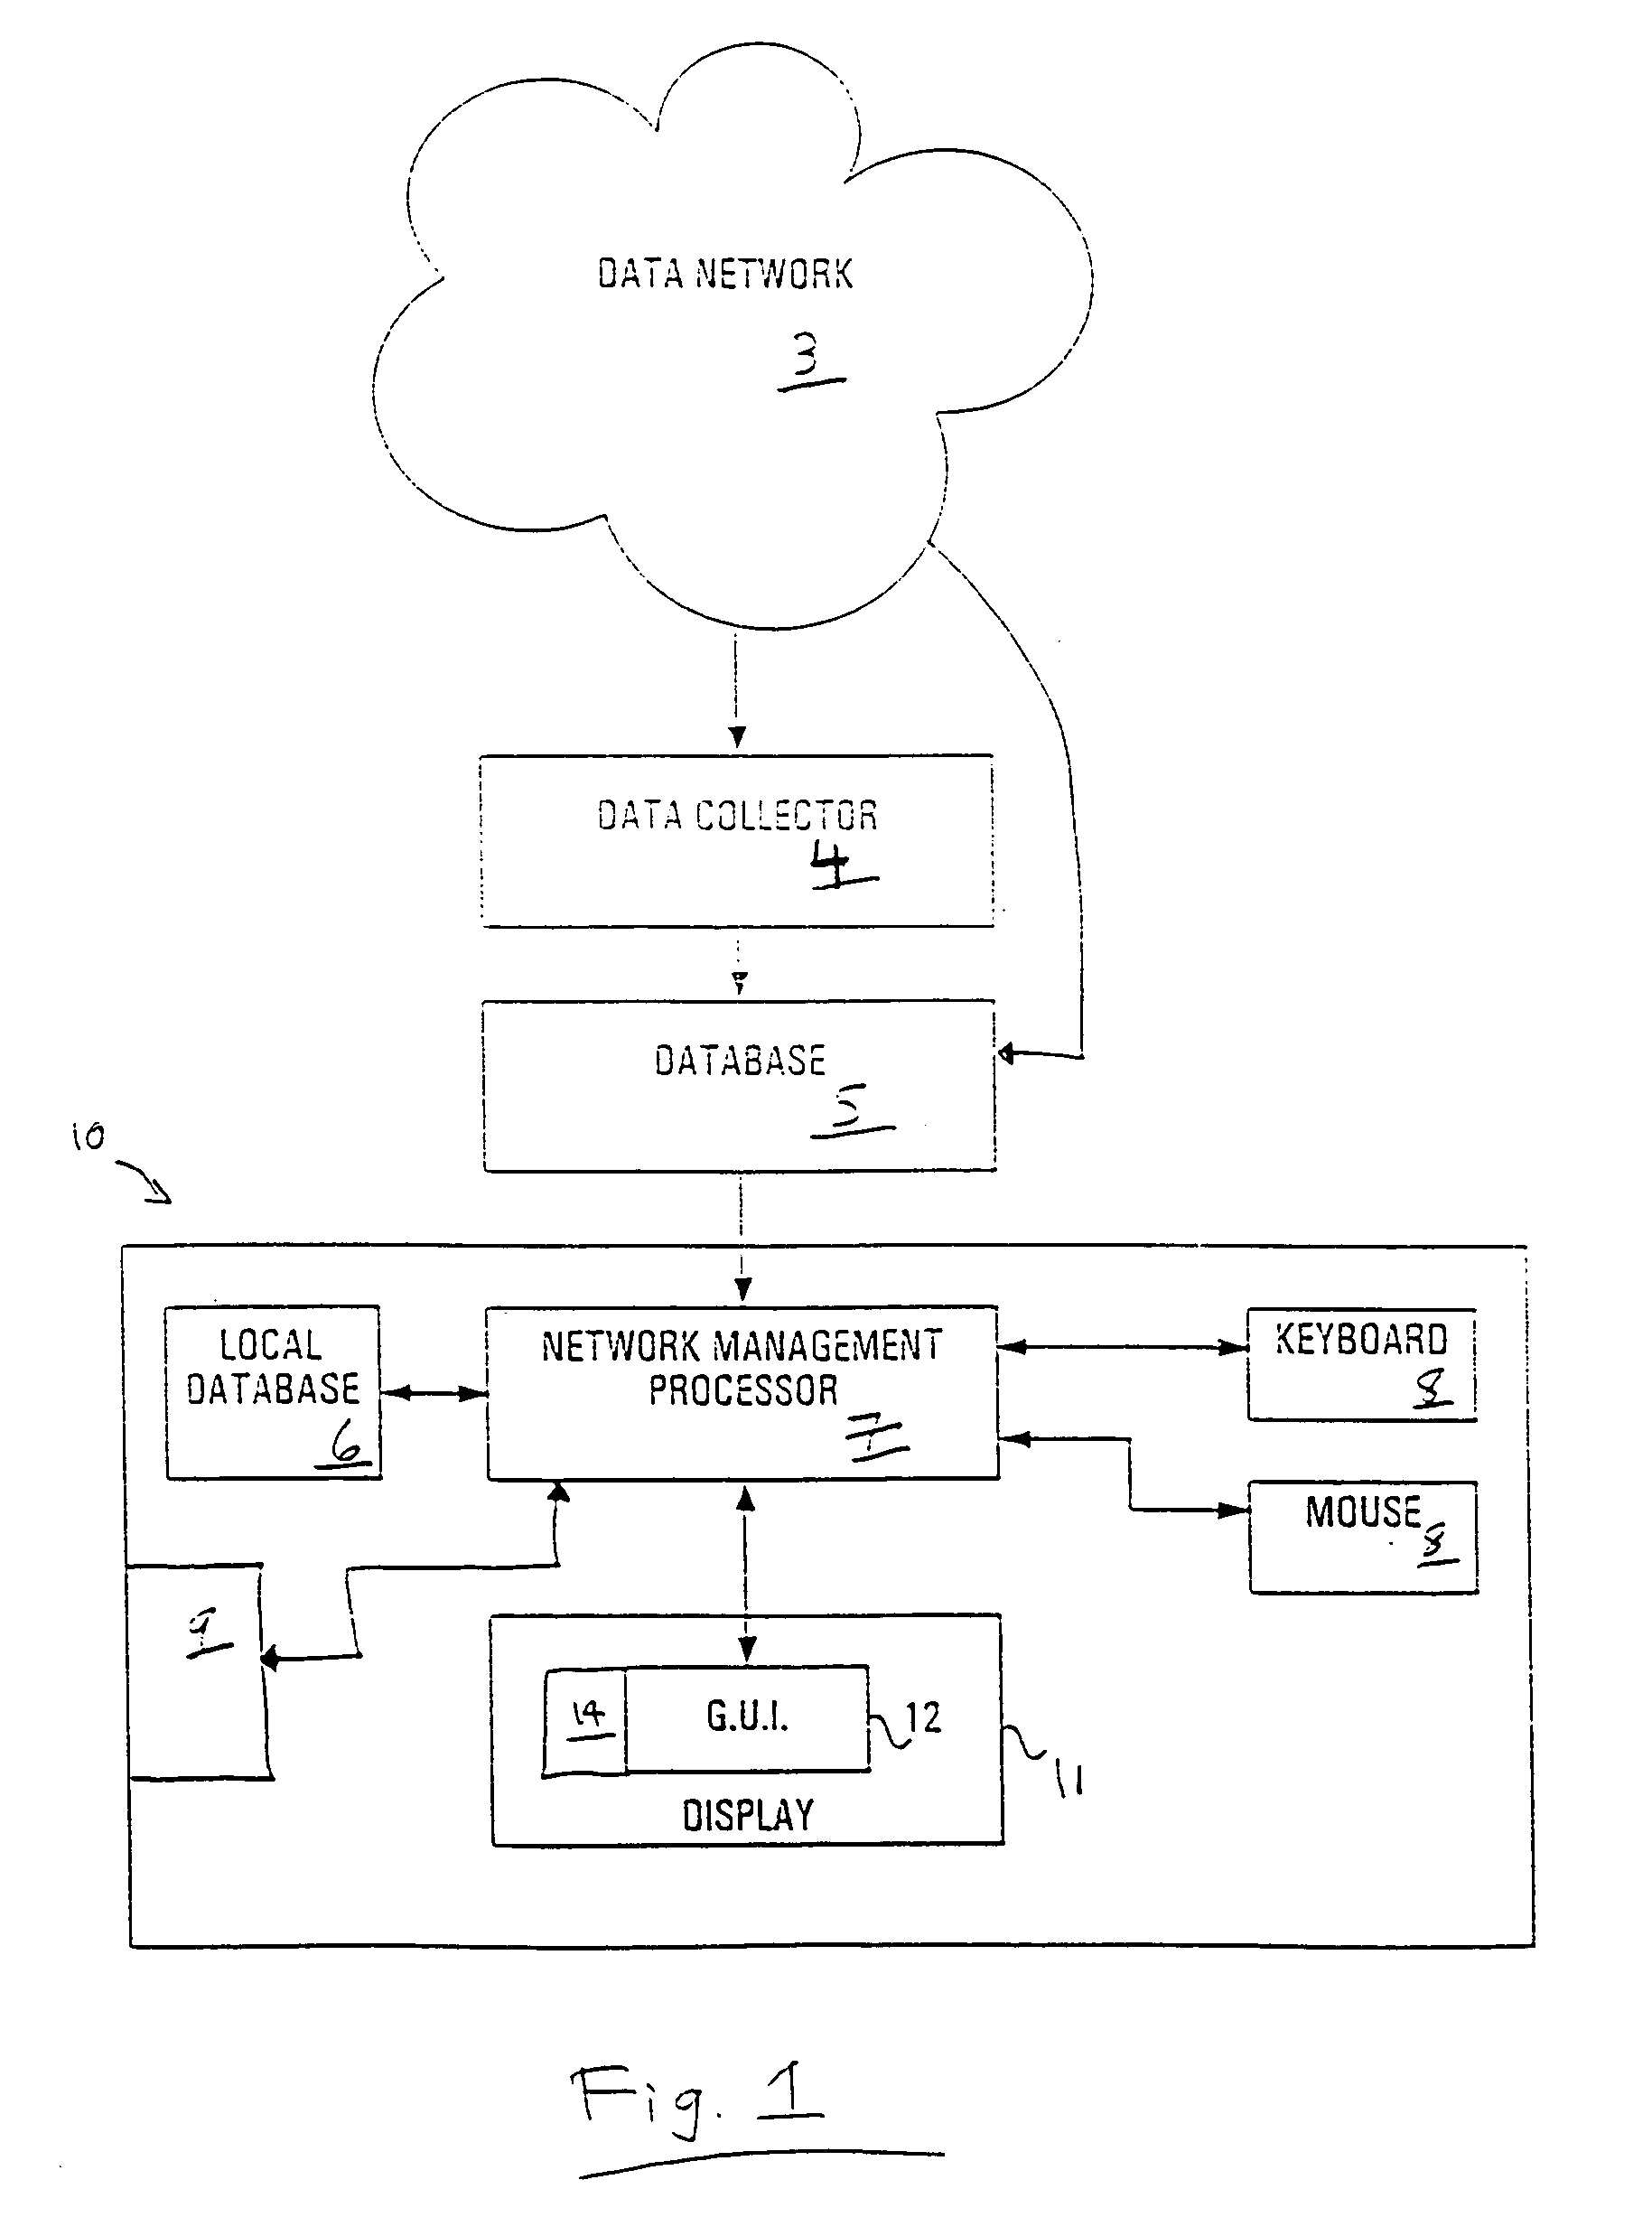
[0025]Referring to FIG. 1, a network configuration tool 10 is coupled in series with a global database 5, a data collector 4, and one or more data networks 3, such as a SONET network. The data network 3 can be a network of interconnected communication devices permitting communication of data from one point in the network 3 to another. Some examples of networks 3 include Synchronous Optical Networks (SONET), Synchronous Digital Hierarchy (SDH), Dense Wave Division Multiplexing (DWDM), a Synchronous Transfer Mode (ATM) Networks, the Internet, Networks of Microwave and Antenna Base Stations, Satellite Networks, and Networks comprising a mixture of these technologies. Regardless of the specific type, the networks 3 comprise a number of network entities or segments that each have a set of defined network features. For example, an ATM Network includes network nodes and interconnections or links that may be used for a particular customer and / or service. In other networks 3, the network ent...


PUM


Abstract

A visualization method for a hub network configuration allows exploration of a chosen network by way of a graphical display interface (GUI), wherein multiple distinct network segments such as lines or rings are shown attached to a common node or centralized hub. The technique combines a graphical view of the segments controlled by a segment selector. The selector is coupled to a series of display indicators and a list of the attached rings contained in the network. The list can contain descriptive elements of the segments, or can provide links to such detail. A mutually exclusive selection of the attached segments is enabled using either the selector or the list of attached segments. For each segment selected, the display indicators can show the currently displayed segments on the GUI, help to highlight on the GUI a selected attached segment and provide an indication of attached segments that are related in function to the selected segment. Selected and remaining segments of the network are displayed in various shadings or colours, which enables a Network Manager or other user of the system and method to easily distinguish and consider these aspects alternatively. In the graphical view, attached segments can be displayed in stacked, overlaid, or isolated formats. The segments can consist of rings, lines, stars, bars, and chains.

Description

BACKGROUND OF THE INVENTION[0001]Global networks are common to all of today's communication systems, wherein various electronic, optical, and wireless devices can be interconnected by a series of individual local networks to facilitate the transmission of data traffic. This traffic can include voice, video, data, and other information over a variety of transmission mediums, such as wireless, copper, and fibre optic lines. Hub network configurations are being used in network components such as optical cross connects, IP hubs and large routers, and in terabit and gigabit routers. Today's optical cross-connect network elements (such as the Nortel Networks DX or HDX) can support numerous topologies, including network segments such as rings, stars, chains, bus, and associated nodes and links. For example, the DX allows connections of up to 40 rings attached to a single optical node. As new technology is developed the complexity of network configurations is expected to increase, where the...

Claims


Application Information

Patent Timeline
IPC IPC(8): G06F15/177G06F15/16H04L12/24
CPCH04L41/22H04L41/0803
Inventor BEAUDOIN, LUCMOXON, BLAIRROCHFORD, SUZANNE L
Owner CIENA
Why Eureka
Try Eureka