

Methods for improving sensitivity of oxygen biosensors
a biosensor and oxygen technology, applied in the field of cell biology, can solve the problems of inability to accurately identify a positive sample as being negative, prolonged pharmacological effects or increased risk of drug toxicity, and inability to detect a positive sample in tim
- Summary
- Abstract
- Description
- Claims
- Application Information
AI Technical Summary
Problems solved by technology
Method used
Image

Examples
example 1
[0072]This example illustrates how the microsomes containing P450 enzymes and the drug, diclofenac were prepared.
[0073]The cytochromes (“CYP”) P450 are a large family of proteins found predominantly in the liver, involved in the metabolism or detoxification of substances in the body such as chemicals, hormones or natural food substances. While there are many different sub-families of CYP450, the isozyme families primarily involved in the metabolism of xenobiotics are the CYPs 3A, 2C, 2D and 1A.
[0074]Microsomes prepared from human lymphoblasts transfected with human CYP-2C9 were purchased from Gentest. Reaction buffer was prepared according to Gentest (100 mM Tris) to which was added 3.3 mM MgCl2 and a regenerating system: 1 mM NADP+, 3.3 mM Glucose-6-phosphate and 0.4 units / ml glucose-6-phosphate dehydrogenase (Sigma, St. Louis, Mo.). Reaction buffer (195 microliters / well) was plated onto a 96 well BD oxygen sensor plate (Becton Dickinson, Beford, Mass.) and equilibrated to 37° for ...
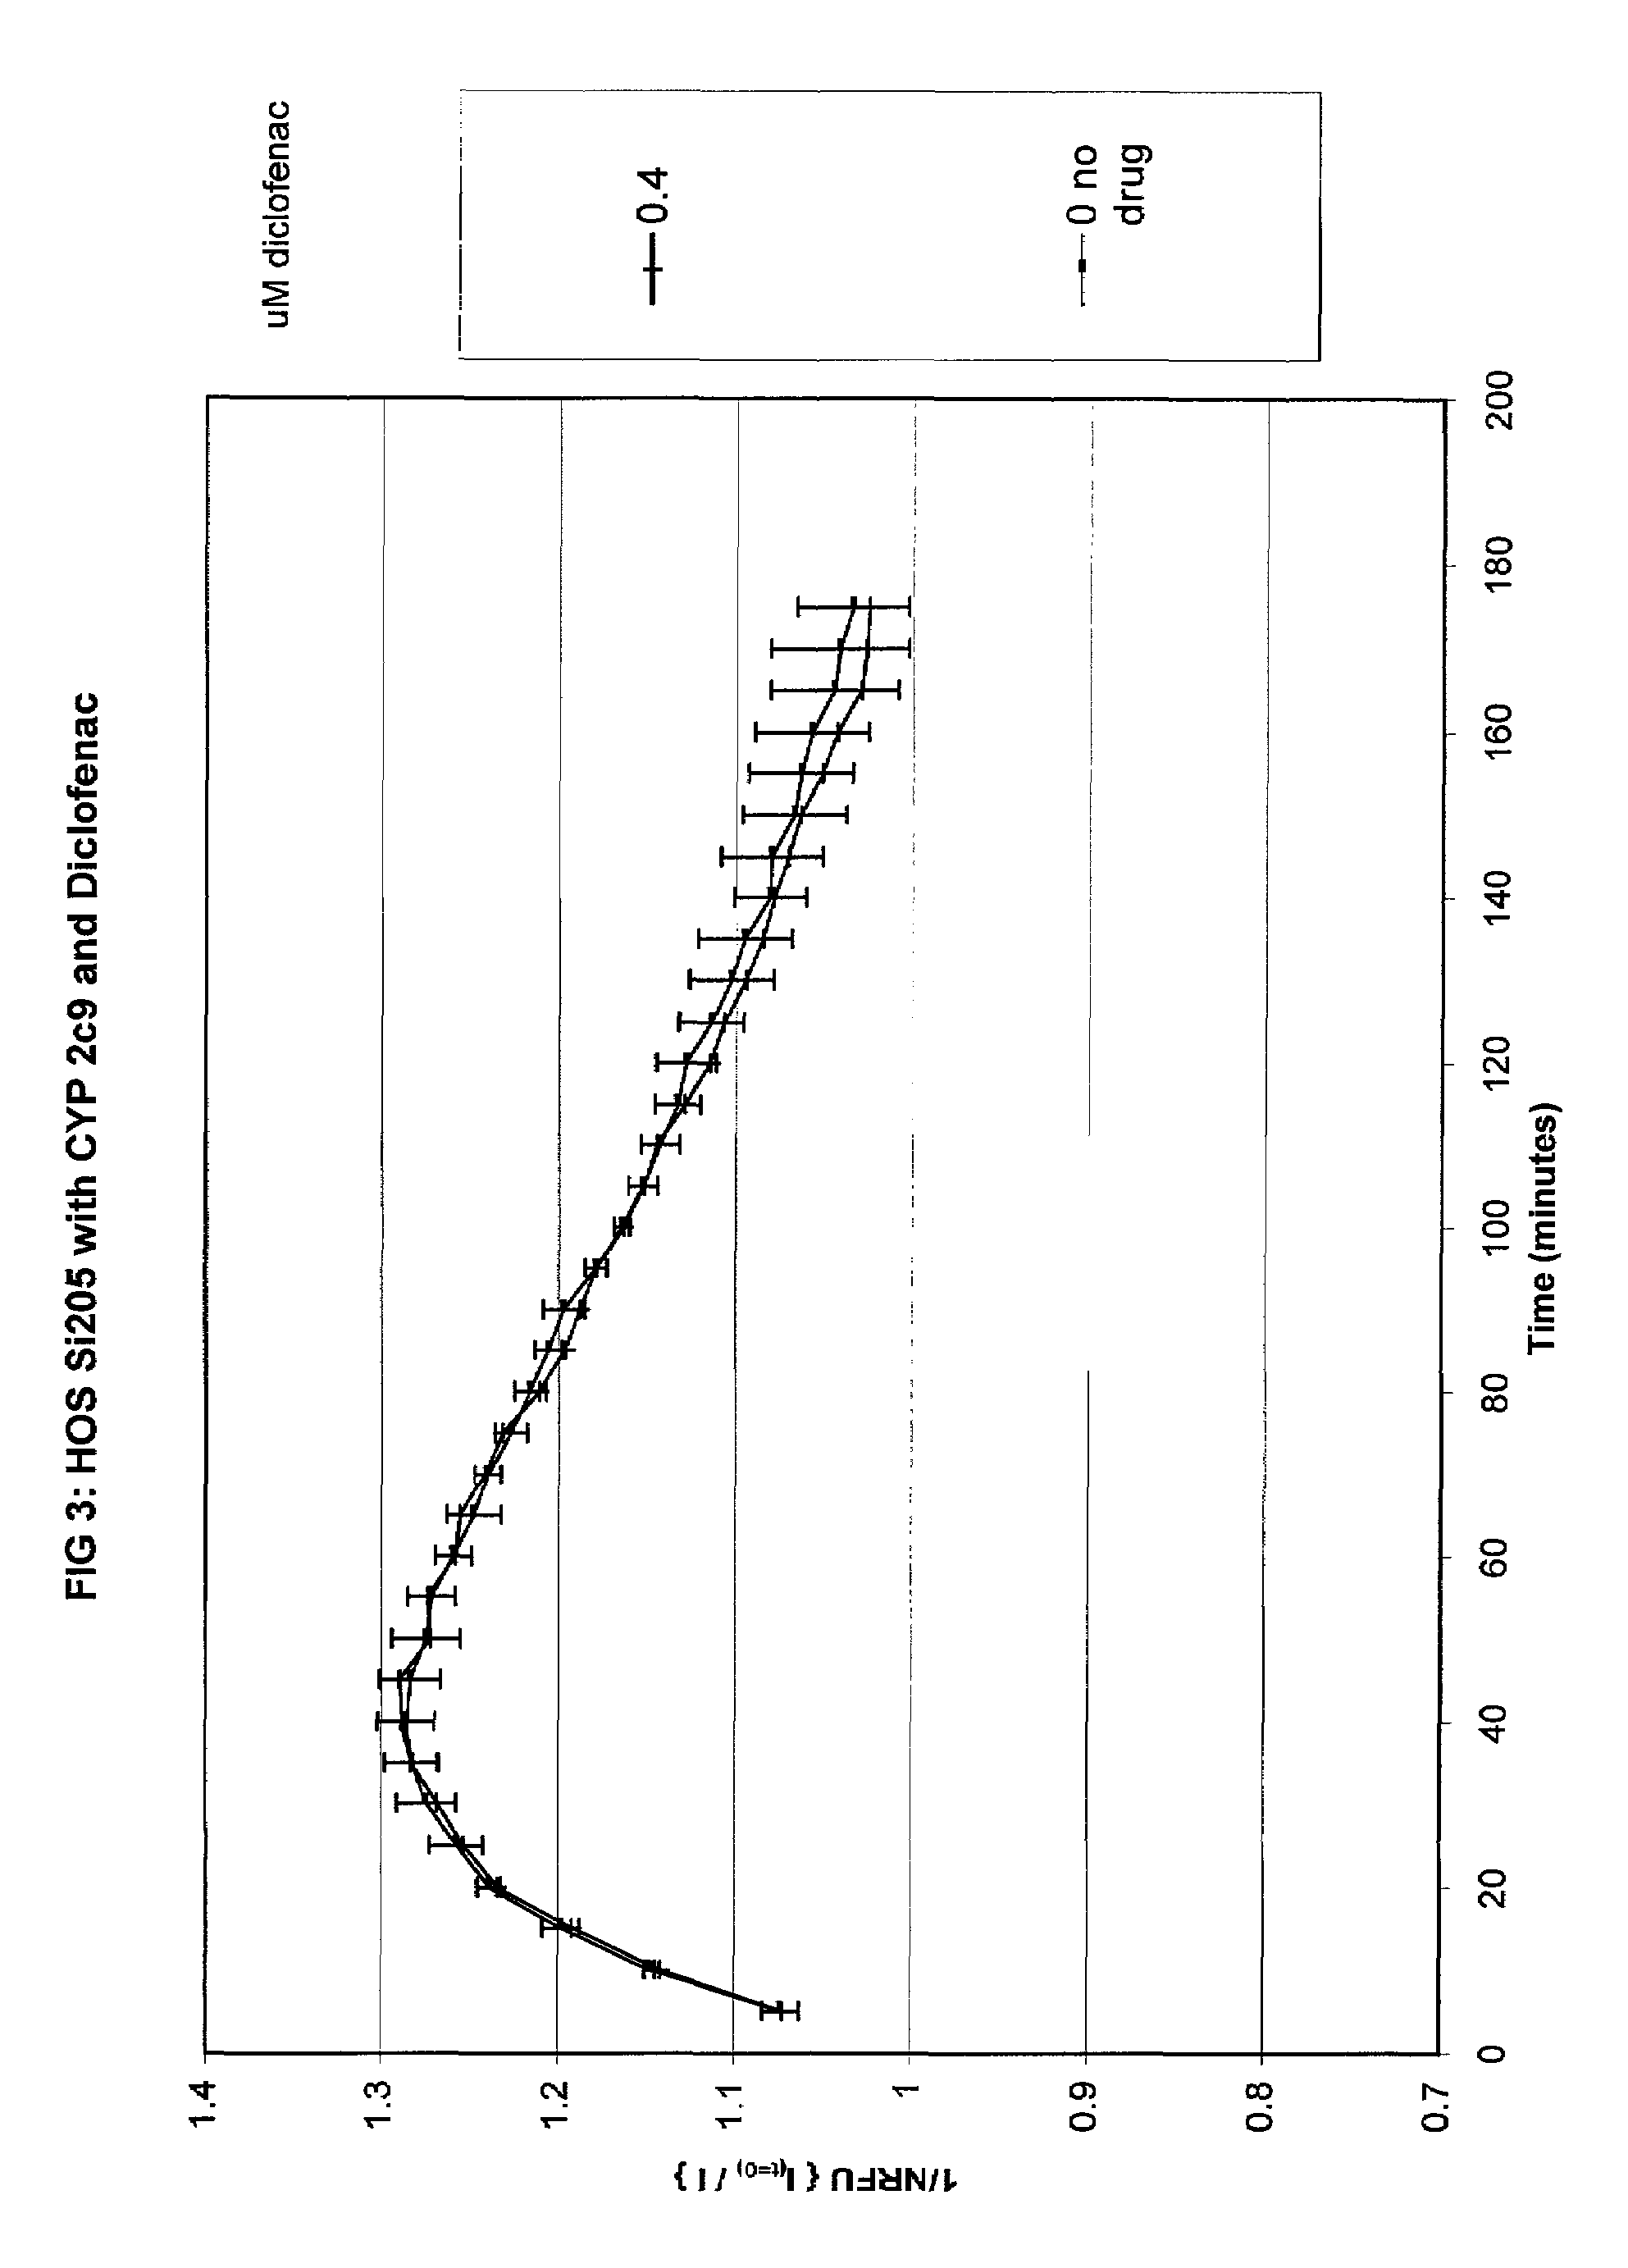
example 2
[0076]This example depicts the results from the BD oxygen biosensor plate (BD Biosciences, Bedford, Mass.) when diclofenac was added at different concentrations to microsomes expressing CYP450 enzymes.
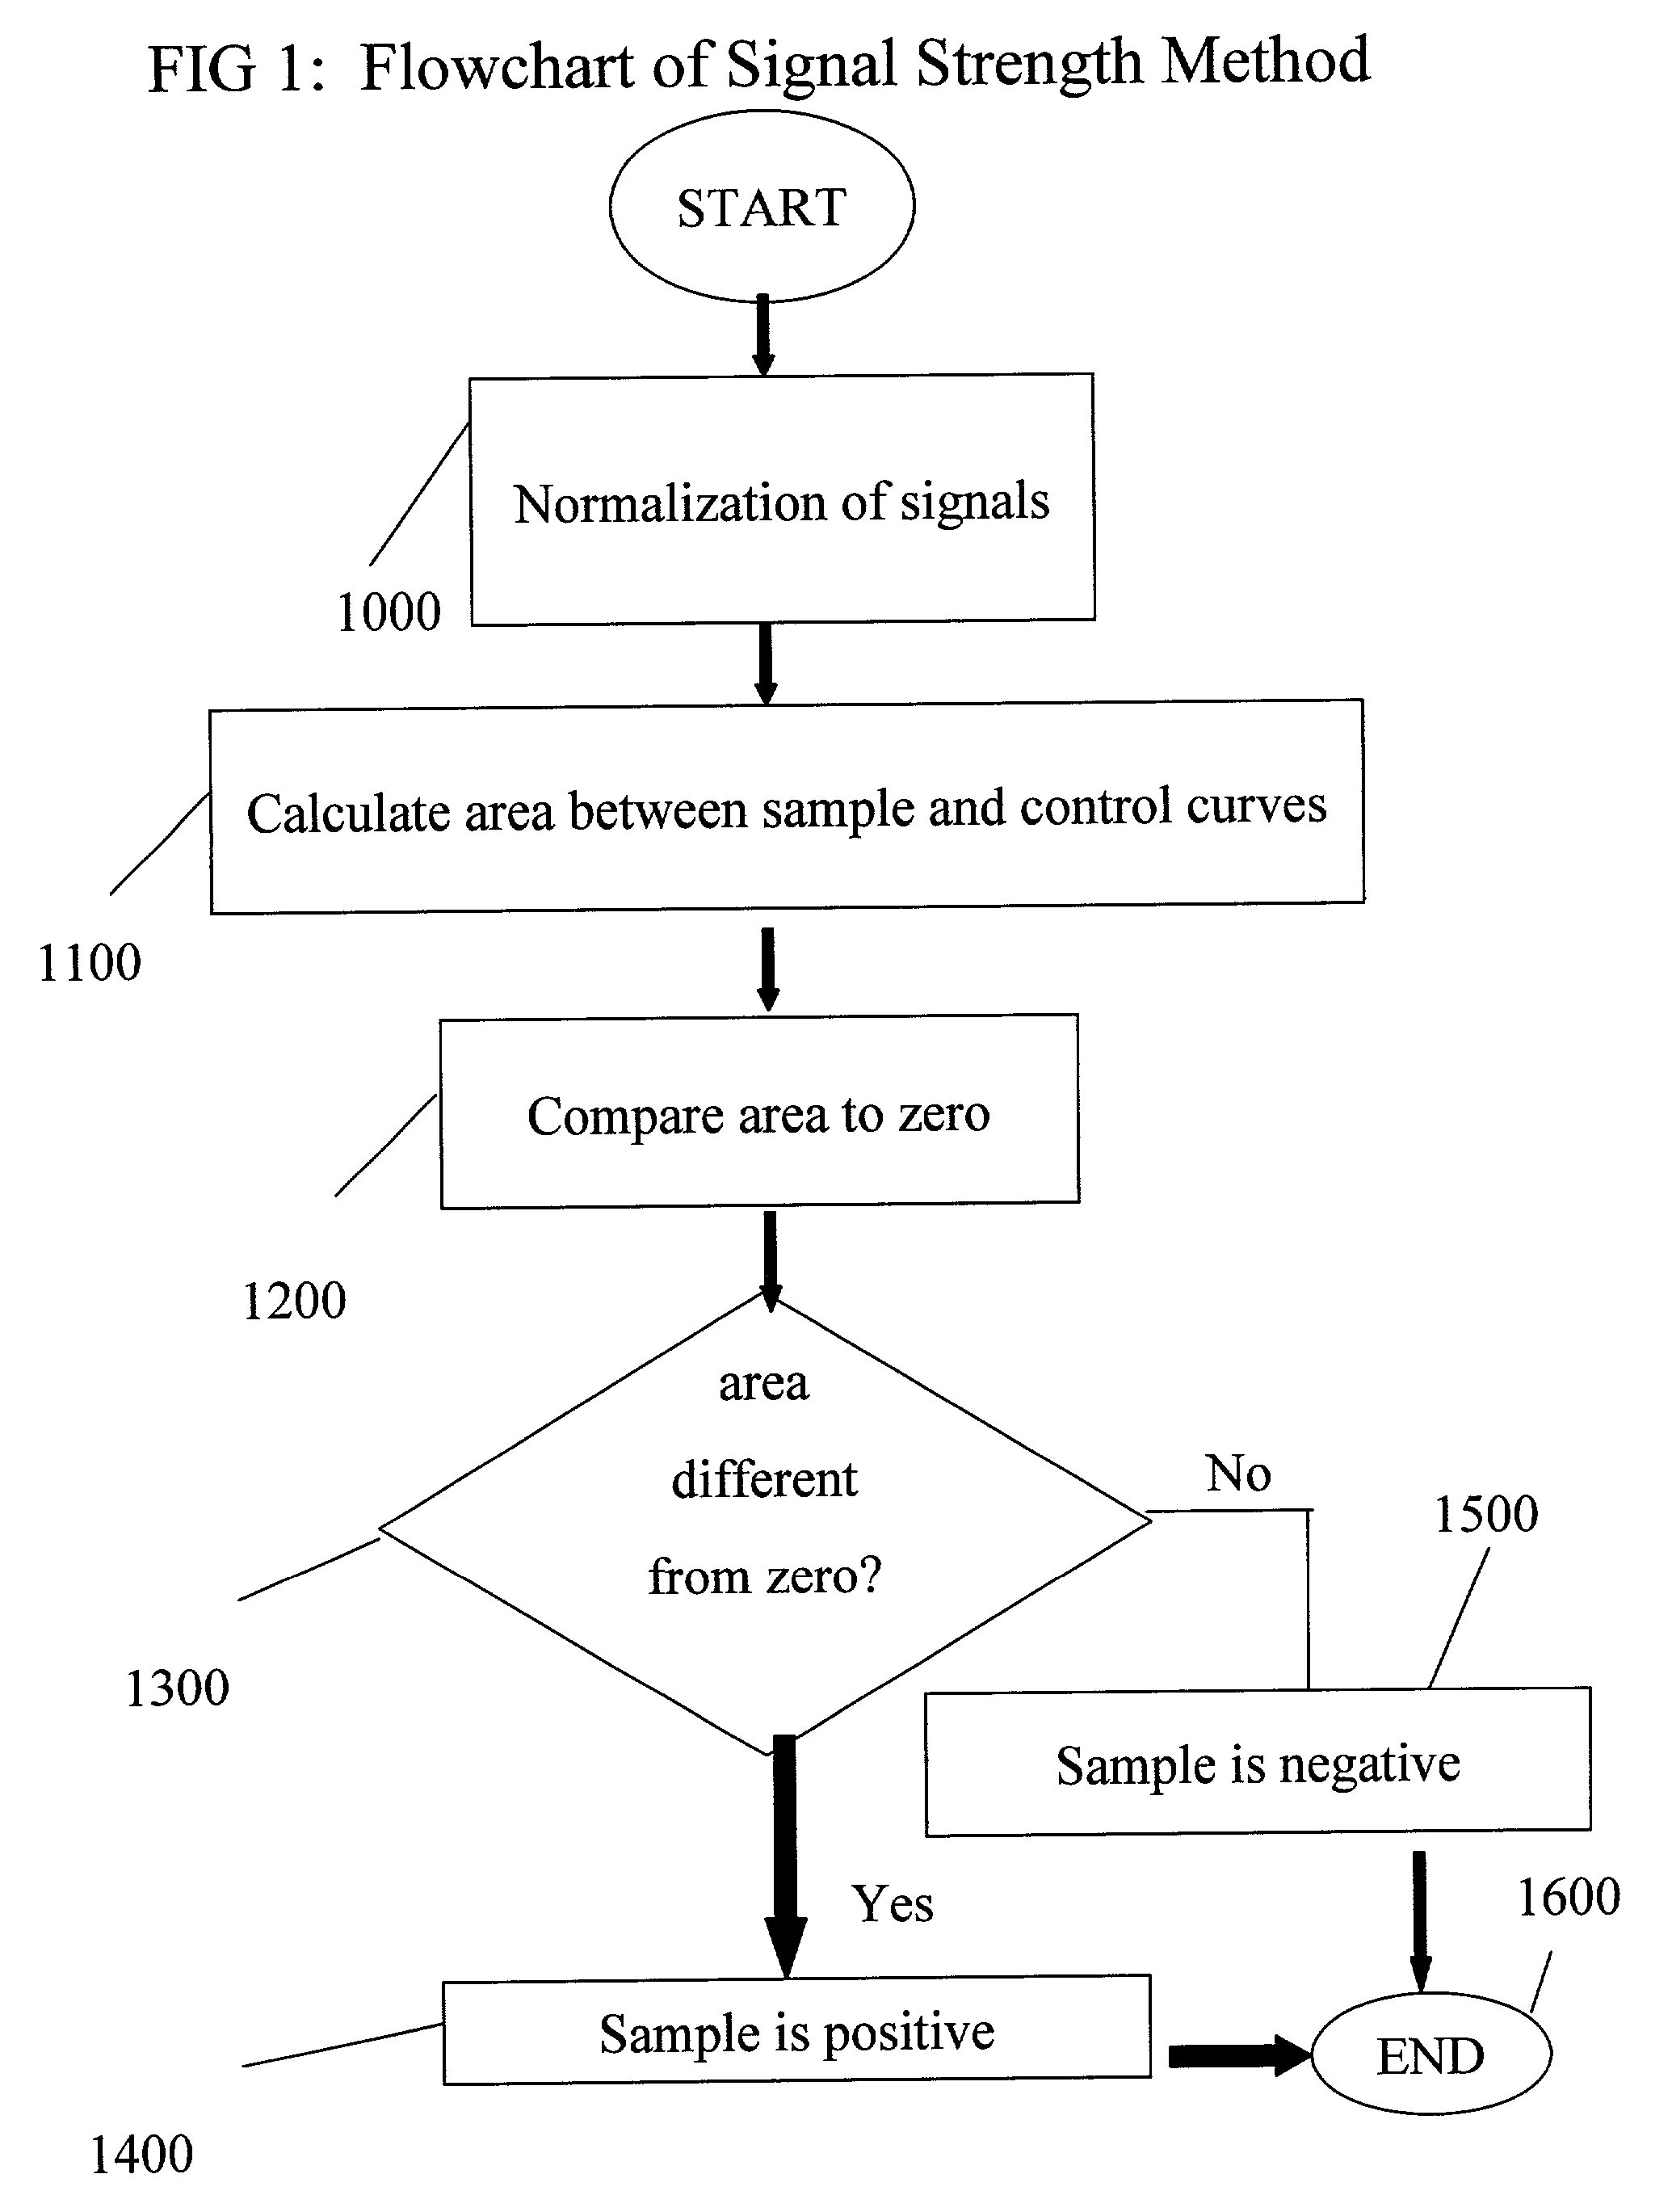
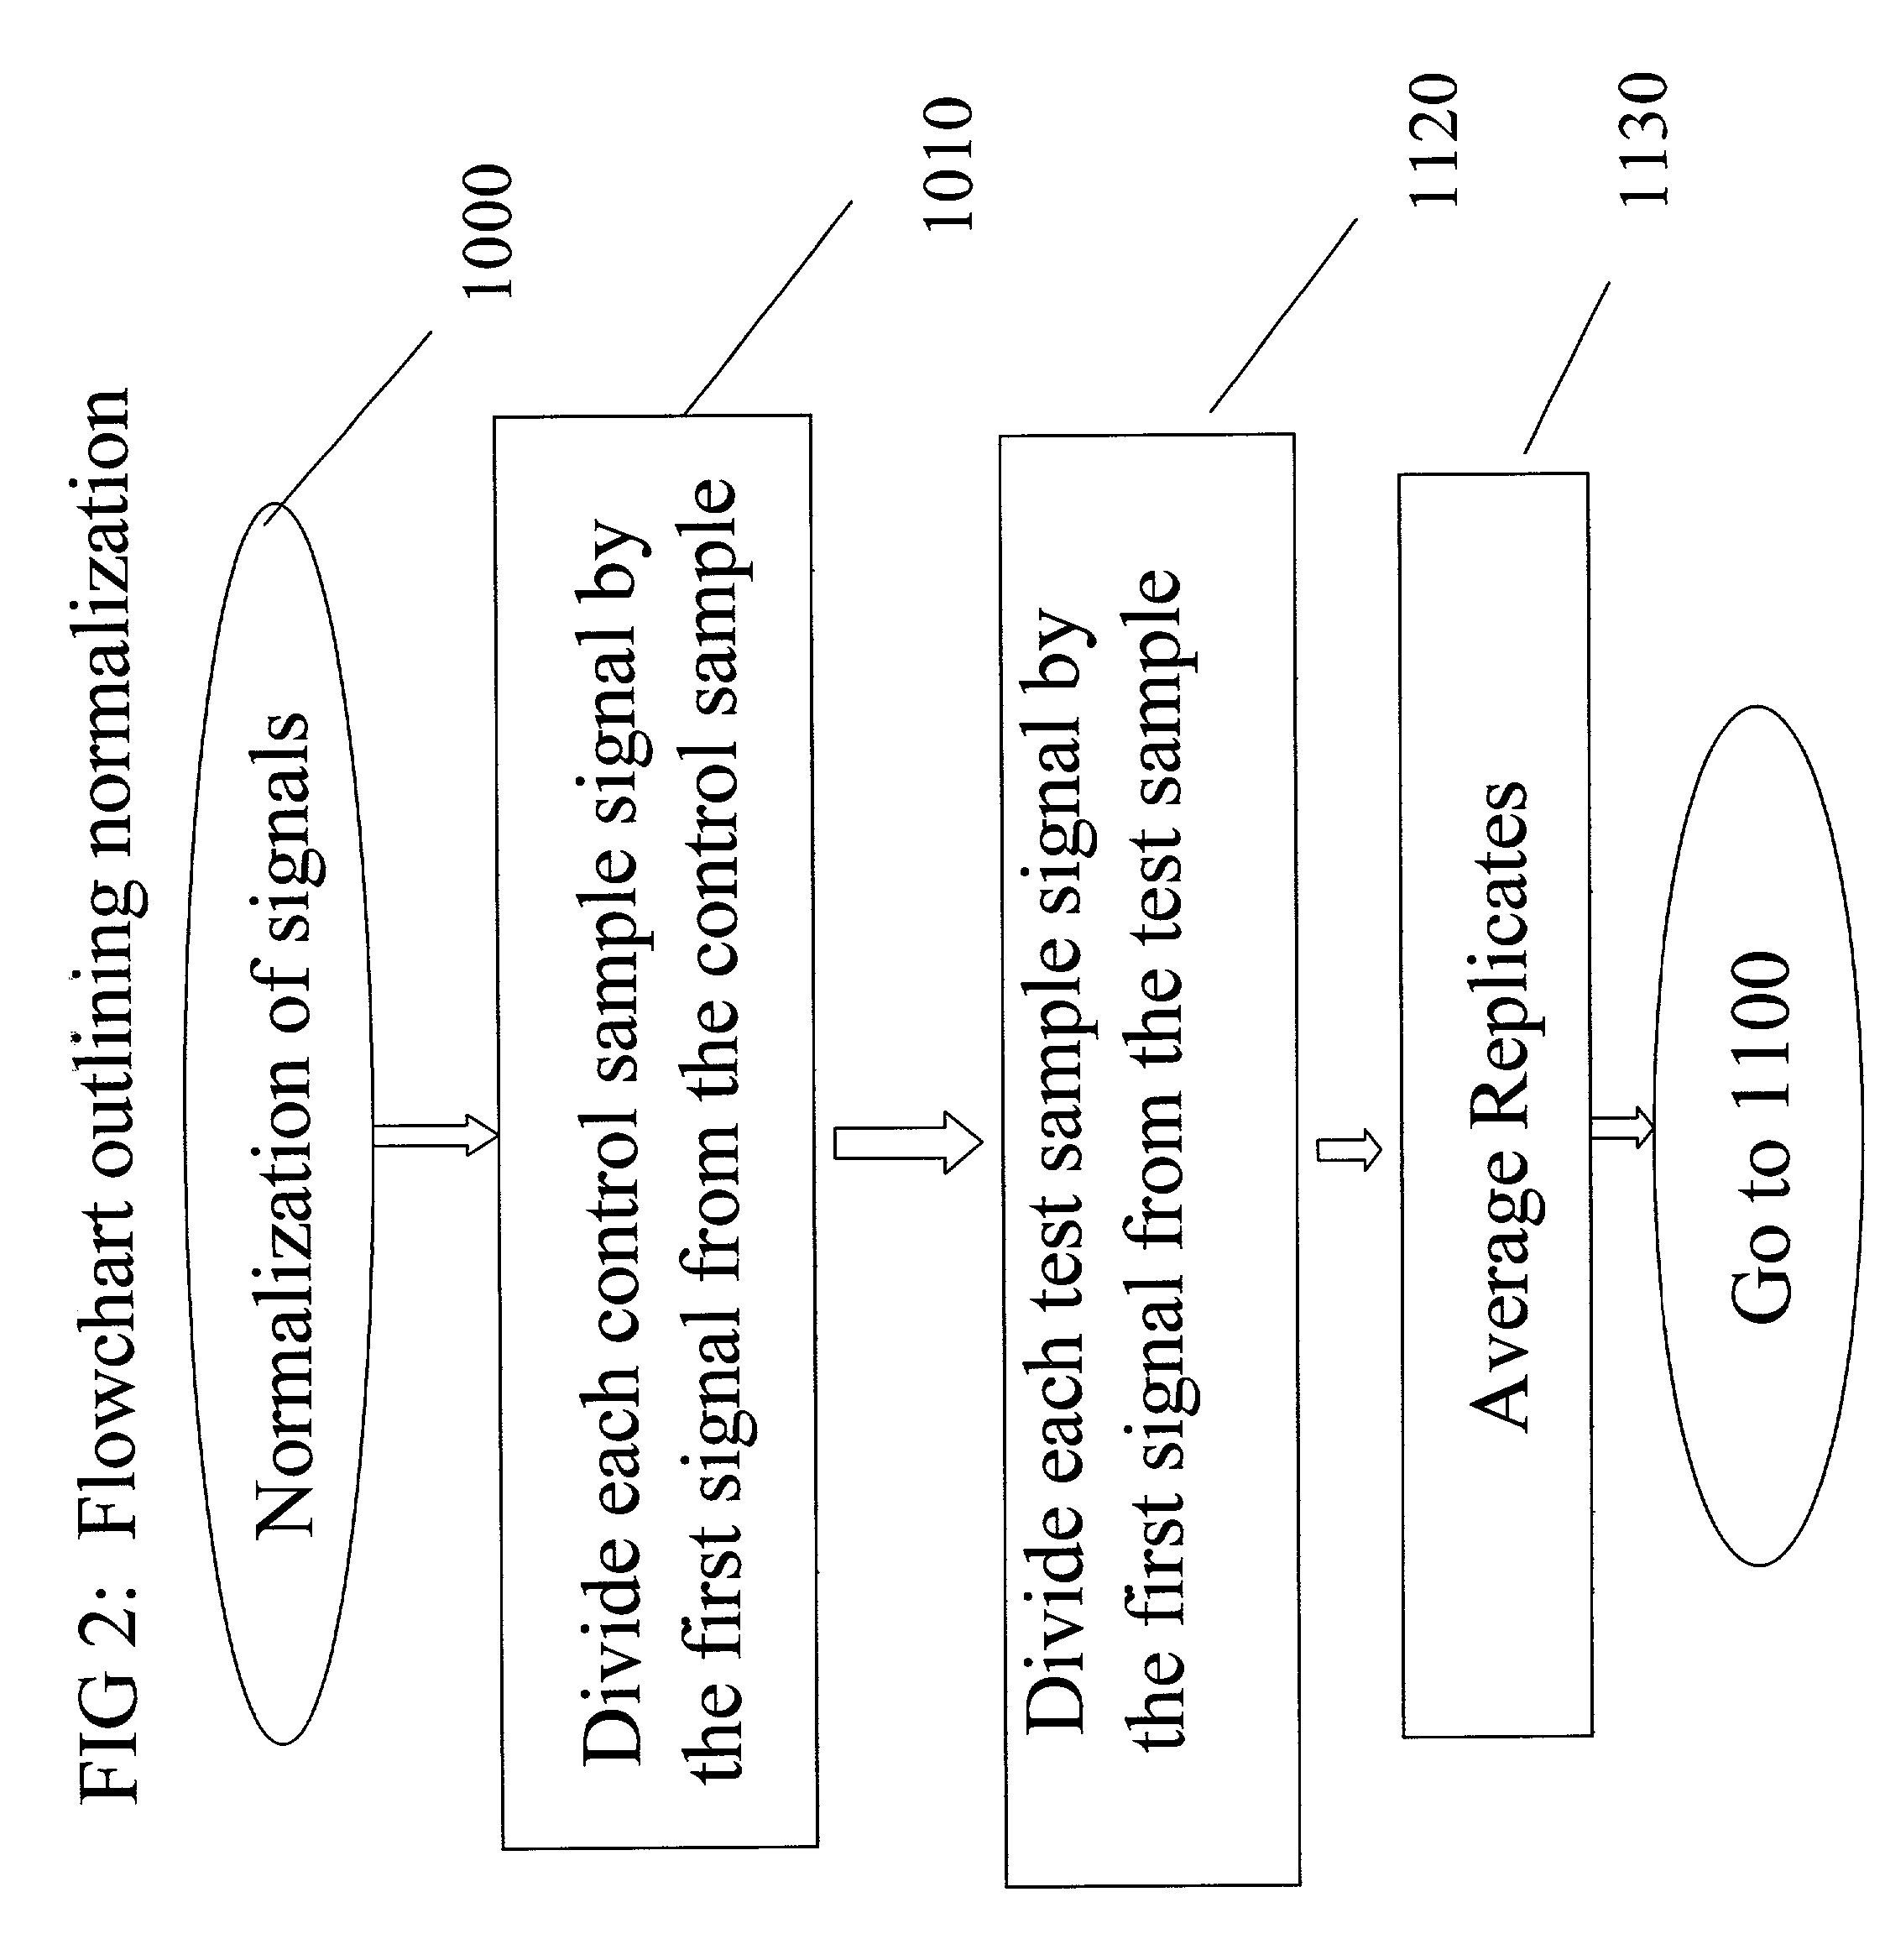
[0077]All samples prepared as described in Example 1 were monitored for oxygen consumption using a BD oxygen biosensor plate. All data were obtained with a BMG Polarstar fluorimeter at 37° C. using the bottom plate reading configuration. The bandpass filters were 465 nm for excitation and 590 nm for emission. Data were obtained at the start of the experiment and then every five minutes for each concentration of drug, the control sample which did not contain drug and the sample which contained neither microsomes or drug. Three replicates for each condition at each reading were taken. Data were read at time intervals for a total time of 175 minutes. Data were normalized by dividing the first reading for each well by the subsequent readings. The reciprocal of these reading were used for s...
example 3
[0079]This example depicts the cumulative difference from the control sample which does not contain any diclofenic for each test sample containing different concentrations of diclofenic.
[0080]Each sample and control reading was analyzed as described above for test and control samples. The sum of the differences between sample and control signals from each time interval are plotted in FIG. 7. As is evident from FIG. 7, the method of the invention improves the ability to differentiate between test sample and control sample signals by accumulating the differences between the test and control sample signals while decreasing the error associated with those accumulated signals. Referring to FIG. 7, the integrated signals from 0.04 μM through 12 μM diclofenic differ from the integrated control signal by amounts larger than the error, even though individual measurements did not. The error is calculated as the cumulative residual sum of squares error (RSS) from the control sample: Sqrt{sum e...
PUM
| Property | Measurement | Unit |
|---|---|---|
| strength | aaaaa | aaaaa |
| strengths | aaaaa | aaaaa |
| area | aaaaa | aaaaa |
Abstract
Description
Claims
Application Information