
Network visualization tool utilizing iterative rearrangement of nodes on a grid lattice using gradient method

a network visualization and grid lattice technology, applied in the field of data visualization, can solve problems such as inability to display data attributes, limitations of visualization to tree-like formats, and lack of existing visual presentation systems that provide developers or operators with easy identification of glitches or bottlenecks, etc., to facilitate the visual exploration of hierarchical patterns

Inactive Publication Date: 2006-04-04
IBM CORP
View PDF13 Cites 36 Cited by
  • Summary
  • Abstract
  • Description
  • Claims
  • Application Information

AI Technical Summary

Benefits of technology

[0024]Still another object of the present scheme is to provide a system and method for making abstract relationships or associations between network elements more concrete and accessible.
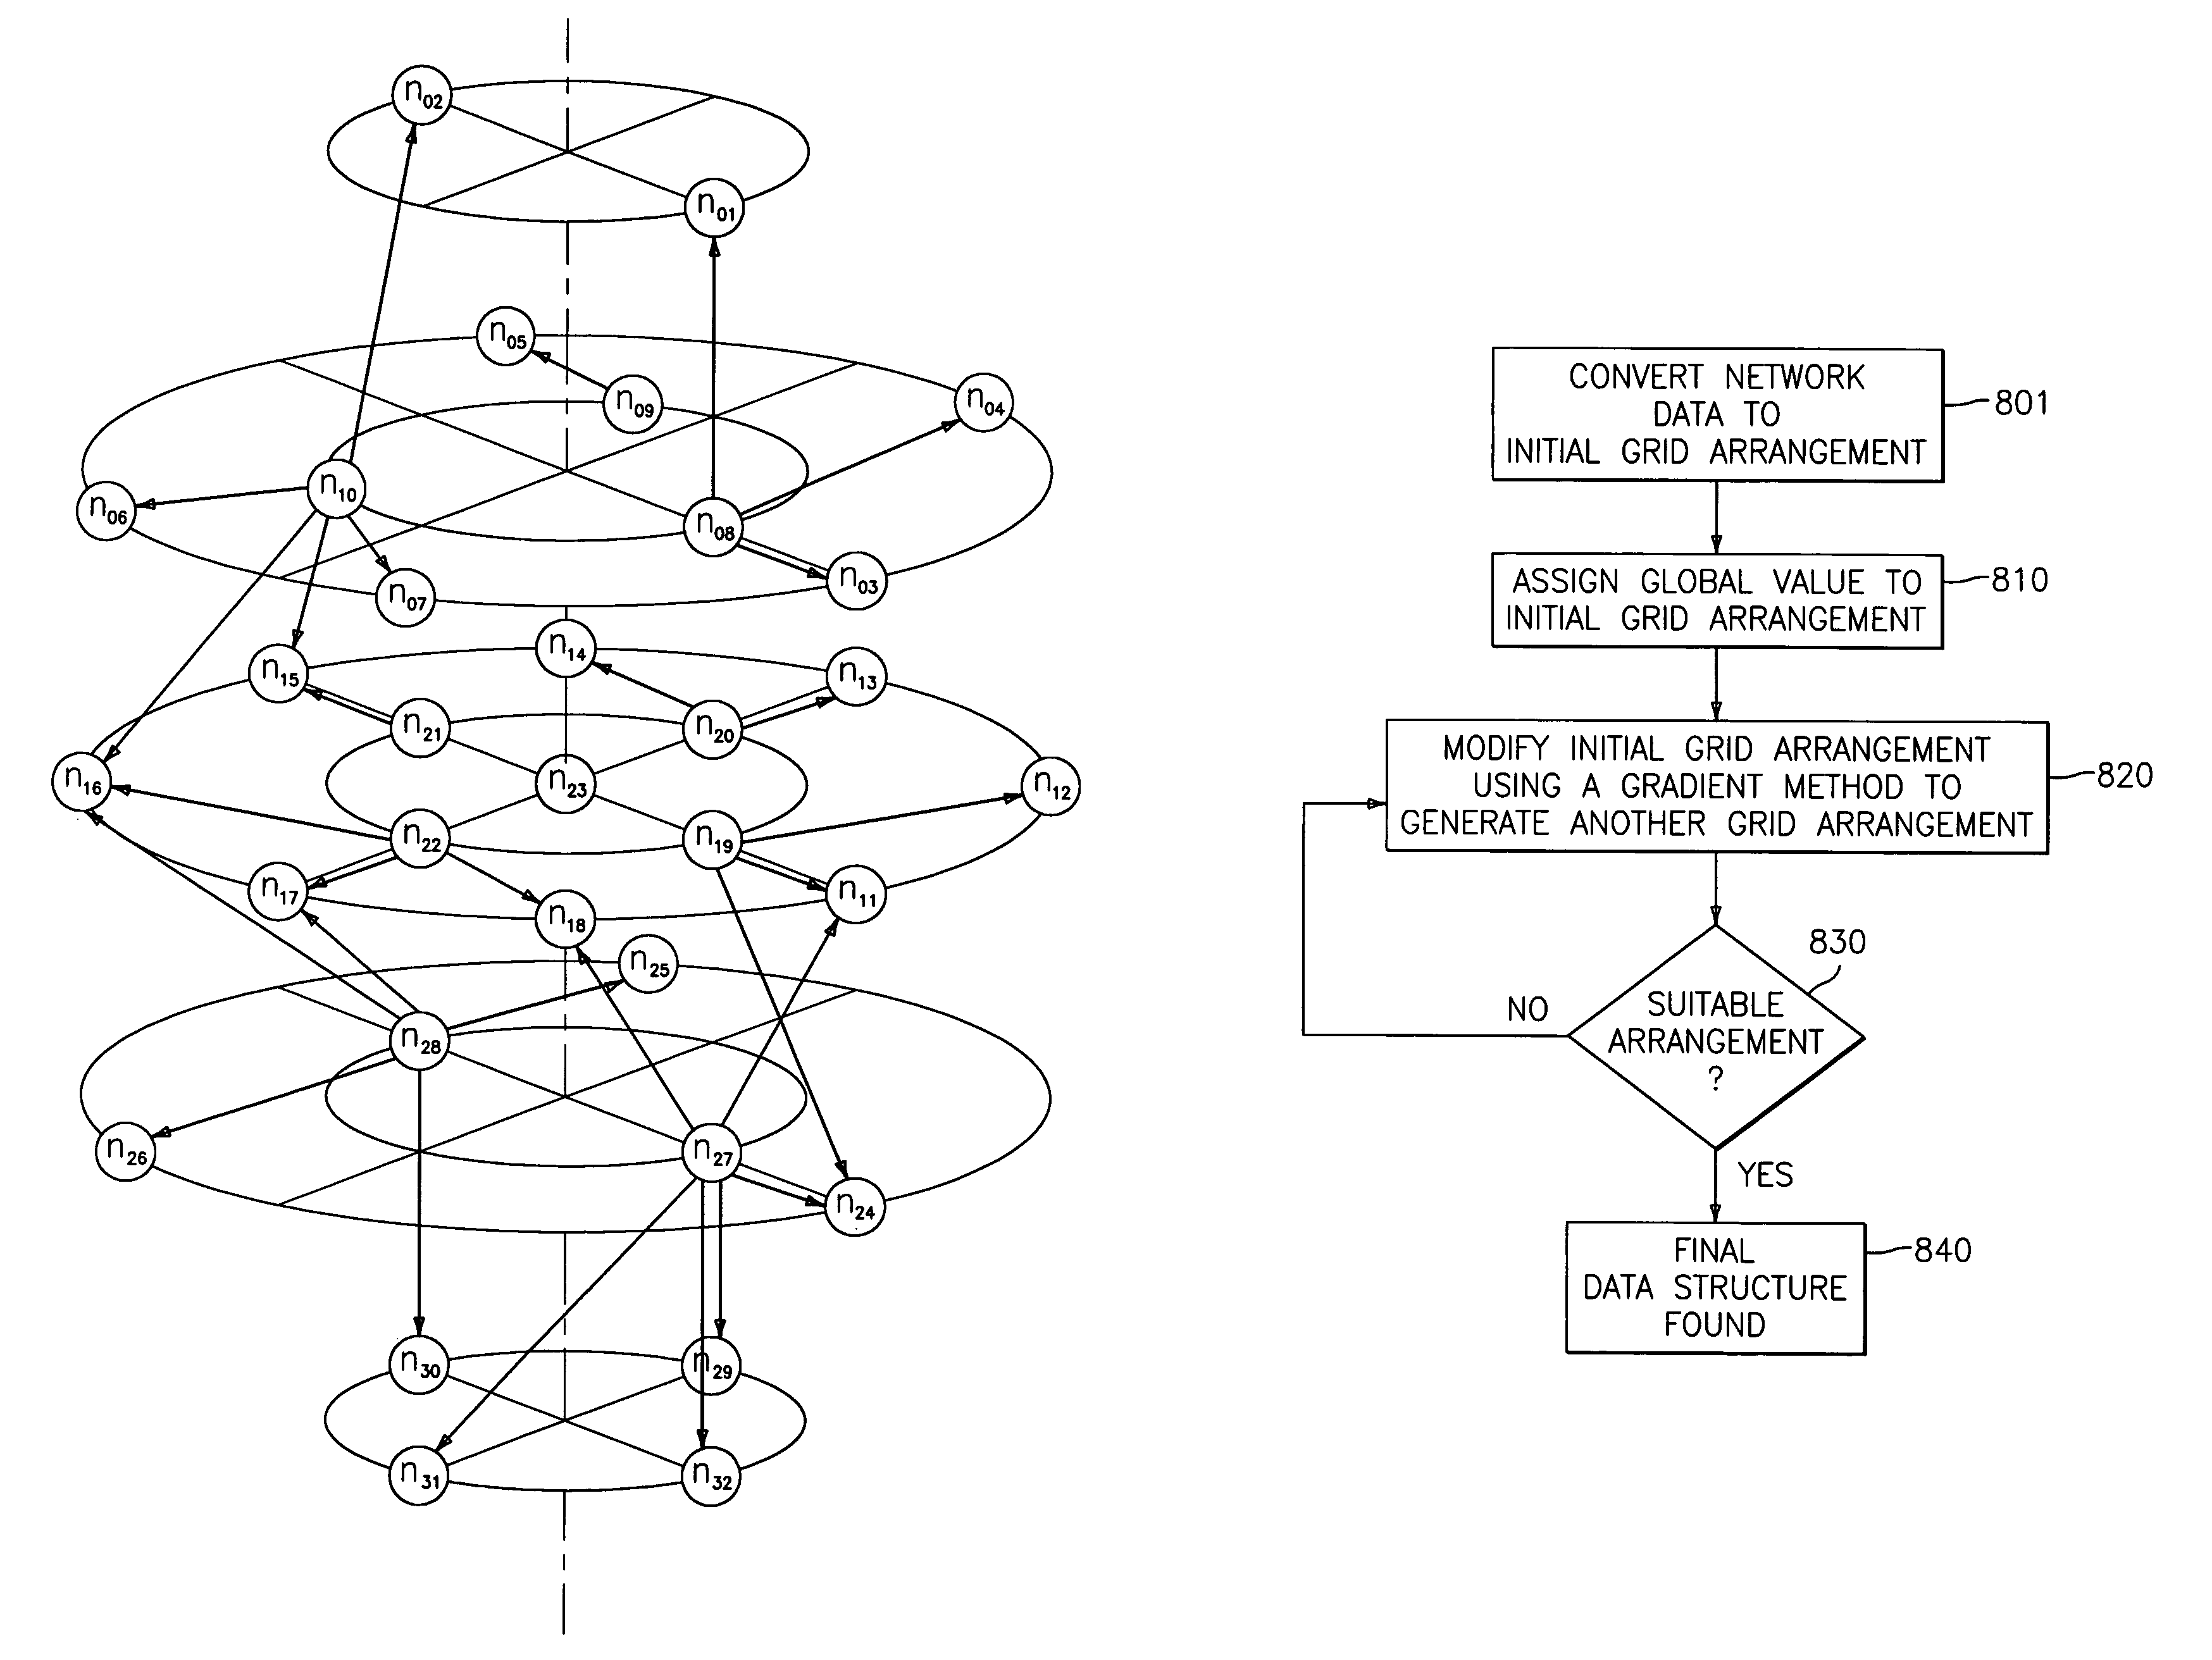
[0026]In another aspect, the present invention provides a method and corresponding system for facilitating the visual exploration of hierarchical and non-hierarchical networks. The method and corresponding system provides an easily comprehensible view of the whole network or a part thereof and allows interactive editing of the network, and / or its elements, and / or its links.
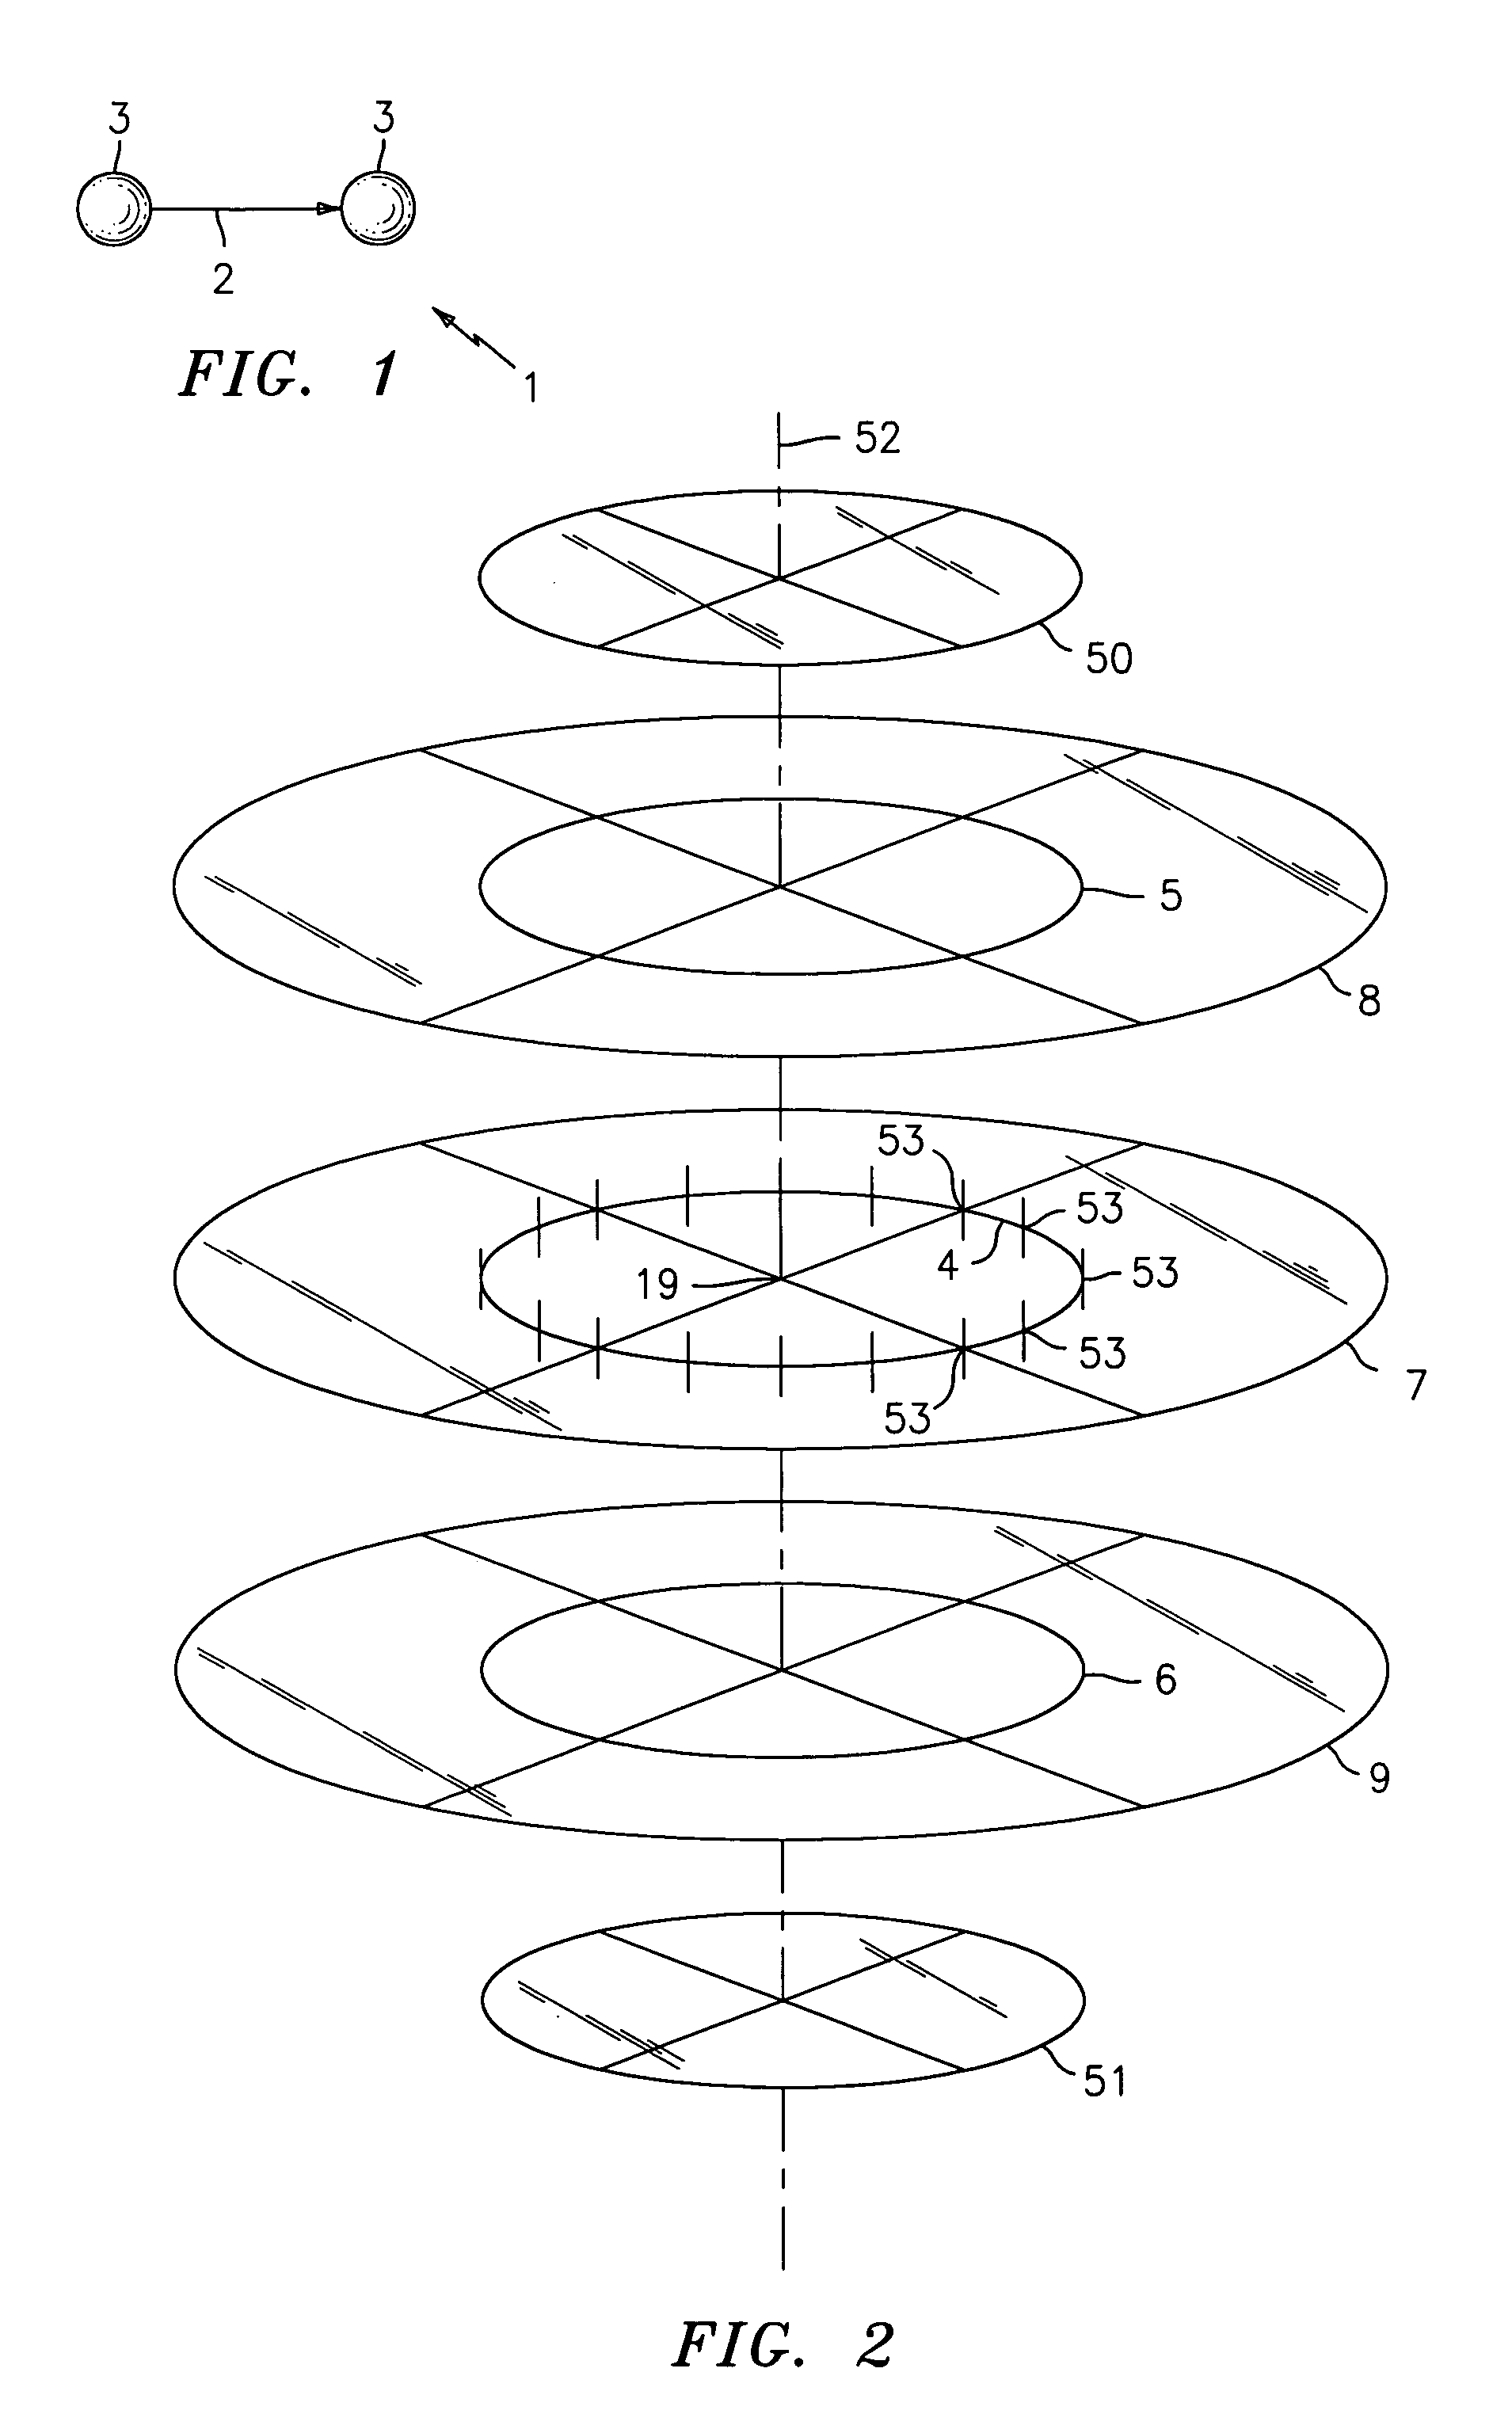
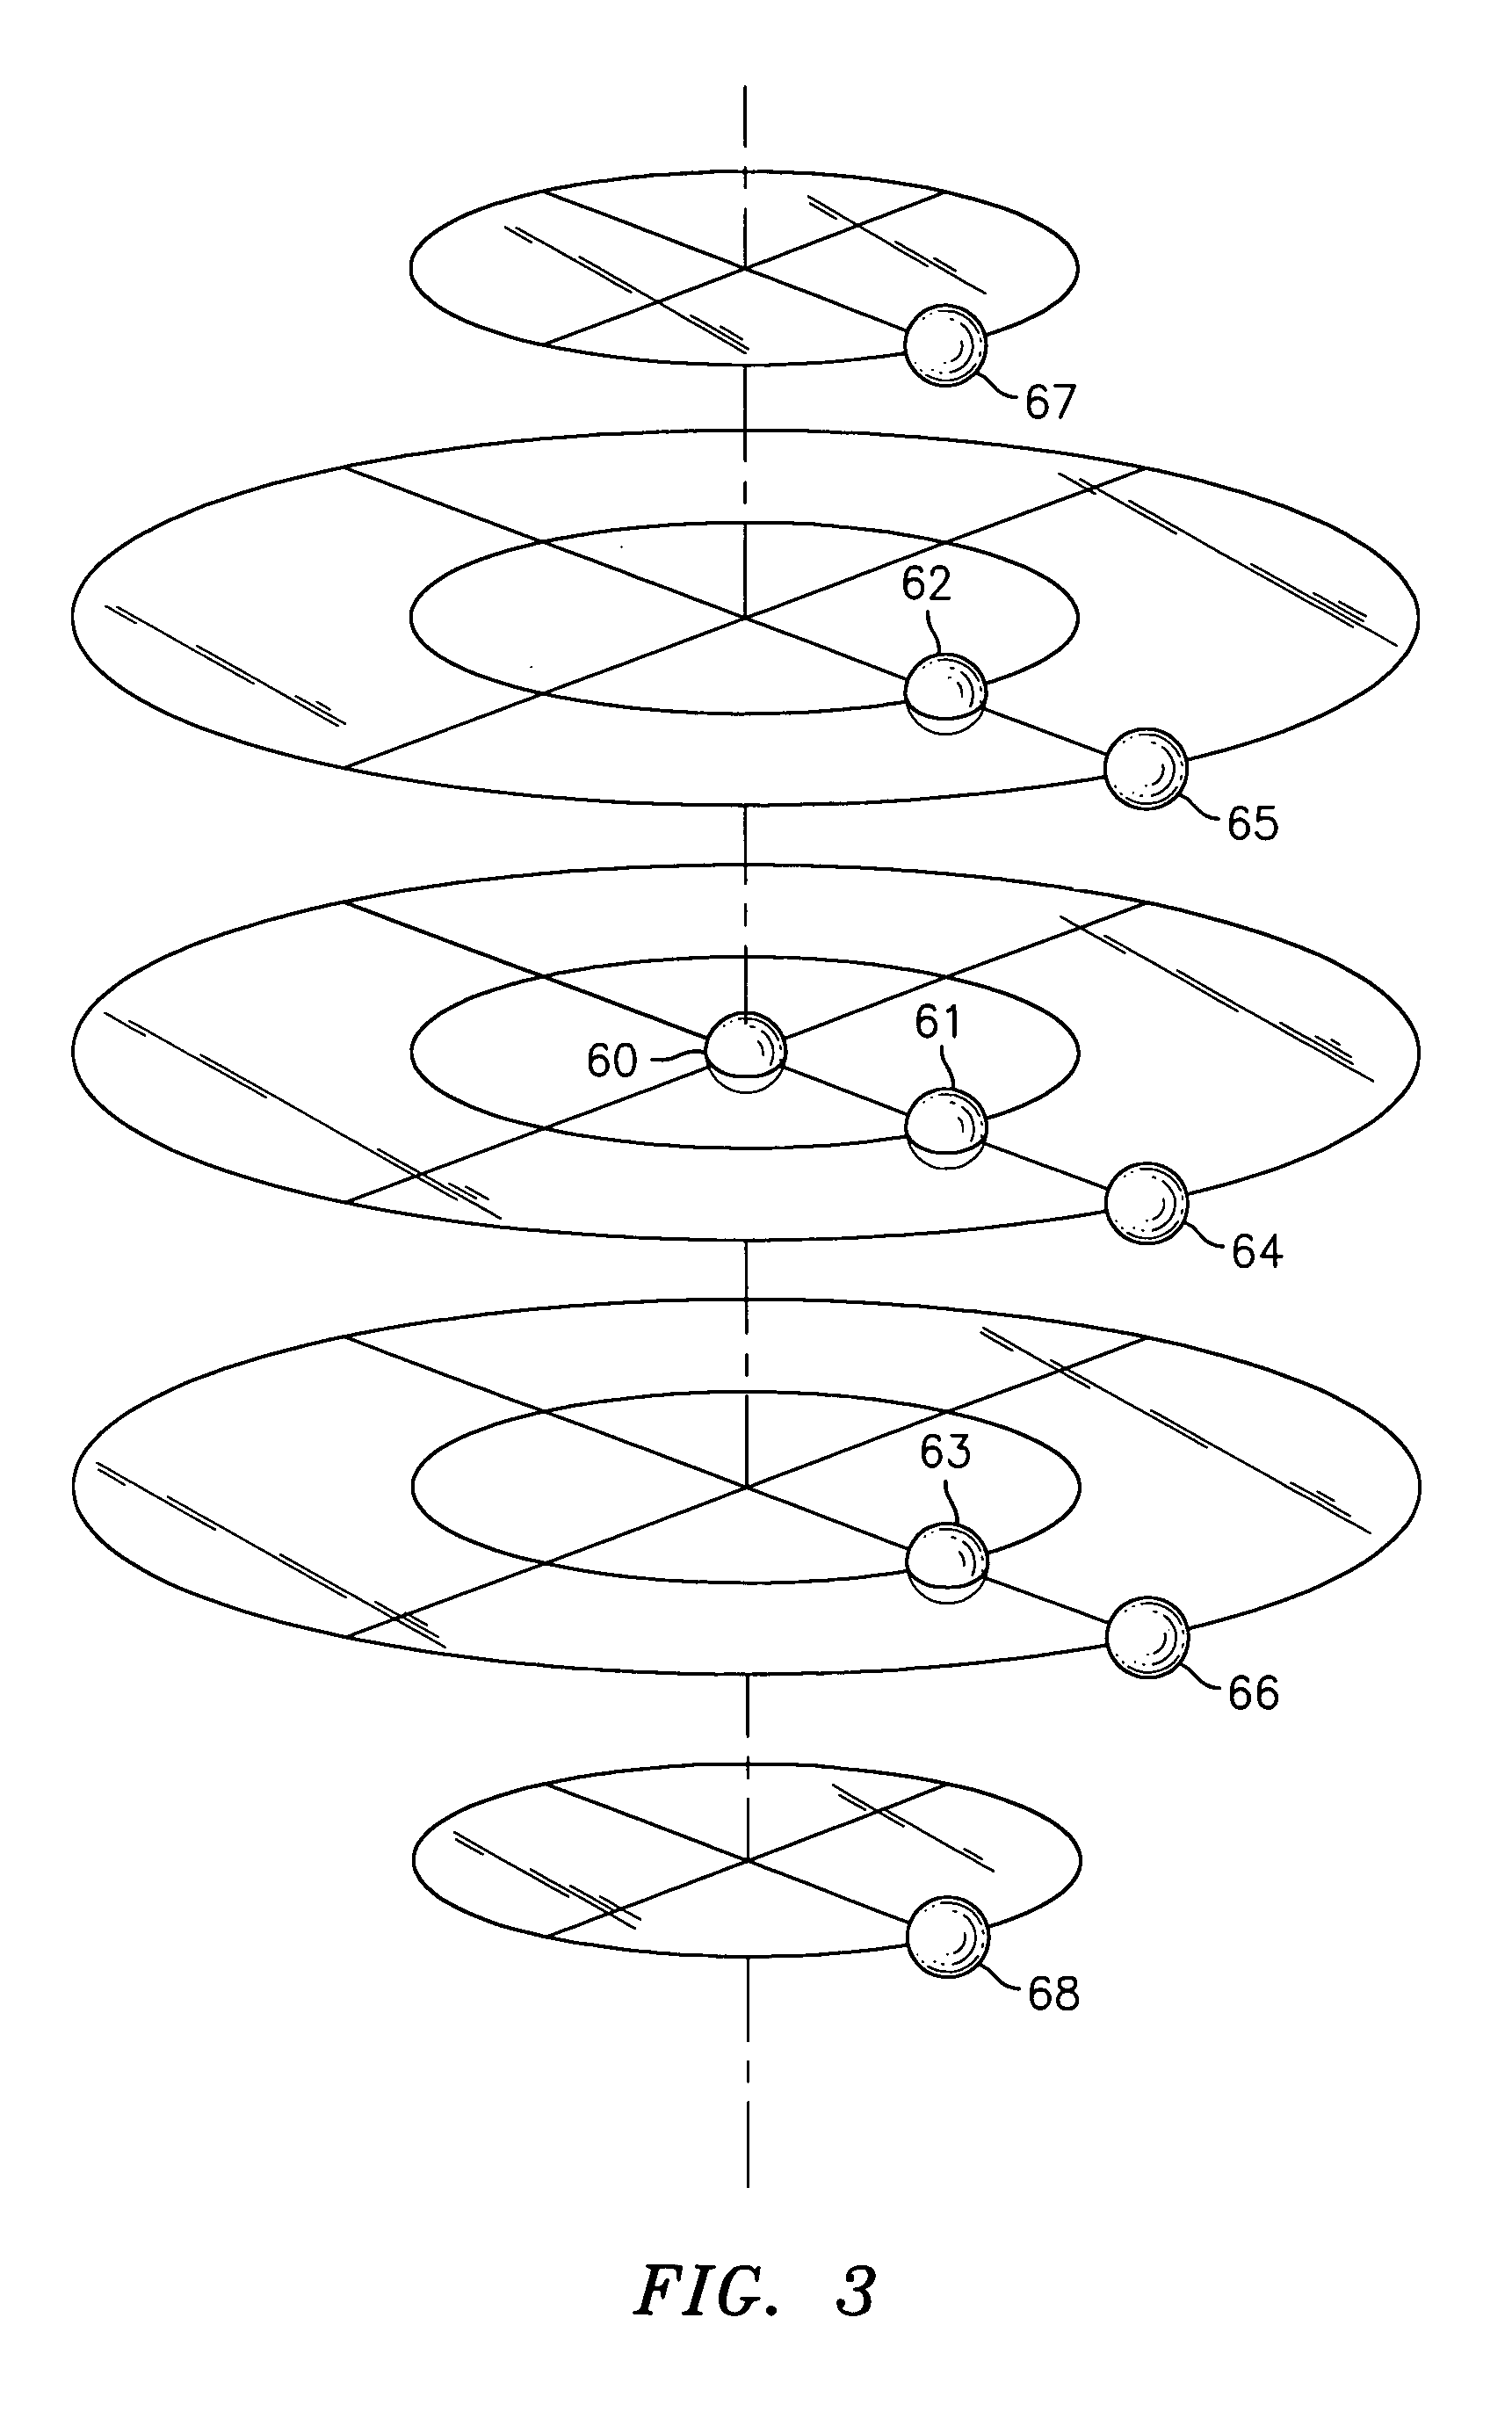
[0027]In a further aspect, the present invention provides the ability to use the space between visual elements as a representation of a relationship, e.g., by placing related elements closer together than elements that have no relationship or only a remote relationship. The present invention provides the ability to introduce depths into a visual space such that the depth conveys distance where elements in the foreground are the focus of attention.

Problems solved by technology

Existing visual presentation systems do not provide a developer or operator means of easily identifying glitches or bottlenecks in complex communication systems.
However, this algorithm uses only a line for each level of hierarchy to arrange the elements and requires the initial placement of elements on the top and bottom hierarchy lines.
Such problems include, but are not limited to, the inability to display attributes of data, the limitation of visualizations to tree-like formats, the inability for a user to intuitively identify problems in a visualization, and the lack of detail in hierarchical descriptions of data.

Method used


Image

  • Network visualization tool utilizing iterative rearrangement of nodes on a grid lattice using gradient method
  • Network visualization tool utilizing iterative rearrangement of nodes on a grid lattice using gradient method
  • Network visualization tool utilizing iterative rearrangement of nodes on a grid lattice using gradient method

Examples


first embodiment

[0167]7. First Embodiment in Hardware

[0168]The schematic hardware structure of a visualization system 10, according to a first embodiment of the present invention, is shown in FIG. 6A. The system 10 comprises a memory 11 for storing network data 12, a memory 13 for storing the corresponding data structure 14, a processor 15 (CPU), an interface 16, a bus structure 17, and input / output means 18. The interface 16 and input / output means 18 allow the visualization system 10 to be connected to a display screen, network, or the like. Furthermore, the system 10 is capable of receiving input through the input / output means 18 and interface 16. Note that in the present embodiment there is one memory 11 for storing the network data 12 and one memory 13 for storing the data structure 14. The network data 12 and the data structure 14 can likewise be stored in one and the same memory. A tape drive, a hard disk drive, a semiconductor memory, or any other storage system may serve as memory.

[0169]In ...

second embodiment

[0173]8. Second Embodiment in Hardware

[0174]The schematic hardware structure of a visualization system 30, according to a second embodiment of the present invention, is shown in FIG. 7A. This system 30 comprises an input 32. This input 32 may receive data from a keyboard, a mouse, or some other peripheral device, or from a communications link, for example. The system 30 furthermore comprises a memory 31 which stores the data, network data, and data structure. Memory 31 may be a random access memory (RAM) for example. There is also a processor 35 and an output interface 33 with a graphics processor 34 and a graphics display generator 36. The processor 35 accesses and / or fetches, as necessary, files (e.g. the network data and data structure) and programs (e.g. a program that embodies the present invention) from memory 31. The graphics processor 34 can be implemented as either a hardware circuit or as a software program recalled from memory 31 and executed by the processor 35. In opera...


PUM


Abstract

A visualization system and method for visualization of network data, which is data that represents elements and links between elements. The network data is converted into a data structure, which represents a grid arrangement of the elements, where each element is placed on an individual grid position of a lattice. The data structure is suitable for use by a graphics display. The visualization tool comprises a processing unit that generates an initial data structure which represents an initial grid arrangement of the elements. It then assigns a global value to this initial grid arrangement and employs a gradient method for converting the initial grid arrangement into another grid arrangement which has a decreased or an increased global value.

Description

PRIORITY[0001]This application claims priority to an application entitled “Network Visualization Tool” filed in the European Patent Office on Sep. 13, 1999 and assigned Patent Application No. 99810817.9, the contents of which are hereby incorporated by reference.BACKGROUND OF THE INVENTION[0002]1. Field of the Invention[0003]The present invention relates generally to the visualization of data, and in particular, to a device and method for visualizing networks by converting network data into a data structure.[0004]2. Description of the Related Art[0005]Data, when presented as rows and columns of numbers and text, is typically raw and undifferentiated. To be useful, raw data must be organized into intelligible categories. Data can also be obscure in the sense that its relevant attributes and relationships are hidden. Normally, the user must conduct an investigation (e.g. by using appropriate data mining tools) to discover such relationships and attributes.[0006]If one presents data in...

Claims


Application Information

Patent Timeline
IPC IPC(8): G06F17/00G06F7/00
CPCH04L41/22Y10S707/99945Y10S707/99943
Inventor KLENK, JUERGENZIEGLER, PATRICK
Owner IBM CORP
Learn More