Method for measuring diffusivities of compounds using microchips

a technology of microchips and compounds, applied in chemical methods analysis, laboratory glassware, instruments, etc., can solve the problems of inconvenient use, single point methods that require extra steps to determine velocity, and inability to accurately assess the change of plugs of materials over the length of channels, so as to reduce the overall concentration and the overall concentration. , the effect of lowering the peak in the downstream concentration profil

Active Publication Date: 2006-05-02
CAPLIPER LIFE SCI INC
View PDF3 Cites 115 Cited by
  • Summary
  • Abstract
  • Description
  • Claims
  • Application Information

AI Technical Summary

Benefits of technology

[0015]As discussed above, dispersion causes the concentration profile of a plug of material injected into a channel in the form of a sharp pulse to approach the shape of a Gaussian curve at any discrete location along the length of the channel downstream of the injection point. As the sample travels further down the channel, more dispersion will occur. Therefore, concentration profiles observed at locations closer to the insertion point of the plug (i.e., upstream) will have a higher peak and a narrower base than concentration profiles observed at locations farther along the length of the channel (i.e., downstream). Dispersion in front of and behind the plug causes the plug to grow in length, which causes the concentration profile of the plug to widen as the plug flows downstream. Also, dispersion lowers the overall concentration at any one point in the concentration profile as the plug flows downstream, resulting in lower peaks in downstream concentration profiles.

Problems solved by technology

If the plugs of material are introduced too closely, however, dispersion may cause the solute in one sample plug to overlap the solute in a second adjacent sample plug by the time the plugs travel to the opposite end of the channel.
Measuring concentration only at a single point does not provide an accurate assessment of the change of a plug of material over the length of the channel.
Also, these single point methods require extra steps to determine velocity.
However, this requires a fairly large sample of the solute in order to create a constant stream and is not suitable when only small volumes of sample material are available.
Further, the technique taught by Kamholz et al. requires complicated mathematical manipulation of data.

Method used


Image

  • Method for measuring diffusivities of compounds using microchips
  • Method for measuring diffusivities of compounds using microchips
  • Method for measuring diffusivities of compounds using microchips

Examples


example 1

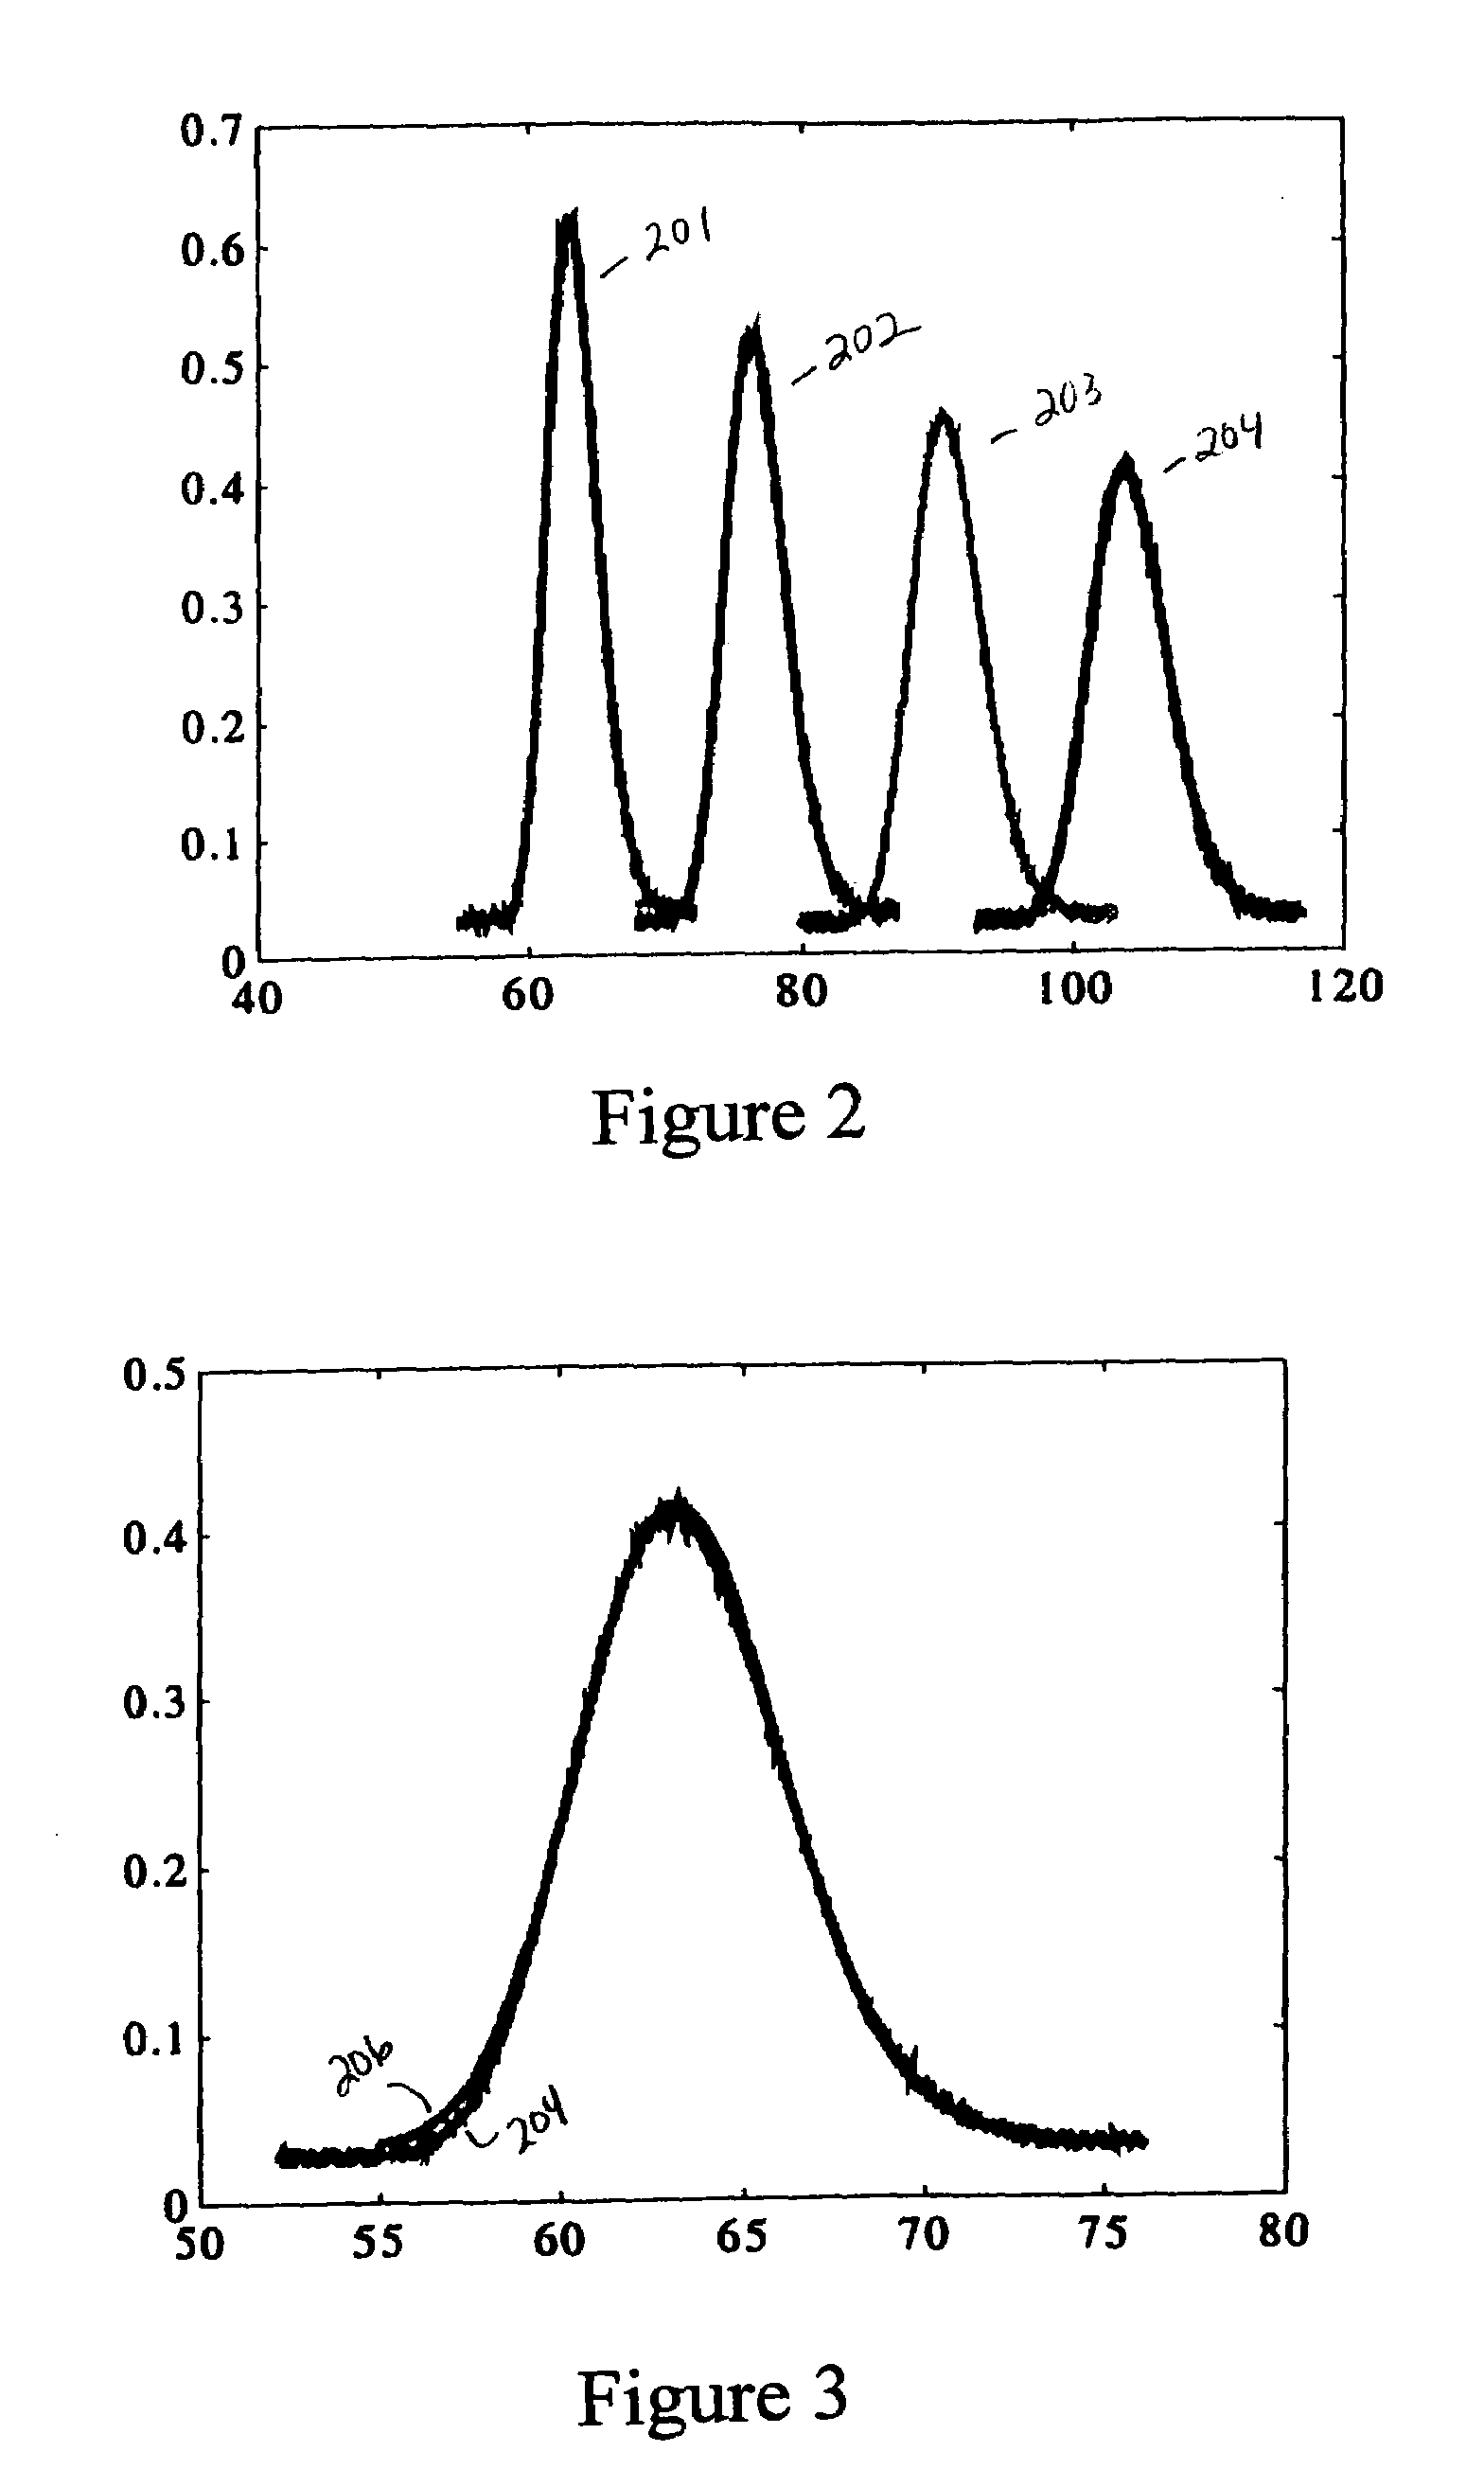
[0052]In this example, the diffusivity was determined based on data detected at a first and fourth detector (i.e., concentration profiles 201 and 204, respectively). However, any two of the concentration profiles of FIG. 2 could be used in the same manner described below. The first concentration profile 201 was modeled using an expression for Gaussian curve f1(x,τ1). The expression f1(x,τ1) was convoluted using the Green's function to create an estimate f4′(x,τ4) for the concentration profile measured by the fourth detector. A value of the Taylor-Aris dispersion coefficient K was then derived by setting the expression for the estimated concentration profile f4′(x,τ4) equal to the measured concentration profile f4(x,τ4). FIG. 3 shows that the estimated concentration profile f4′(x,τ4) 204 calculated using the derived value of K is essentially identical to the actual measured concentration profile f4(x,τ4) 206. Once the Taylor-Aris diffusion coefficient K was found, the molecular diffu...

example 2

[0054]For this second example, the Taylor-Aris dispersion coefficient is calculated by minimizing the value of an expression for the error in an estimated concentration profile. The error was determined by assuming a value of molecular diffusivity D, calculating the corresponding value of K, and inserting that value of K into the previously presented expression for error. To determine the value of D at which the error is minimized, the value of the error is plotted in FIG. 5 as a function of D. The correct value for the molecular diffusivity for the fluorescein dye was determined by finding the lowest point of the curve, where the error is at a minimum (i.e., where the estimated concentration profile f4′(x,τ4) most closely matches the measured concentration profile f4(x,τ4). The value of D at the minimum error is approximately 330 μm2 / s. This value of D agrees closely with the value of D calculated in the previous example.


PUM

PropertyMeasurementUnit
diameteraaaaaaaaaa
diameteraaaaaaaaaa
concentrationaaaaaaaaaa

Abstract

A method for determining the molecular diffusivity of a solute in a microchannel where a solute is introduced into a first end of a microchannel and a first concentration profile is measured at first and second locations along the microchannel. A theoretical concentration profile can be calculated at the second location based on the measured first concentration profile at the first location. The molecular diffusivity can be found by minimizing the error when comparing the theoretical concentration profile to the measured second concentration profile. Further, this technique allows for average velocity to be measured simultaneously with molecular diffusivity.

Description

BACKGROUND OF THE INVENTION[0001]This invention relates to a method for calculating the molecular diffusivity of a solute in a channel, such as a capillary, tube or microfluidic channel. More particularly, this invention relates to calculating molecular diffusivity of a solute using Taylor dispersion concepts.[0002]Recent efforts have been directed towards the development of microscale assay methods in which various chemical and biological processes may be examined in rapid succession and with small amounts of material. Such microscale assay methods can be carried out in, for example, microfluidic devices. A typical microfluidic device, which can be fabricated from a glass, silica or plastic substrate, contains a network of microscale channels through which fluids and chemicals are moved in order to perform an assay. These devices use minute quantities of fluids or other materials, controllably flowed and / or directed, to generate highly reproducible and rapidly changeable microenvir...

Claims


Application Information

Patent Timeline
Patent Type & Authority Patents(United States)
IPC IPC(8): G06F19/00B01L3/00G01N13/00G01N27/447
CPCG01N27/44756G01N13/00B01L3/5027G01N2013/003
Inventor TRIPATHI, ANUBHAVMOLHO, JOSH
Owner CAPLIPER LIFE SCI INC
Why Eureka
Try Eureka